Observational Study
. 2020 Feb 18;323(7):636-645.
doi: 10.1001/jama.2019.22241.

Predictive Accuracy of a Polygenic Risk Score-Enhanced Prediction Model vs a Clinical Risk Score for Coronary Artery Disease

Affiliations
Observational Study

Predictive Accuracy of a Polygenic Risk Score-Enhanced Prediction Model vs a Clinical Risk Score for Coronary Artery Disease

Joshua Elliott et al. JAMA. .

Abstract

Importance: The incremental value of polygenic risk scores in addition to well-established risk prediction models for coronary artery disease (CAD) is uncertain.

Objective: To examine whether a polygenic risk score for CAD improves risk prediction beyond pooled cohort equations.

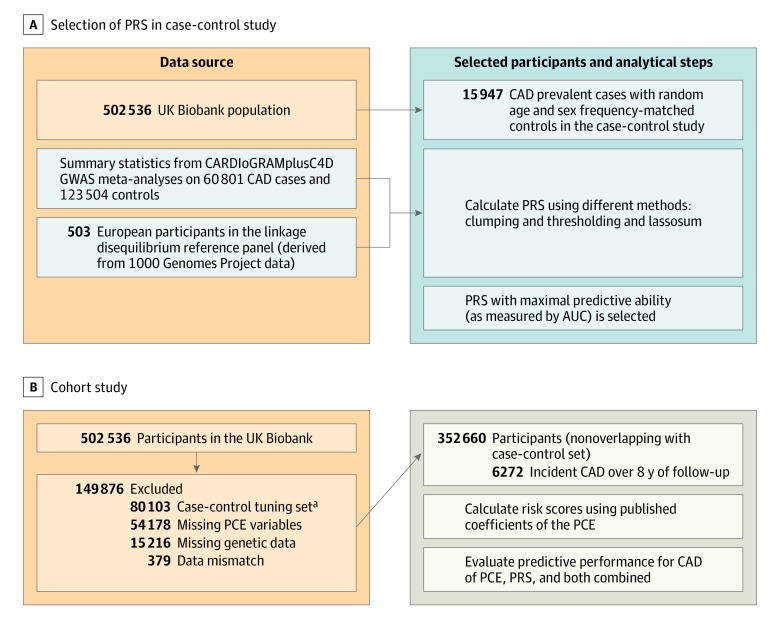
Design, setting, and participants: Observational study of UK Biobank participants enrolled from 2006 to 2010. A case-control sample of 15 947 prevalent CAD cases and equal number of age and sex frequency-matched controls was used to optimize the predictive performance of a polygenic risk score for CAD based on summary statistics from published genome-wide association studies. A separate cohort of 352 660 individuals (with follow-up to 2017) was used to evaluate the predictive accuracy of the polygenic risk score, pooled cohort equations, and both combined for incident CAD.

Exposures: Polygenic risk score for CAD, pooled cohort equations, and both combined.

Main outcomes and measures: CAD (myocardial infarction and its related sequelae). Discrimination, calibration, and reclassification using a risk threshold of 7.5% were assessed.

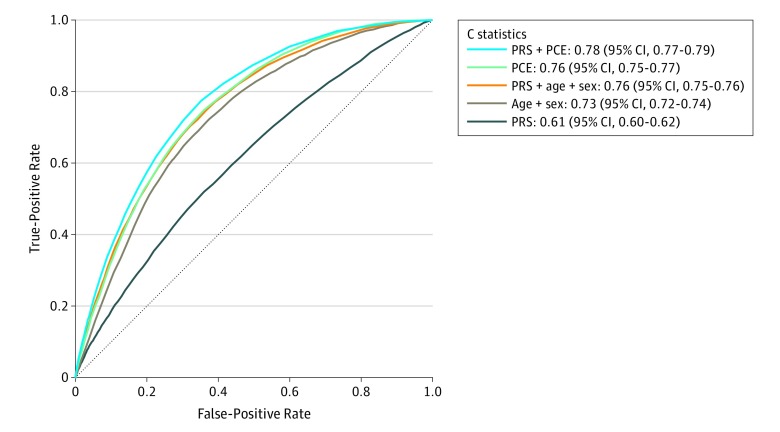
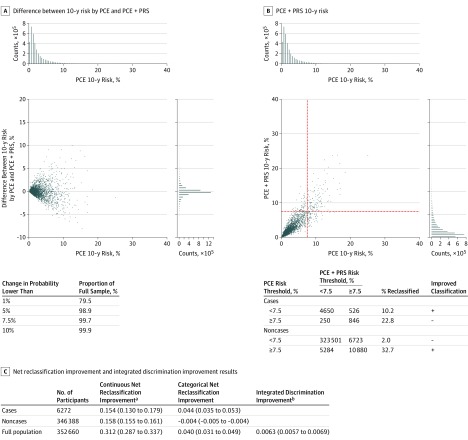
Results: In the cohort of 352 660 participants (mean age, 55.9 years; 205 297 women [58.2%]) used to evaluate the predictive accuracy of the examined models, there were 6272 incident CAD events over a median of 8 years of follow-up. CAD discrimination for polygenic risk score, pooled cohort equations, and both combined resulted in C statistics of 0.61 (95% CI, 0.60 to 0.62), 0.76 (95% CI, 0.75 to 0.77), and 0.78 (95% CI, 0.77 to 0.79), respectively. The change in C statistic between the latter 2 models was 0.02 (95% CI, 0.01 to 0.03). Calibration of the models showed overestimation of risk by pooled cohort equations, which was corrected after recalibration. Using a risk threshold of 7.5%, addition of the polygenic risk score to pooled cohort equations resulted in a net reclassification improvement of 4.4% (95% CI, 3.5% to 5.3%) for cases and -0.4% (95% CI, -0.5% to -0.4%) for noncases (overall net reclassification improvement, 4.0% [95% CI, 3.1% to 4.9%]).

Conclusions and relevance: The addition of a polygenic risk score for CAD to pooled cohort equations was associated with a statistically significant, yet modest, improvement in the predictive accuracy for incident CAD and improved risk stratification for only a small proportion of individuals. The use of genetic information over the pooled cohort equations model warrants further investigation before clinical implementation.


Conflict of interest statement

Conflict of Interest Disclosures: None reported.

Figures

Figure 1.
Figure 1.. Study Design and Flowchart for Coronary Artery Disease (CAD)
To select the method with the best discrimination based on area under the curve (AUC), clumping and thresholding and lassosum were used to calculate polygenetic risk scores (PRS) applied to a case-control set (prevalent cases). For this calculation, summary data from the largest genome-wide association study (GWAS) on CAD (CARDIoGRAMplusC4DREF) that excludes UK Biobank and data on linkage disequilibrium were used. The resulting PRS was applied to a nonoverlapping set of participants from the UK Biobank with no preexisting cardiovascular disease, aged 40 to 69 years at baseline, and who were followed up for incident CAD events. In this population, the pooled cohort equations (PCE) model was calculated and different models (PRS, PCE, and PCE enhanced with PRS) were compared in terms of their predictive accuracy based on discrimination, calibration, and reclassification metrics. aCAD and cardiovascular disease tuning sets combined.
Figure 2.
Figure 2.. Density Plots of the Adjusted Polygenic Risk Score and the Pooled Cohort Equations for Coronary Artery Disease Cases and Controls in Cohort Analysis
After calculating the polygenic risk score on the selected single-nucleotide polymorphisms, residual values of the polygenic risk score are plotted from regression against sex, age, batch, and the first 10 principal components.
Figure 3.
Figure 3.. Receiver Operator Characteristic Curves and C Statistics for Different Models in Cohort Analyses of 352 660 Participants Aged 40 to 69 Years Old Over a Mean of 8 Years of Follow-up With 6272 Incident Coronary Artery Disease (CAD) Events
See eTable 2 in the Supplement for the definition of CAD. PCE indicates pooled cohort equations; PRS, polygenic risk score.
Figure 4.
Figure 4.. Change in Predicted Probabilities and Risk Reclassification
A, Change in the predicted probabilities (expressed as a percentage) of the recalibrated model with pooled cohort equations (PCE) after the addition of the polygenic risk score (PRS) for coronary artery disease (CAD). The x-axis is the predicted probability from the original PCE model, and the y-axis is the difference in 10-year probabilities of an event between the PRS-augmented model and PCE. A random draw of 1% of the participants is represented on the scatter plot. Histograms along the x- and y-axes are based on all participants. The associated table shows the percentage of participants whose predicted probabilities changed by less than the given thresholds. B, Predicted probabilities by PCE and PCE plus PRS, with dotted lines showing the 7.5% threshold. The associated table shows the numbers reclassified according to a 7.5% risk threshold. Rows corresponding to an improved classification with the PCE + PRS model are denoted by a plus sign and a deterioration of the classification by a minus sign. C, Table of net reclassification improvement (NRI) and integrated discrimination improvement (IDI). The NRI is defined by (1) in the continuous case, the sum of proportions of cases and noncases with improved combined score (ie, higher combined score for cases denoted by P[up|case] {where P indicates probability} and lower for noncases denoted by P[down|noncase]) minus the sum of proportions with deteriorated combined score (ie, P[up|noncase]) and P[down|case]), and (2) in the categorical case, as changes in 7.5% predicted probability. A positive NRI indicates a better combined score overall. The IDI measures the increase in the difference of average probabilities of an event in cases (PPCE+PRS[case] and PPCE [case]) and noncases (PPCE+PRS[noncase]) and PPCE [noncase]). The higher the IDI, the more discriminant the combined score. In this case, the increase in risk difference between cases and noncases after addition of the PRS for CAD to PCE was only 0.6%, indicating a small difference. aNRI = P(up|case) − P(down|case) − P(up|noncase) + P(down|noncase). bIDI = Ppce+prs(case) − Ppce+prs(noncase) − Ppce(case) + Ppce(noncase).

Comment in

  • doi: 10.1001/jama.2019.21667

References

    1. GBD 2016 Causes of Death Collaborators Global, regional, and national age-sex specific mortality for 264 causes of death, 1980-2016: a systematic analysis for the Global Burden of Disease Study 2016. Lancet. 2017;390(10100):1151-1210. doi:10.1016/S0140-6736(17)32152-9 - DOI - PMC - PubMed
    1. Damen JA, Hooft L, Schuit E, et al. . Prediction models for cardiovascular disease risk in the general population: systematic review. BMJ. 2016;353:i2416. doi:10.1136/bmj.i2416 - DOI - PMC - PubMed
    1. Arnett DK, Blumenthal RS, Albert MA, et al. . 2019 ACC/AHA guideline on the primary prevention of cardiovascular disease: a report of the American College of Cardiology/American Heart Association Task Force on Clinical Practice Guidelines. J Am Coll Cardiol. 2019;74(10):e177-e232. doi:10.1016/j.jacc.2019.03.010 - DOI - PMC - PubMed
    1. Musunuru K, Kathiresan S. Genetics of common, complex coronary artery disease. Cell. 2019;177(1):132-145. doi:10.1016/j.cell.2019.02.015 - DOI - PubMed
    1. Knowles JW, Ashley EA. Cardiovascular disease: the rise of the genetic risk score. PLoS Med. 2018;15(3):e1002546. doi:10.1371/journal.pmed.1002546 - DOI - PMC - PubMed

Publication types