

Estimating progress towards meeting women's contraceptive needs in 185 countries: A Bayesian hierarchical modelling study
- PMID: 32069289
- PMCID: PMC7028249
- DOI: 10.1371/journal.pmed.1003026
Estimating progress towards meeting women's contraceptive needs in 185 countries: A Bayesian hierarchical modelling study
Abstract
Background: Expanding access to contraception and ensuring that need for family planning is satisfied are essential for achieving universal access to reproductive healthcare services, as called for in the 2030 Agenda for Sustainable Development. Monitoring progress towards these outcomes is well established for women of reproductive age (15-49 years) who are married or in a union (MWRA). For those who are not, limited data and variability in data sources and indicator definitions make monitoring challenging. To our knowledge, this study is the first to provide data and harmonised estimates that enable monitoring for all women of reproductive age (15-49 years) (WRA), including unmarried women (UWRA). We seek to quantify the gaps that remain in meeting family-planning needs among all WRA.
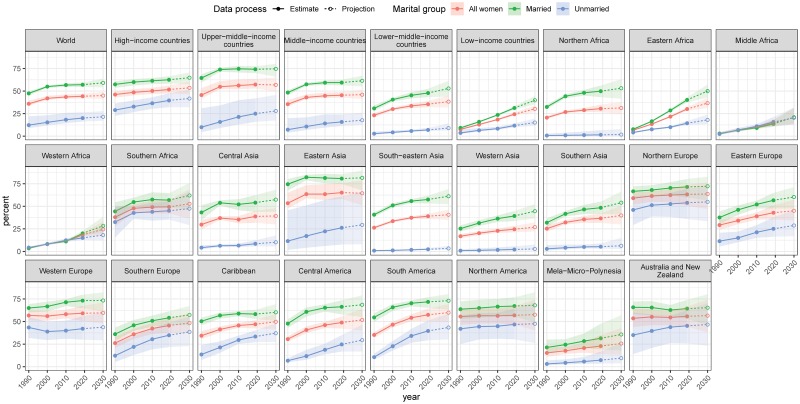
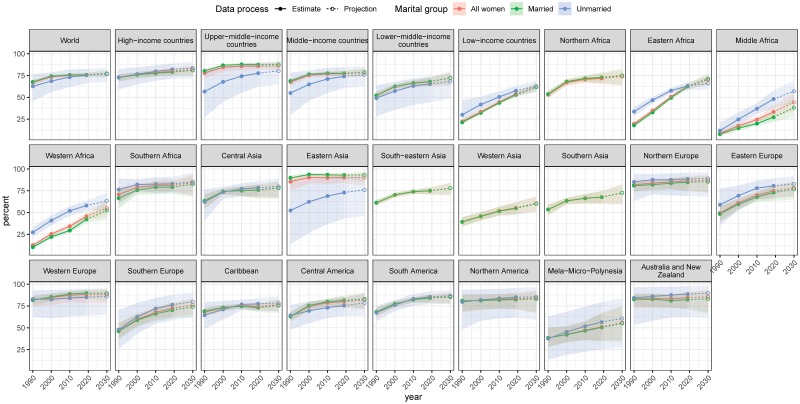
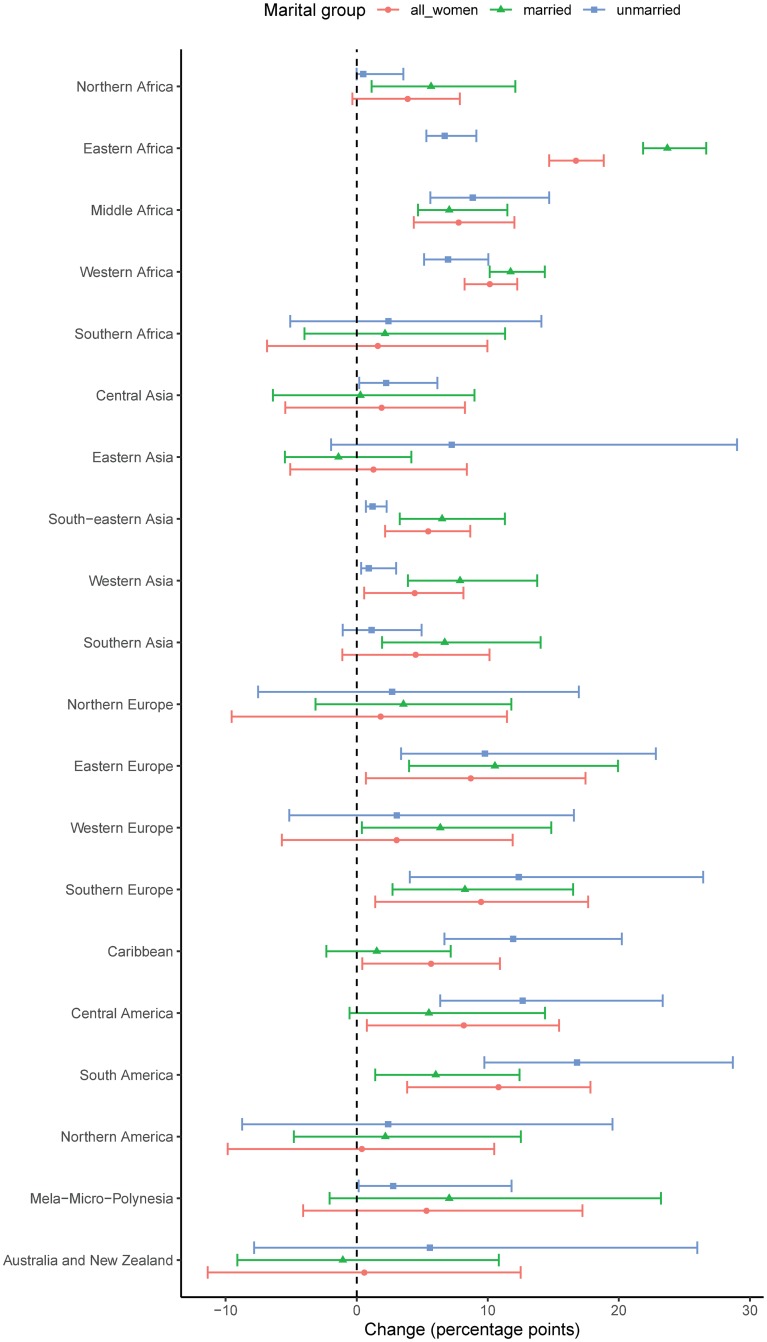
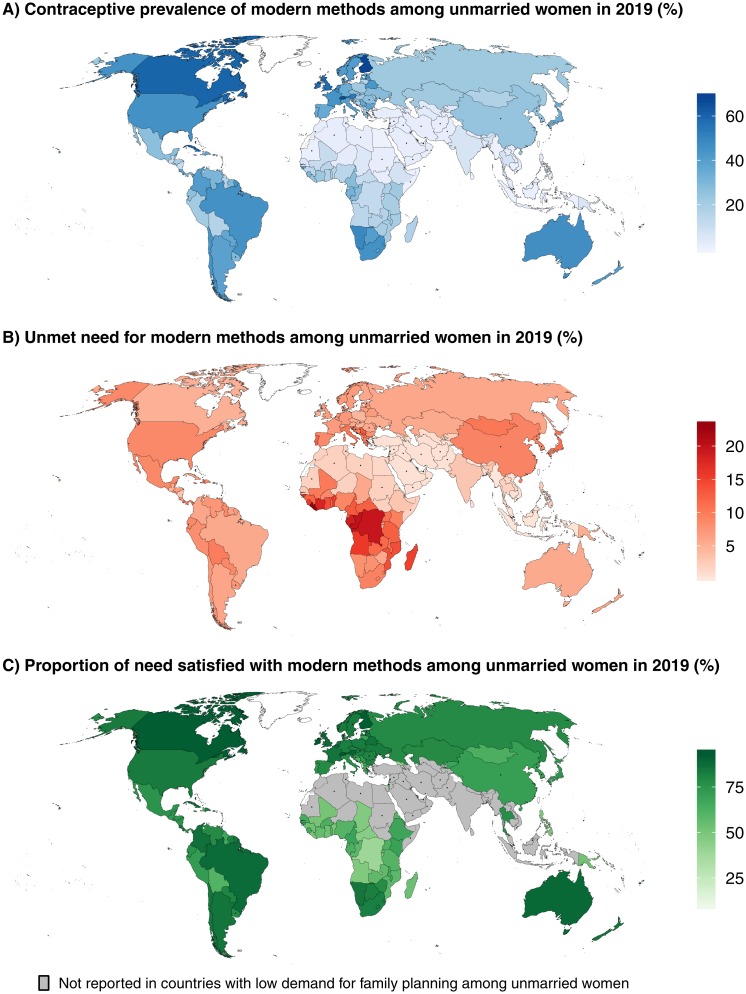
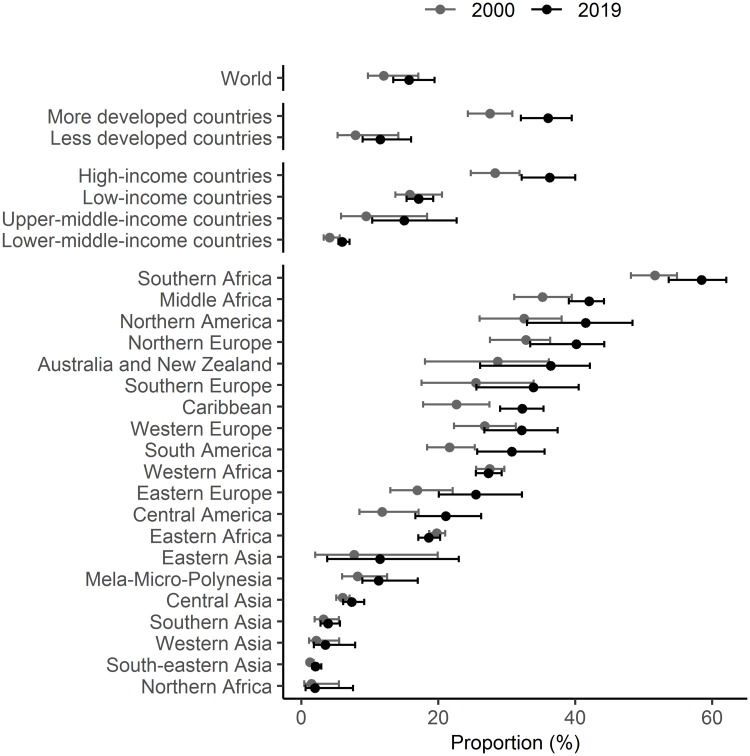
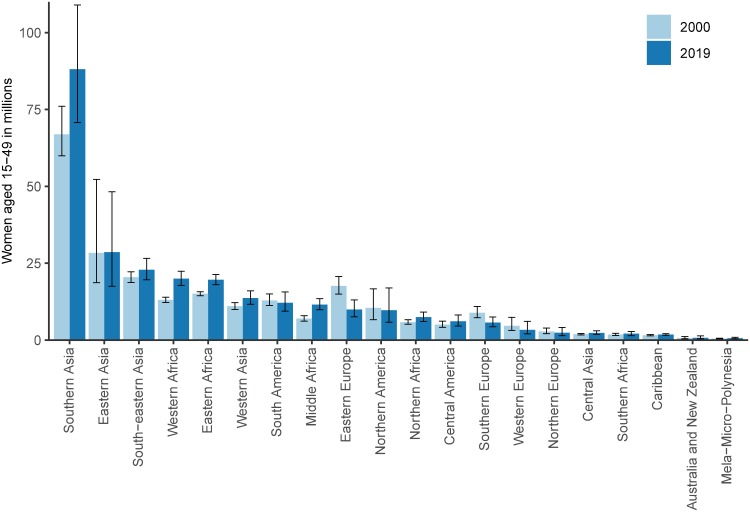
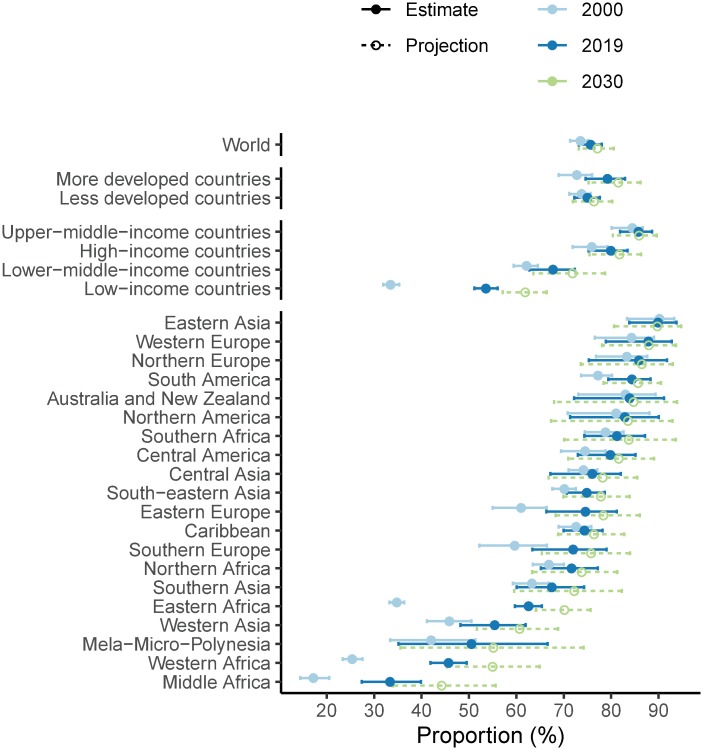
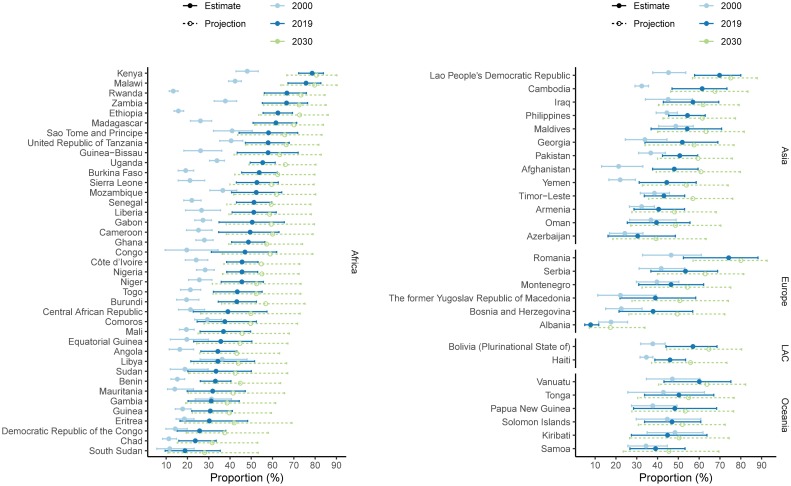
Methods and findings: In a systematic analysis, we compiled a comprehensive dataset of family-planning indicators among WRA from 1,247 nationally representative surveys. We used a Bayesian hierarchical model with country-specific time trends to estimate these indicators, with 95% uncertainty intervals (UIs), for 185 countries. We produced estimates from 1990 to 2019 and projections from 2019 to 2030 of contraceptive prevalence and unmet need for family planning among MWRA, UWRA, and all WRA, taking into account the changing proportions that were married or in a union. The model accounted for differences in the prevalence of sexual activity among UWRA across countries. Among 1.9 billion WRA in 2019, 1.11 billion (95% UI 1.07-1.16) have need for family planning; of those, 842 million (95% UI 800-893) use modern contraception, and 270 million (95% UI 246-301) have unmet need for modern methods. Globally, UWRA represented 15.7% (95% UI 13.4%-19.4%) of all modern contraceptive users and 16.0% (95% UI 12.9%-22.1%) of women with unmet need for modern methods in 2019. The proportion of the need for family planning satisfied by modern methods, Sustainable Development Goals (SDG) indicator 3.7.1, was 75.7% (95% UI 73.2%-78.0%) globally, yet less than half of the need for family planning was met in Middle and Western Africa. Projections to 2030 indicate an increase in the number of women with need for family planning to 1.19 billion (95% UI 1.13-1.26) and in the number of women using modern contraception to 918 million (95% UI 840-1,001). The main limitations of the study are as follows: (i) the uncertainty surrounding estimates for countries with little or no data is large; and (ii) although some adjustments were made, underreporting of contraceptive use and needs is likely, especially among UWRA.
Conclusions: In this study, we observed that large gaps remain in meeting family-planning needs. The projected increase in the number of women with need for family planning will create challenges to expand family-planning services fast enough to fulfil the growing need. Monitoring of family-planning indicators for all women, not just MWRA, is essential for accurately monitoring progress towards universal access to sexual and reproductive healthcare services-including family planning-by 2030 in the SDG era with its emphasis on 'leaving no one behind.'
Conflict of interest statement
The authors have declared that no competing interests exist.
Figures
References
-
- United Nations. Report of the International Conference on Population and Development, Cairo, 5–13 September 1994. New York (NY): United Nations; 1994. Sales No. E.95.XIII.18.
-
- United Nations General Assembly. Transforming Our World: The 2030 Agenda for Sustainable Development. Resolution adopted by the General Assembly on 25 September 2015 (A/RES/70/1). New York (NY): United Nations; 2015. https://sustainabledevelopment.un.org/post2015/transformingourworld. [cited 22 Jan 2020].
-
- Every Woman Every Child. The Global Strategy for Women’s, Children’s and Adolescents Health (2016–2030). New York (NY): Every Woman Every Child; 2015. http://globalstrategy.everywomaneverychild.org/. [cited 22 Jan 2020].
-
- United Nations, Department of Economic and Social Affairs, Population Division. World Contraceptive Use 2019. New York (NY): United Nations; 2019. https://www.un.org/en/development/desa/population/publications/dataset/c.... [cited 22 Jan 2020].
Publication types
MeSH terms
LinkOut - more resources
Full Text Sources
Medical
Miscellaneous
