

Concentrations of criteria pollutants in the contiguous U.S., 1979 - 2015: Role of prediction model parsimony in integrated empirical geographic regression
- PMID: 32069301
- PMCID: PMC7028280
- DOI: 10.1371/journal.pone.0228535
Concentrations of criteria pollutants in the contiguous U.S., 1979 - 2015: Role of prediction model parsimony in integrated empirical geographic regression
Abstract
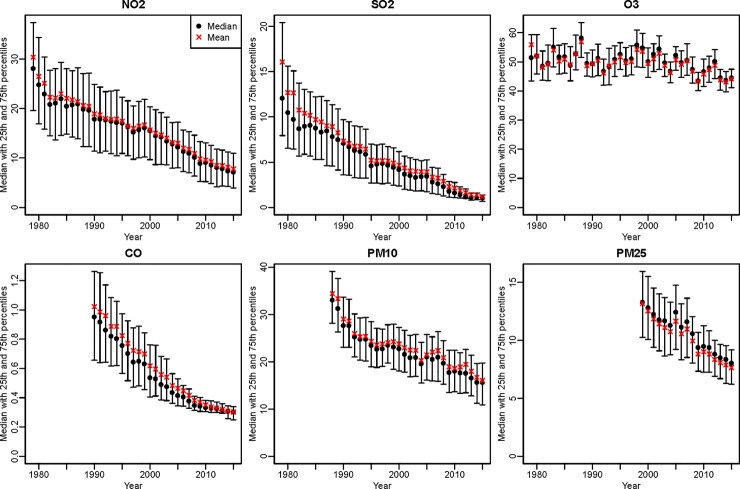
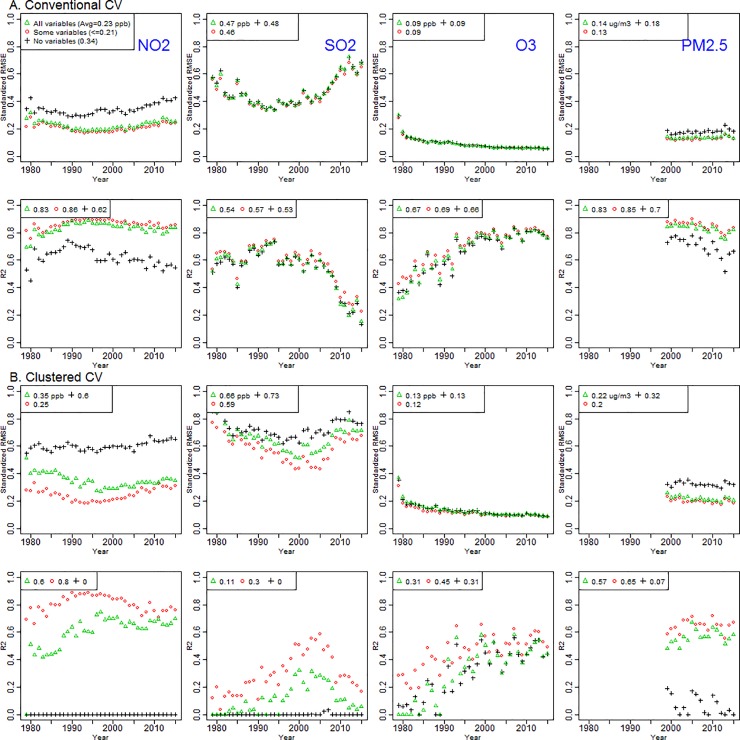
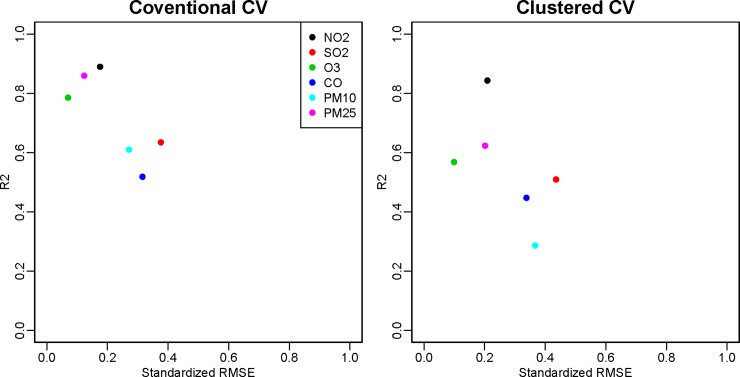
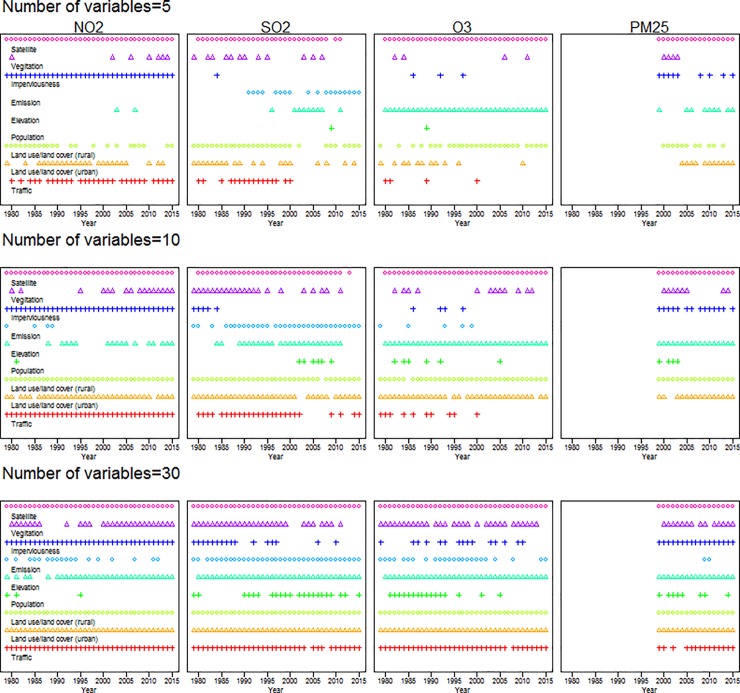
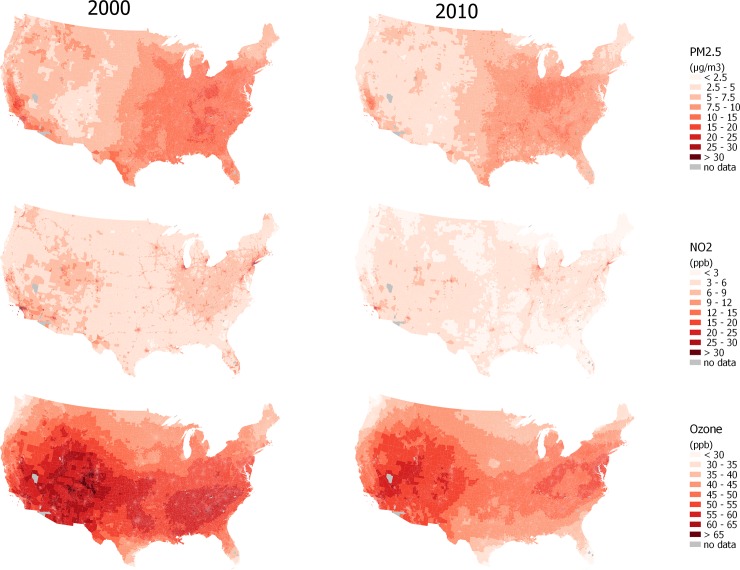
National-scale empirical models for air pollution can include hundreds of geographic variables. The impact of model parsimony (i.e., how model performance differs for a large versus small number of covariates) has not been systematically explored. We aim to (1) build annual-average integrated empirical geographic (IEG) regression models for the contiguous U.S. for six criteria pollutants during 1979-2015; (2) explore systematically the impact on model performance of the number of variables selected for inclusion in a model; and (3) provide publicly available model predictions. We compute annual-average concentrations from regulatory monitoring data for PM10, PM2.5, NO2, SO2, CO, and ozone at all monitoring sites for 1979-2015. We also use ~350 geographic characteristics at each location including measures of traffic, land use, land cover, and satellite-based estimates of air pollution. We then develop IEG models, employing universal kriging and summary factors estimated by partial least squares (PLS) of geographic variables. For all pollutants and years, we compare three approaches for choosing variables to include in the PLS model: (1) no variables, (2) a limited number of variables selected from the full set by forward selection, and (3) all variables. We evaluate model performance using 10-fold cross-validation (CV) using conventional and spatially-clustered test data. Models using 3 to 30 variables selected from the full set generally have the best performance across all pollutants and years (median R2 conventional [clustered] CV: 0.66 [0.47]) compared to models with no (0.37 [0]) or all variables (0.64 [0.27]). Concentration estimates for all Census Blocks reveal generally decreasing concentrations over several decades with local heterogeneity. Our findings suggest that national prediction models can be built by empirically selecting only a small number of important variables to provide robust concentration estimates. Model estimates are freely available online.
Conflict of interest statement
The authors have declared that no competing interests exist.
Figures
References
-
- Eeftens M, Beelen R, de Hoogh K, Bellander T, Cesaroni G, Cirach M, et al. Development of land use regression models for PM(2.5), PM(2.5) absorbance, PM(10) and PM(coarse) in 20 European study areas; results of the ESCAPE project. Environ. Sci. Technol. 2012;46(20):11195–11205. 10.1021/es301948k - DOI - PubMed
-
- Keller JP, Olives C, Kim SY, Sheppard L, Sampson PD, Szpiro AA, et al. A unified spatiotemporal modeling approach for prediction of multiple air pollutants in the multi-ethnic study of atherosclerosis and air pollution. Environ. Health Perspect. 2015;123(4):301–309. 10.1289/ehp.1408145 - DOI - PMC - PubMed
-
- Kim SY, Olives C, Sheppard L, Sampson PD, Larson TV, Keller JP, et al. Historical prediction modeling approach for estimating long-term concentrations of PM2.5 in cohort studies before the 1999 implementation of widespread monitoring. Environ Health Perspect. 2017;125(1):38–46. 10.1289/EHP131 - DOI - PMC - PubMed
Publication types
MeSH terms
Substances
Grants and funding
LinkOut - more resources
Full Text Sources
Medical
