. 2020 Mar 6:19:1219-1236.
doi: 10.1016/j.omtn.2020.01.010. Epub 2020 Jan 17.

miRNA-31 Improves Cognition and Abolishes Amyloid-β Pathology by Targeting APP and BACE1 in an Animal Model of Alzheimer's Disease

Affiliations

miRNA-31 Improves Cognition and Abolishes Amyloid-β Pathology by Targeting APP and BACE1 in an Animal Model of Alzheimer's Disease

Ana Teresa Barros-Viegas et al. Mol Ther Nucleic Acids. .

Abstract

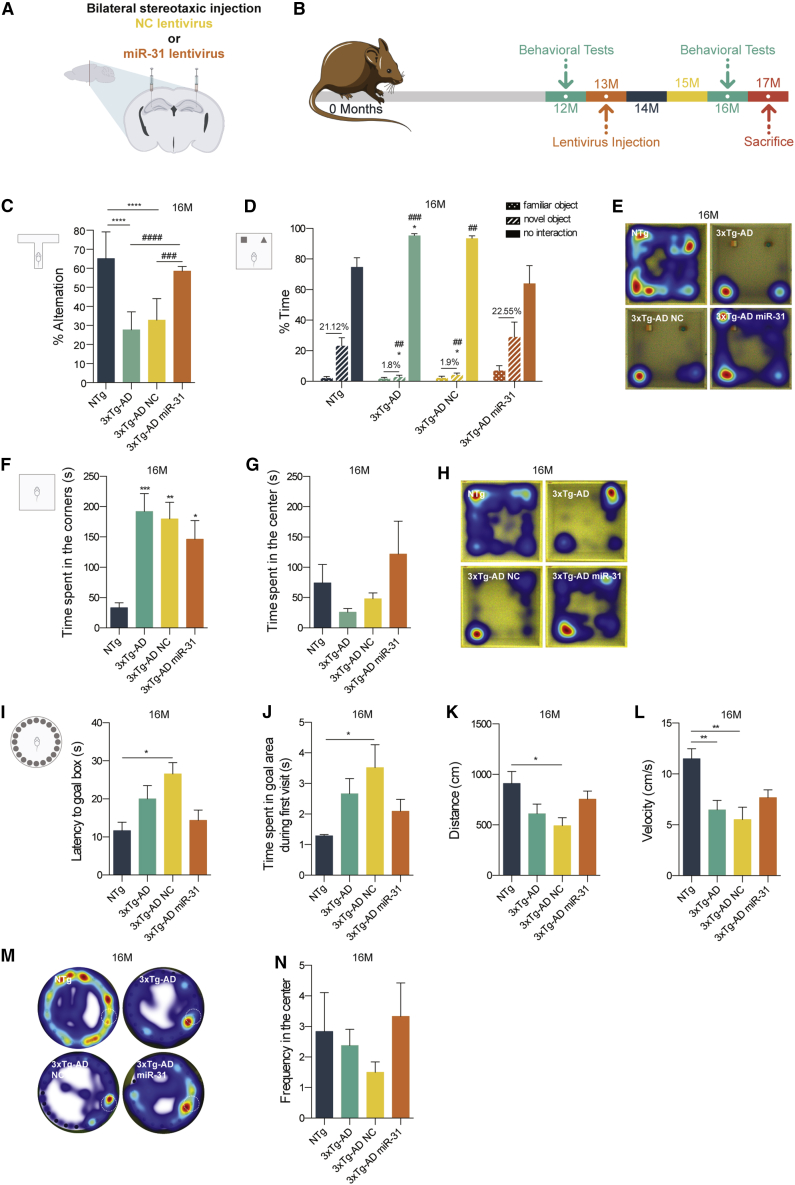
Alzheimer's disease (AD) is the most common form of dementia worldwide, characterized by progressive memory impairment, behavioral changes, and, ultimately, loss of consciousness and death. Recently, microRNA (miRNA) dysfunction has been associated with increased production and impaired clearance of amyloid-β (Aβ) peptides, whose accumulation is one of the most well-known pathophysiological markers of this disease. In this study, we identified several miRNAs capable of targeting key proteins of the amyloidogenic pathway. The expression of one of these miRNAs, miR-31, previously found to be decreased in AD patients, was able to simultaneously reduce the levels of APP and Bace1 mRNA in the hippocampus of 17-month-old AD triple-transgenic (3xTg-AD) female mice, leading to a significant improvement of memory deficits and a reduction in anxiety and cognitive inflexibility. In addition, lentiviral-mediated miR-31 expression significantly ameliorated AD neuropathology in this model, drastically reducing Aβ deposition in both the hippocampus and subiculum. Furthermore, the increase of miR-31 levels was enough to reduce the accumulation of glutamate vesicles in the hippocampus to levels found in non-transgenic age-matched animals. Overall, our results suggest that miR-31-mediated modulation of APP and BACE1 can become a therapeutic option in the treatment of AD.

Keywords: APP; Alzheimer’s disease; BACE1; amyloid-β peptide; cognitive function; gene therapy; lentiviral vector; memory; miR-31.


Figures

None
Graphical abstract
Figure 1
Figure 1
Expression of miR-31 Decreases APP and Bace1 Expression Levels (A) Schematic representation of the predicted binding sites of the miRNAs in the 3′ UTR of genes of interest. miR-17-3p, miR-31-5p, miR-200c-3p, and miR-497-3p are predicted to bind the 3′ UTR of human APP mRNA, while miR-31-5p and miR-497-3p are also predicted to bind the 3′ UTR of mouse Bace1 mRNA. Additionally, miR-31-5p has a putative binding site in the CDS of human APP mRNA encoding the APP695 protein isoform. (B–D) Biochemical validation of putative binding sites was performed employing the luciferase assay. (B) miR-17-3p, miR-31-5p, miR-200c-3p, and miR-497-3p reduced luciferase activity upon co-transfection with the human 3′ UTR APP plasmid in HEK293 cells. NMC, miR-17, and miR-200c, n = 4; miR-31 and miR-497, n = 2. (C and D) miR-31-5p was also able to reduce luciferase activity in HT-22 and HEK293 cells, upon co-transfection with the mouse 3′ UTR Bace1 and human CDS APP plasmids, respectively. (C) NMC and miR-31, n = 5; miR-497, n = 2; (D) NMC and miR-31, n = 3. (E) Schematic representation of lentiviral plasmid (pLenti) construction encoding the selected pri-miRNA sequences. (F) Validation of pLenti constructions was performed in HEK293 and HT-22 cells by evaluating the expression of the GFP reporter gene through fluorescence microscopy (original magnification, ×200) and (G–J) quantifying the mRNA levels of human APP and mouse Bace1 by qRT-PCR. (G) mRNA levels of human APP were significantly decreased in HEK293 cells upon transfection with all miRNA-pLenti vectors, while (H) mRNA levels of mouse Bace1 were significantly decreased in HEK293 cells upon transfection with the miR-31 pLenti construct. (G) pNC, pmiR-17, pmiR-31, and pmiR-200c, n = 3; pmiR-497, n = 2; (H) pNC, pmiR-31, and pmiR-497, n = 3. (I and J) The mRNA levels of human APP (I) and mouse Bace1 (J) were also significantly decreased in SH-SY5Y and HT-22 cells, respectively, upon infection with lentiviral particles encoding miR-31. Non-infected cells (Uninf.) and miR-31 lentivirus (LV miR-31), n = 3. Each n represents a temporarily independent experiment performed in duplicate. Data represent mean ± SEM. *p < 0.05, **p < 0.01, ****p < 0.0001 with respect to the control condition, that is, transfection with (B–D) control mimic (NCM), (G and H) pLenti control vector (pGFP), or (I and J) non-infected cells. (B, C, G, and H) Ordinary one-way ANOVA with Dunnett’s post hoc test. (D, I, and J) Two-tailed unpaired t test.
Figure 2
Figure 2
Decline in Memory and Cognitive Performance Is Arrested in Aged Mice after Bilateral miR-31 Expression in the Hippocampus (A) Thirteen-month-old 3xTg-AD female mice were stereotaxically injected in the hippocampus of both hemispheres with lentivirus encoding miR-31 or negative control lentivirus (NC). (B) Schematic representation of the experimental time course. Cognitive function was accessed through a battery of behavioral tests, before (12 months) and after (16 months) stereotaxic injection. (C) 16/17-month-old 3xTg-AD miR-31 mice showed a significant increase in the percentage of spontaneous alternation (T-maze test), compared to untreated or 3xTg-AD NC animals. NTg and 3xTg-AD miR-31, n = 7; 3xTg-AD, n = 9; 3xTg-AD NC, n = 6. (D) miR-31 3xTg-AD mice interacted more with the novel object recognition (NOR) with respect to untreated or NC 3xTg-AD animals and (E) revealed an exploratory behavior similar to that of NTg animals (NOR test). (D) NTg, n = 5; 3xTg-AD, 3xTg-AD NC, and 3xTg-AD miR-31, n = 4. (F–H) miR-31 3xTg-AD mice presented (F) a significant decrease in the time spent in the corners of the open field (OF) test (first 5 min) and (G) an increase in the time spent in the center of the OF arena, indicating a less anxious behavior. (F) NTg, n = 8; 3xTg-AD, n = 10; 3xTg-AD NC, n = 7; 3xTg-AD miR-31, n = 9. (G) NTg, n = 7; 3xTg-AD and 3xTg-AD miR-31, n = 8; 3xTg-AD NC, n = 6. (H) NTg and 3xTg-AD miR-31, n = 8; 3xTg-AD, n = 9; 3xTg-AD NC, n = 5. (I–N) miR-31 expression promoted an overall improvement in the long-term memory 3xTg-AD animals. Untreated and 3xTg-AD NC mice, but not 3xTg-AD miR-31 mice, showed (I) a decrease in latency to reach the goal box in the Barnes maze (BM) test, and (J) an increase in the first cumulative duration in the goal area. NTg and 3xTg-AD NC, n = 5; 3xTg-AD, n = 8; 3xTg-AD miR-31, n = 9. (K and L) miR-31 expression also led to an improvement of motor behavior of 3xTg-AD animals, increasing the (K) distance traveled and (L) velocity of miR-31 3xTg-AD mice during BM test. (K) NTg, n = 8; 3xTg-AD, n = 9; 3xTg-AD NC and 3xTg-AD miR-31. n = 7. (L) NTg and 3xTg-AD NC, n = 8; 3xTg-AD, n = 10; 3xTg-AD miR-31, n = 7. (M) miR-31 3xTg-AD animals presented an exploratory strategy similar to that of NTg mice (BM test), (N) performing a higher number of crossings in the arena center. NTg and 3xTg-AD NC, n = 6; 3xTg-AD, n = 8; 3xTg-AD miR-31, n = 9. Data represent mean ± SEM. *p < 0.05 or #p < 0.05, **p < 0.01 or ##p < 0.01, ***p < 0.001 or ###p < 0.001, and ****p < 0.0001 or ####p < 0.0001, with respect to NTg animals (*) or miR-31 3xTg (#). (C, F, G, I–L, and N) One-way ANOVA with Tukey’s post hoc test. (D) Two-way ANOVA with Tukey’s post hoc test. See also Figure S2.
Figure 3
Figure 3
miR-31 Expression Reduces Plaque Load and Intraneuronal Aβ in the Hippocampus and Cortex (A) Representative microscopy images (original magnification, ×100; scale bar, 200 μm) of Aβ deposition in 50-μm coronal brain slices of 17-month-old (17M) mice from all experimental groups. Aβ immunohistochemistry, using anti-human Aβ 6E10 antibody (see also Figure S3), revealed a reduction of Aβ plaque load (white arrows) and intraneuronal Aβ deposits (black arrows) in the subiculum and CA1 and CA2 hippocampal regions of miR-31 3xTg animals, with respect to 3xTg-AD and 3xTg-AD NC mice. This is quantified in (C)–(E). (B) Representative confocal images (original magnification, ×60; scale bar, 100 μm) of Aβ plaques labeled with methoxy-X04 in the subiculum of 17M 3xTg-AD animals from all experimental groups. miR-31 3xTg animals showed a reduction in the number and size of Aβ deposits, compared to 3xTg untreated or NC 3xTg mice. (C–E) Quantitative analysis of Aβ plaque load and intraneuronal Aβ deposition was performed by stereology. (C) Results revealed a significant reduction of Aβ plaque load/area unit in the subiculum of miR-31 mice, with respect to 3xTg-AD and 3xTg-AD NC animals. 3xTg-AD and 3xTg-AD miR-31, n = 7; 3xTg-AD NC, n = 4. (D) Furthermore, we also observed a reduction in Aβ plaque load/area unit in the hippocampus of miR-31 mice. 3xTg-AD and 3xTg-AD miR-31, n = 9; 3xTg-AD NC, n = 6. (E) Stereological quantification of intraneuronal Aβ deposition/area unit revealed a significant reduction along the different hippocampal subregions, in the subiculum and in the cortex of miR-31 3xTg-AD animals, compared with 3xTg-AD. CA1+CA2: 3xTg-AD and 3xTg-AD miR-31, n = 9; 3xTg-AD NC, n = 5. CA3: 3xTg-AD, n = 9; 3xTg-AD NC, n = 5; 3xTg-AD miR-31, n = 8. Subiculum: 3xTg-AD, n = 9; 3xTg-AD NC, n = 4; 3xTg-AD miR-31, n = 8. Cortex: 3xTg-AD, n = 9; 3xTg-AD NC, n = 5; 3xTg-AD miR-31, n = 8. Data represent mean ± SEM. #p < 0.05, **p < 0.01, ***p < 0.001 with respect to untreated 3xTg-AD animals (*) or NC 3xTg-AD animals (#). (C–E) One-way ANOVA with Tukey’s post hoc test.
Figure 4
Figure 4
miR-31 Expression Reduces the Number and Intensity of VGLUT1 Puncta in the CA1 Hippocampal Subregion VGLUT1- and VGAT-positive puncta where labeled by immunohistochemistry in brain slices of 17-months-old (17M) 3xTg-AD and NTg animals in order to quantify the intensity, size, and density of VGLUT1- and VGAT-positive synaptic vesicles in the hippocampus. (A) The intensity of VGLUT1 puncta was significantly decreased in the CA1 subregion of both NTg and miR-31 3xTg-AD mice, with respect to untreated 3xTg-AD animals (threshold of 0–15) and NC 3xTg-AD animals (threshold of 0–9). NTg, n = 3; 3xTg-AD and 3xTg-AD miR-31, n = 4; 3xTg-AD NC, n = 5. (B) No significant differences were observed between the experimental groups regarding the intensity of VGAT puncta. NTg, n = 3; 3xTg-AD, 3xTg-AD NC, and 3xTg-AD miR-31, n = 4. (C and D) Panels show representative confocal images of (C) VGLUT1 and (D) VGAT puncta in the CA1 subregion (original magnification, ×630 plus ×5 digital zoom; scale bars, 4 μm). (E–H) Quantitative analysis of the density and average puncta size of VGLUT1 and VGAT puncta in the CA1 subregion. (E) Results showed a higher density of VGLUT1 puncta in 3xTg-AD mice with respect to NTg. NTg, n = 3; 3xTg-AD and 3xTg-AD miR-31, n = 4; 3xTg-AD NC, n = 5. No significant differences were observed regarding (F) VGLUT1 average puncta size, and VGAT (G) puncta density and (H) average puncta size. (F) NTg, n = 3; 3xTg-AD and 3xTg-AD miR-31, n = 4; 3xTg-AD NC, n = 5. (G and H) NTg, n = 3; 3xTg-AD, 3xTg-AD NC, and 3xTg-AD miR-31, n = 4; Data represent mean ± SEM. *p < 0.05 or #p < 0.05, **p < 0.01 or ##p < 0.01, and ***p < 0.001 or ###p < 0.001 with respect to untreated 3xTg animals (*) or NC 3xTg animals (#). (A and B) two-way ANOVA with Bonferroni’s post hoc test. (E–H) One-way ANOVA with Tukey’s post hoc test. See also Figure S5.
Figure 5
Figure 5
miR-31 Expression Reduces the Levels of Both APP and Bace1 in 3xTg-AD Mice mRNA and protein extracts were prepared from hippocampal samples of 17-month-old 3xTg-AD and NTg mice. (A) qRT-PCR analysis revealed a significant increase in miR-31 expression in the hippocampus of miR-31 3xTg-AD animals, with respect to untreated and NC 3xTg-AD mice. NTg, n = 3; 3xTg-AD and 3xTg-AD miR-31, n = 7; 3xTg-AD NC, n = 5. (B) The levels of mouse BACE1 mRNA were found to be significantly decreased in miR-31 3xTg-AD animals, with respect to untreated 3xTg-AD mice. NTg, n = 6; 3xTg-AD, n = 7; 3xTg-AD NC, n = 4; 3xTg-AD miR-31, n = 8. (C) A similar decrease in BACE1 protein levels was detected by ELISA in the hippocampus of miR-31 3xTg-AD animals, with respect to untreated 3xTg-AD mice. NTg, n = 3; 3xTg-AD, n = 9; 3xTg-AD NC, n = 4; 3xTg-AD miR-31, n = 8. (D and E) The levels of mouse BACE1 protein were also analyzed by western blot in all experimental groups and were shown to be increased only in untreated 3xTg-AD animals. (D) Quantification revealed a significant decrease in BACE1 protein levels in 3xTg-AD miR-31 animals with respect to untreated 3xTg-AD mice. NTg, n = 6; 3xTg-AD, n = 7; 3xTg-AD NC, n = 5; 3xTg-AD miR-31, n = 7. (F) mRNA levels of human APP were lower in the hippocampus of miR-31 mice, with respect to untreated and NC 3xTg-AD groups. 3xTg-AD, n = 9; 3xTg-AD, NC n = 5; 3xTg-AD miR-31, n = 7. Western blot analysis (G and H) confirmed these results and revealed a significant decrease in human APP protein levels in the hippocampus of miR-31 3xTg-AD animals, compared to untreated and NC 3xTg-AD mice. 3xTg-AD, n = 9; 3xTg-AD NC, n = 4; 3xTg-AD miR-31, n = 7. (I) Mouse APP mRNA expression levels were not significantly different among the 3xTg-AD experimental groups, showing that our strategy is specific for human APP. 3xTg-AD, n = 9; 3xTg-AD NC, n = 5; 3xTg-AD miR-31, n = 8. Data represent mean ± SEM. *p < 0.05 or #p < 0.05 and **p < 0.01 with respect to untreated 3xTg animals (*) or NC 3xTg animals (#). (A–I) One-way ANOVA with Tukey’s post hoc test.
Figure 6
Figure 6
miR-31 Does Not Decrease the Expression of Other Predicted Targets (A) Representative illustration of 50 miR-31 predicted targets, selected by crossing information from miRNA target prediction online databases with information regarding the specific transcriptome of the different cellular subsets of the mouse brain (brain RNA sequencing database: https://web.stanford.edu/group/barres_lab/brain_rnaseq.html). Targets are organized clockwise in a color gradient, according to miR-31 binding score (miRWalk). A group of five genes predicted by three or more databases (miRANDA-miRSVR, TargetScan, Diana microT-CDS, and miRWalk), presenting FPKM values similar to or higher than those of mouse APP (200) or BACE1 (20) and higher predicted binding scores (miRWalk), were selected for further quantification by qRT-PCR. (B) mRNA levels of Atxn7L3b, Dpysl4, Dpysl5, Rab3a, and Dusp1 were quantified in hippocampal RNA extracts of all experimental groups. A significant increase in mouse Dpysl5 and Rab3a mRNA levels was observed in miR-31 3xTg animals with respect to untreated 3xTg mice. Data represent mean ± SEM. ∗p < 0.05 with respect to untreated 3xTg animals. Atxn7L3b: NTg and 3xTg-AD miR-31, n = 7; 3xTg-AD, n = 9; 3xTg-AD NC, n = 5. Dpysl4: NTg and 3xTg-AD miR-31, n = 8; 3xTg-AD, n = 9; 3xTg-AD NC, n = 5. Dpy5sl5: NTg and 3xTg-AD miR-31, n = 8; 3xTg-AD, n = 9; 3xTg-AD NC, n = 4. Rab3a: NTg, n = 7; 3xTg-AD, n = 9; 3xTg-AD NC, n = 4; 3xTg-AD miR-31, n = 8. Dusp1: NTg, n = 7; 3xTg-AD, n = 9; 3xTg-AD NC, n = 5; 3xTg-AD miR-31, n = 8. Western blot analysis of DpysL5 (C and D) and Rab3a (E and F) did not revealed any significant decrease in the levels of both proteins in the hippocampus of miR-31 3xTg-AD animals, compared to untreated and NC 3xTg-AD mice, showing that miR-31 expression is specifically impacting APP and Bace1 levels and not other miR-31 predicted targets. 3xTg-AD, n = 9; 3xTg-AD NC, n = 4; 3xTg-AD miR-31, n = 7. Data represent mean ± SEM. ∗p < 0.05 with respect to untreated 3xTg animals (∗) (B) One-way ANOVA with Dunnett’s post hoc test, (D and F) One-way ANOVA with Tukey's post hoc test.

References

    1. Goldman J.S., Hahn S.E., Catania J.W., LaRusse-Eckert S., Butson M.B., Rumbaugh M., Strecker M.N., Roberts J.S., Burke W., Mayeux R., Bird T., American College of Medical Genetics and the National Society of Genetic Counselors Genetic counseling and testing for Alzheimer disease: joint practice guidelines of the American College of Medical Genetics and the National Society of Genetic Counselors. Genet. Med. 2011;13:597–605. - PMC - PubMed
    1. Hardy J.A., Higgins G.A. Alzheimer’s disease: the amyloid cascade hypothesis. Science. 1992;256:184–185. - PubMed
    1. Karran E., Mercken M., De Strooper B. The amyloid cascade hypothesis for Alzheimer’s disease: an appraisal for the development of therapeutics. Nat. Rev. Drug Discov. 2011;10:698–712. - PubMed
    1. Stancu I.C., Vasconcelos B., Terwel D., Dewachter I. Models of β-amyloid induced Tau-pathology: the long and “folded” road to understand the mechanism. Mol. Neurodegener. 2014;9:51. - PMC - PubMed
    1. Kim W.S., Kågedal K., Halliday G.M. Alpha-synuclein biology in Lewy body diseases. Alzheimers Res. Ther. 2014;6:73. - PMC - PubMed