. 2020 Feb 13;21(4):1264.
doi: 10.3390/ijms21041264.

Distinct and Overlapping Expression Patterns of the Homer Family of Scaffolding Proteins and Their Encoding Genes in Developing Murine Cephalic Tissues

Affiliations

Distinct and Overlapping Expression Patterns of the Homer Family of Scaffolding Proteins and Their Encoding Genes in Developing Murine Cephalic Tissues

Claes-Göran Reibring et al. Int J Mol Sci. .

Abstract

In mammals Homer1, Homer2 and Homer3 constitute a family of scaffolding proteins with key roles in Ca2+ signaling and Ca2+ transport. In rodents, Homer proteins and mRNAs have been shown to be expressed in various postnatal tissues and to be enriched in brain. However, whether the Homers are expressed in developing tissues is hitherto largely unknown. In this work, we used immunohistochemistry and in situ hybridization to analyze the expression patterns of Homer1, Homer2 and Homer3 in developing cephalic structures. Our study revealed that the three Homer proteins and their encoding genes are expressed in a wide range of developing tissues and organs, including the brain, tooth, eye, cochlea, salivary glands, olfactory and respiratory mucosae, bone and taste buds. We show that although overall the three Homers exhibit overlapping distribution patterns, the proteins localize at distinct subcellular domains in several cell types, that in both undifferentiated and differentiated cells Homer proteins are concentrated in puncta and that the vascular endothelium is enriched with Homer3 mRNA and protein. Our findings suggest that Homer proteins may have differential and overlapping functions and are expected to be of value for future research aiming at deciphering the roles of Homer proteins during embryonic development.

Keywords: ameloblasts; choroid plexus; cochlea; endothelium; hippocampal formation; hypothalamus; odontoblasts; olfactory epithelium; salivary glands; taste buds.


Conflict of interest statement

The authors declare no conflict of interest.

Figures
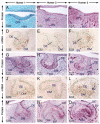
Figure 1
Figure 1
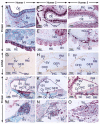
Expression patterns of Homer1, Homer2 and Homer3 during early stages of tooth formation. (AC) Representative immunostaining of frontal sections across the first molars at embryonic day 12.5 (E12.5) showing the distribution of Homer1 (A), Homer2 (B) and Homer3 (C) proteins (purple). All three Homer proteins are expressed in the dental placode (epithelium) and Homer1 protein is concentrated in puncta. The jaw mesenchyme, including the mesenchyme adjacent to the dental placode, expresses Homer2 and Homer3 proteins and the vascular endothelium shows weak Homer1, moderate Homer2 and strong Homer3 immunostaining. (DO) Representative in situ hybridization (DF,JL) and immunohistochemistry (GI,MO) data in frontal (DF,JO) and parasagittal (GI) sections across the first molars at E13.5 (DI; bud stage) and E14.5 (JO; cap stage) showing expression of Homer1, Homer2 and Homer3 transcripts (brown) and Homer1, Homer2 and Homer3 proteins (purple) in the dental epithelium and dental mesenchyme. Cells of the dental epithelium exhibit diffuse Homer immunostaining of the cytoplasm and membranes as well as puncta enriched with Homer proteins. The vascular endothelium is enriched with Homer3 protein and mRNA and exhibits weak Homer1 and moderate Homer2 immunostaining. The dotted line in (DF) and (JL) highlights the junction between the dental epithelium and the dental mesenchyme. BV, blood vessels; DE, dental epithelium; DPl, dental placode; DM, dental mesenchyme. Scale bars: 50 µm (AO).
Figure 2
Figure 2
Expression patterns of Homer1, Homer2 and Homer3 during the bell stage of tooth development. (AF) Representative frontal (A) and parasagittal (BF) sections across developing first molars at 1 day postpartum (1 dpp) after in situ hybridization (AC) and immunohistochemistry (DF) for Homer1 (A,D), Homer2 (B,E) and Homer3 (C,F). (A’F’) are magnified views of the boxed areas in (AF). Odontoblasts and differentiating ameloblasts are enriched with Homer proteins (purple) and mRNAs (brown) as compared to the dental papilla, stellate reticulum and inner dental epithelium. Homer2 protein and mRNA are also expressed in the stratum intermedium. Homer proteins are concentrated in intracellular puncta in odontoblasts and differentiating ameloblasts as well as in cells of the stratum intermedium and inner dental epithelium. The endothelium of blood vessels in the stellate reticulum and dental mesenchyme is enriched with Homer3 mRNA and protein and exhibits weak and moderate immunostaining for Homer1 and Homer2, respectively. Homer proteins are also detectable in osteoblasts within the developing alveolar bone (DF). BV, blood vessels; dAM, differentiating ameloblasts; DP, dental papilla; IDE, inner dental epithelium; Ob, osteoblasts; Od, odontoblasts; pOd, preodontoblasts; SI, stratum intermedium; SR, stellate reticulum. Scale bars: 200 µm (AF) and 100 µm (A’F’).
Figure 3
Figure 3
Expression patterns of Homer1, Homer2 and Homer3 during advanced stages of tooth formation. (AR) Representative in situ hybridization (AC,GI) and immunohistochemistry (DF,JR) data showing the distribution patterns of Homer1 (A,G), Homer2 (B,H) and Homer3 (C,I) transcripts (brown) and Homer1 (D,J,M,P), Homer2 (E,K,N,Q) and Homer3 (F,L,O,R) proteins (purple) in developing teeth at 12 days postpartum (12 dpp). (AF) Sections across incisors at the level of the secretory stage of enamel formation. Secretory ameloblasts and young odontoblasts (cells facing a thin layer of predentin/dentin matrices) express the three Homer proteins and their encoding genes. The asterisks in (D,F) mark an artefactual space due to detachment of secretory ameloblasts from dentin. (GL) Sections at the level of enamel maturation showing expression of the three Homer proteins and their encoding genes in maturation-stage ameloblasts and in the papillary layer. (MR) Sections across molars showing expression of Homer proteins in mature odontoblasts (cells that have produced a thick layer of predentin/dentin) (MO) and in Hertwig’s epithelial root sheath (PR). Secretory ameloblasts, maturation-stage ameloblasts, odontoblasts and cells of the papillary layer exhibit puncta enriched with Homer proteins (DF,JO). Note that the Homer-positive(+) puncta in young odontoblasts (DF) are less prominent than the Homer+ puncta in mature odontoblasts (MO) and that the Homer3+ puncta in subsets of cells of the dental pulp are apparently smaller than the Homer3+ puncta in mature odontoblasts (O). Odontoblasts in the developing roots express Homer proteins (PR). The endothelium of vascular loops penetrating the papillary layer (I,L) and of blood vessels in the dental pulp and dental sac mesenchyme (C,F,I,L,O,R) expresses Homer3 mRNA and protein and exhibits weak Homer1 (D,J,M,P) and moderate Homer2 (E,K,N,Q) immunostaining. BV, blood vessels; DS, dental sac; HS, Hertwig’s epithelial root sheath; MA, maturation-stage ameloblasts; Od, odontoblasts; P, dental pulp; PD/D, predentin/dentin matrices; PL, papillary layer; SA, secretory ameloblasts; SI, stratum intermedium. Scale bars: 50 µm (AR).
Figure 4
Figure 4
Expression patterns of Homer1, Homer2 and Homer3 in the developing forebrain and trigeminal ganglion. (AI) Representative sections across the forebrain and trigeminal ganglion at embryonic day 14.5 (E14.5) after in situ hybridization revealing Homer transcripts (AC) and immunostaining (DI) for Homer proteins. Homer transcripts (brown) and Homer proteins (purple) are expressed in the trigeminal ganglion and in different regions of the forebrain, including the striatum, neocortex, thalamus, hypothalamus and in the hippocampal formation, and Homer proteins are enriched in differentiating fields and in the apical surface of the ventricular layer. (G’I’) are magnified views of boxed areas in (GI) showing that Homer1, Homer2 and Homer3 proteins are enriched in the apical surface of cells of the choroid plexus and that in these cells Homer1 and Homer3 are also concentrated in puncta. (G’’I’’) are magnified views of boxed areas in (GI) showing the distribution of Homer proteins in the anterior hypothalamic area and concentration of Homer1 and Homer2 in intracellular puncta. The three Homer proteins are also detectable in the apical surface of the hypothalamic neuroepithelium (G’’H’’). (G’’’I’’’) are magnified views of boxed areas in (GI), showing that in other brain regions, the intracellular Homer-positive(+) puncta are less conspicuous than the Homer+ puncta in the anterior hypothalamic area. The endothelial lining of blood vessels in the brain and meninges expresses Homer3 transcripts and proteins (C,F,II’’’) and exhibits weak Homer1 (D,GG’’’) and moderate Homer2 immunostaining (E,HH’’’). BV, blood vessels; Ch, choroid plexus; Cx, neocortex; Hc, hippocampal formation; Ht, hypothalamus; Hn, hypothalamic neuroepithelium; Lv, lateral ventricle; St, striatum; Th, thalamus; Vg, trigeminal ganglion; V3, third ventricle. Scale bars: 500 µm (AI) and 50 µm (G’I’’’).
Figure 5
Figure 5
Expression patterns of Homer1, Homer2 and Homer3 in neuronal and non-neuronal cephalic tissues. (AI) Representative sections across cephalic tissues at embryonic day 14.5 (E14.5) after in situ hybridization (AC) and immunohistochemistry (DI). (A’C’) and (D’F’) are magnified views of the boxed areas in (AC) and (DF), respectively. (AF’) The Homer1, Homer2 and Homer3 mRNA expression patterns (brown) are consistent with the distribution patterns of their protein products (purple) in several cephalic structures, including the olfactory bulbs, retina, lens epithelium, olfactory epithelium, submandibular salivary glands, tooth, rugae palatinae, skeletal muscle and medial epithelial seam of the secondary palate. Note that Homer2 mRNA is enriched in developing muscles of the tongue (arrowheads in B’). The olfactory epithelium displays strong Homer2 (B,E) but moderate Homer1 (A,D) and Homer3 (C,F) hybridization signals and immunolabelling. The olfactory and trigeminal nerves show moderate Homer1 (D,D’) and strong Homer2 (E,E’) immunostaining. Homer3 immunoreactivity is strong in olfactory nerves and moderate in trigeminal nerves (F,F’). (GI) Homer1, Homer2 and Homer3 proteins are enriched in intracellular puncta in the epithelium of developing submandibular glands and the three Homer proteins are detectable in nerves within the glandular stroma. Note that vascular endothelium in cephalic tissues expresses Homer3 mRNA and protein and exhibits weak Homer1 and moderate Homer2 immunostaining. (JL) Representative sections across submandibular salivary glands at 1 day postpartum (1 dpp) after immunostaining for Homer1 (J), Homer2 (K) and Homer3 (L). (J’L’) are magnified views of the boxed areas in (JK). In epithelial cells (acinar and tubular cells) of the glands Homer proteins show overlapping and distinct subcellular distribution patterns. Homer1 is enriched in the apical surface/membranes and in numerous intracellular puncta (J,J’); Homer2 is concentrated in the apical surface/membranes and is also detectable in the cytoplasm (K,K’); and Homer3 is detectable in the cytoplasm, cell membranes and puncta (L,L’). The Homer2-positive(+) and Homer3+ puncta are less conspicuous than the Homer1+ puncta in glandular epithelial cells (JL’) and the Homer+ puncta in 1 dpp glands (JK) are relatively smaller than the Homer+ puncta in E14.5 glands (GI). BV, blood vessels; L, lens epithelium; MES, medial epithelial seam; Nf, nerve fibers (in salivary glands); n5, trigeminal nerve; OB, olfactory bulb; OE, olfactory epithelium; ON, olfactory nerve; R, retina; RP, rugae palatinae; SG, submandibular salivary glands; SM, skeletal muscle (masseter); T, tongue; To, tooth. Scale bars: 1mm (AF), 200 µm (A’F’), 50 µm (GL) and 10 µm (J’L’).
Figure 6
Figure 6
Expression patterns of Homer1, Homer2 and Homer3 in the olfactory and respiratory mucosae and in the cochlea. (AO) Representative immunohistochemistry (AF,JO) and in situ hybridization (GI) data in sections across the nasal cavity (AF) and cochlea (GO) at 1 day postpartum (1 dpp) showing the distribution patterns of Homer proteins (purple) and their encoding genes (brown). (AC) Homer1 (A), Homer2 (B) and Homer3 (C) proteins are enriched in the apical surface (likely cilia of olfactory neurons and microvilli of supporting cells) of cells of the olfactory epithelium and are also detectable in intracellular puncta. Dendrites (arrowheads in AC) and axons, the latter forming the olfactory nerves, are Homer1-positive(+), Homer2+ and Homer3+, indicating that some of the Homer+ cells in the olfactory epithelium are olfactory neurons. (DF) The respiratory epithelium and nasal glands express Homer1 (D), Homer2 (E) and Homer3 (F) proteins. In cells of the respiratory epithelium the Homer1+ puncta are more prominent than the Homer2+ and Homer3+ puncta. In nasal gland acinar cells Homer1 is enriched in the apical membrane and in puncta, Homer2 is readily detectable in cell membranes and in the cytoplasm and Homer3+ puncta are detectable in subsets of acinar cells. Note that the Homer1+ puncta in nasal gland acinar cells are small compared to the Homer1+ puncta in cells of the respiratory epithelium (D). The endothelial lining of blood vessels in the olfactory (AC) and respiratory (DF) mucosae shows weak Homer1, moderate Homer2 and strong Homer3 immunolabelling. (GO) Expression patterns of Homer transcripts (GI) and their protein products (JO) in the cochlea. Homer1 (G), Homer2 (H) and Homer3 (I) mRNAs are detectable in various cells of the developing organ of Corti, including inner (IHC) and outer (OHC) hair cells as well as in cells forming the stria vascularis, basilar membrane and Reissner’s membrane (GI). Homer1 and Homer2 transcripts are enriched in IHC and OHC (G,H). Homer1 (J), Homer2 (K) and Homer3 (L) proteins show overlapping but also distinct subcellular localization in cells of the organ of Corti. In IHC and OHC Homer1 and Homer2 are enriched in the apical surface (likely in stereocilia) and in perinuclear puncta and are also detectable in the cytoplasm. By contrast, Homer3 protein is detectable in puncta at the apical surface of IHC and OHC and in perinuclear puncta in IHC. Other cells of the organ of Corti, including cells of the greater epithelial ridge (GER), cells of Claudius and Deiter’s cells, exhibit Homer1+ and Homer3+ perinuclear puncta and show moderate Homer1, very weak Homer2 and weak Homer3 immunostaining in the cytoplasm. Homer1 is also enriched in the apical (endolymphatic) surface of the GER. Cells of the stria vascularis and Reissner’s membrane exhibit Homer1+ and Homer3+ puncta and cytoplasmic Homer2 immunostaining. Note that in IHC and OHC the Homer1+ puncta are large as compared to the Homer2+ and Homer3+ puncta and that the Homer1+ puncta in IHC and OHC are large compared to the Homer1+ puncta in the cells of Claudius and in cells of the GER and stria vascularis. (MO) Neurons of the cochlear spiral ganglion show diffuse cytoplasmic immunostaining for Homer1 (M), Homer2 (N) and Homer3 (O) and are enriched with Homer1+ and Homer3+ puncta. Note that the vascular endothelium in the cochlea exhibits weak Homer1, moderate Homer2 and strong Homer3 immunolabelling (JO). BM, basilar membrane; BV, blood vessels; Cc, cells of Claudius; Dc, Deiter’s cells; GER, greater epithelial ridge; IHC, inner hair cells; NG, nasal glands; OE, olfactory epithelium; ON, olfactory nerve; RE, respiratory epithelium; RM, Reissner’s membrane; Sg, spiral ganglion; SV, stria vascularis. Scale bars: 100 µm (AC) and 50 µm (DO).
Figure 7
Figure 7
Expression patterns of Homer1, Homer2 and Homer3 in the tongue and alveolar bone. (AO) Representative in situ hybridization (AC,GI) and immunohistochemistry (DF,JO) data showing the distribution patterns of Homer transcripts (brown) and Homer proteins (purple). (AF) Sections across the developing tongue at embryonic day 14.5 (E14.5). Homer1 mRNA (A) and Homer1 protein (D) are enriched in developing taste buds and are detectable in the lingual epithelium (LE), developing muscles of the tongue (arrows) and in the lingual mesenchyme (LM). Homer2 mRNA (B) and Homer2 protein (E) are expressed in the LE, including in developing taste buds and are enriched in developing muscle of the tongue (arrows). Homer2 protein is also detectable in nerves innervating developing fungiform papillae (arrowhead in E). Homer3 mRNA (C) and Homer3 protein (F) are expressed in the LE, LM and in the vascular endothelium, whereas developing taste buds are virtually devoid of Homer3 immunostaining. (GL) Sections across the tongue at 1 day postpartum (1 dpp). Homer1 mRNA (G) and Homer1 protein (J) are enriched in nerves innervating fungiform papillae (arrowheads in G,J) and in taste buds. The LE and taste buds express Homer2 mRNA (H) and Homer2 protein (K) and exhibit weak hybridization signals (I) and immunostaining (L) for Homer3. By contrast, Homer3 transcripts and Homer3 protein are readily detectable in the vascular endothelium. (MO) sections across the alveolar bone at 12 dpp. Homer1 (M), Homer2 (N) and Homer3 (O) proteins are expressed in osteoblasts (arrows in M,N,O) and osteoclasts and Homer2 and Homer3 but not Homer1, are also detectable in osteocytes (arrowheads in M,N,O). Note that in bone cells Homer proteins are enriched in puncta. BV, blood vessels; LE, lingual epithelium; LM, lingual mesenchyme; OC, osteoclast; TB, taste bud; SM, muscles of the tongue. Scale bars: 50 µm (AO).

Similar articles

Cited by

References

    1. Brakeman P.R., Lanahan A.A., O’Brien R., Roche K., Barnes C.A., Huganir R.L., Worley P.F. Homer: A protein that selectively binds metabotropic glutamate receptors. Nature. 1997;386:284–288. doi: 10.1038/386284a0. - DOI - PubMed
    1. Kato A., Ozawa F., Saito Y., Hirai K., Inokuchi K. Vesl, a gene encoding VASP/Ena family related protein, is upregulated during seizure, long-term potentiation and synaptogenesis. Febs. Lett. 1997;412:183–189. doi: 10.1016/S0014-5793(97)00775-8. - DOI - PubMed
    1. Xiao B., Tu J.C., Petralia R.S., Yuan J.P., Doan A., Breder C.D., Ruggiero A., Lanahan A.A., Wenthold R.J., Worley P.F. Homer regulates the association of group I metabotropic glutamate receptors with multivalent complexes of homer-related, synaptic proteins. Neuron. 1998;21:707–716. doi: 10.1016/S0896-6273(00)80588-7. - DOI - PubMed
    1. Sun J., Tadokoro S., Imanaka T., Murakami S.D., Nakamura M., Kashiwada K., Ko J., Nishida W., Sobue K. Isolation of PSD-Zip45, a novel Homer/vesl family protein containing leucine zipper motifs, from rat brain. Febs. Lett. 1998;437:304–308. doi: 10.1016/S0014-5793(98)01256-3. - DOI - PubMed
    1. Shiraishi Y., Mizutani A., Bito H., Fujisawa K., Narumiya S., Mikoshiba K., Furuichi T. Cupidin, an isoform of Homer/Vesl, interacts with actin cytoskeleton and activates Rho family of small GTPases and is expressed in developing mouse cerebellar granule cells. J. Neurosci. 1999;19:8389–8400. doi: 10.1523/JNEUROSCI.19-19-08389.1999. - DOI - PMC - PubMed