. 2020 Feb 18;11(1):66.
doi: 10.1186/s13287-020-01597-8.

Prospective isolation of chondroprogenitors from human iPSCs based on cell surface markers identified using a CRISPR-Cas9-generated reporter

Affiliations

Prospective isolation of chondroprogenitors from human iPSCs based on cell surface markers identified using a CRISPR-Cas9-generated reporter

Amanda Dicks et al. Stem Cell Res Ther. .

Abstract

Background: Articular cartilage shows little or no capacity for intrinsic repair, generating a critical need of regenerative therapies for joint injuries and diseases such as osteoarthritis. Human-induced pluripotent stem cells (hiPSCs) offer a promising cell source for cartilage tissue engineering and in vitro human disease modeling; however, off-target differentiation remains a challenge during hiPSC chondrogenesis. Therefore, the objective of this study was to identify cell surface markers that define the true chondroprogenitor population and use these markers to purify iPSCs as a means of improving the homogeneity and efficiency of hiPSC chondrogenic differentiation.

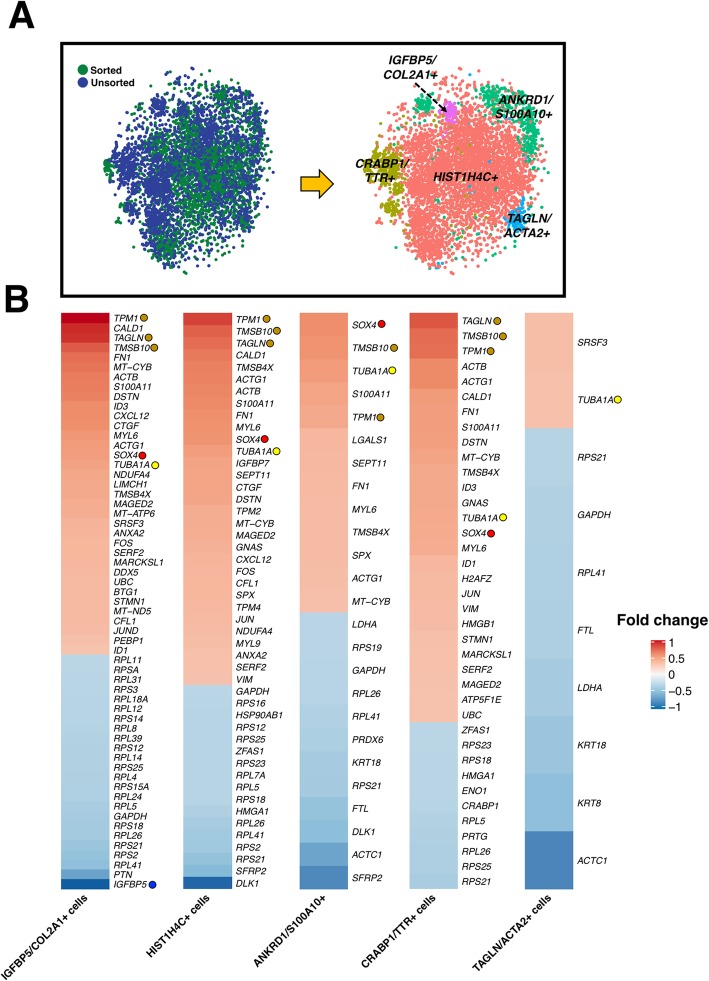
Methods: We used a CRISPR-Cas9-edited COL2A1-GFP knock-in reporter hiPSC line, coupled with a surface marker screen, to identify a novel chondroprogenitor population. Single-cell RNA sequencing was then used to analyze the distinct clusters within the population. An unpaired t test with Welch's correction or an unpaired Kolmogorov-Smirnov test was performed with significance reported at a 95% confidence interval.

Results: Chondroprogenitors expressing CD146, CD166, and PDGFRβ, but not CD45, made up an average of 16.8% of the total population. Under chondrogenic culture conditions, these triple-positive chondroprogenitor cells demonstrated decreased heterogeneity as measured by single-cell RNA sequencing with fewer clusters (9 clusters in unsorted vs. 6 in sorted populations) closer together. Additionally, there was more robust and homogenous matrix production (unsorted: 1.5 ng/ng vs. sorted: 19.9 ng/ng sGAG/DNA; p < 0.001) with significantly higher chondrogenic gene expression (i.e., SOX9, COL2A1, ACAN; p < 0.05).

Conclusions: Overall, this study has identified a unique hiPSC-derived subpopulation of chondroprogenitors that are CD146+/CD166+/PDGFRβ+/CD45- and exhibit high chondrogenic potential, providing a purified cell source for cartilage tissue engineering or disease modeling studies.

Keywords: Cartilage; Chondrocyte; Chondroprogenitor; Differentiation; Single-cell RNA sequencing; Surface markers; hiPSC.


Conflict of interest statement

Dr. Guilak is an employee of Cytex Therapeutics, Inc. The other authors declare that they have no competing interests.

Figures

Fig. 1
Fig. 1
Surface marker analysis and sorting strategy to identify progenitors with robust chondrogenic potential from heterogenous chondroprogenitor (CP) cells. a Flow cytometry showed approximately 4.27% of cells expressed COL2A1-GFP. b, c Chondroprogenitors were labeled for various surface markers and analyzed for co-expression with COL2A1-GFP. b Most COL2A1-GFP+ cells did not express CD271, CD105, CD73, and BMPR1β. c PDGFRβ, CD146, and CD166 were co-expressed with COL2A1-GFP. d A schematic representing the experimental design. The RVR cell line with the COL2A1-GFP reporter was differentiated into chondroprogenitor cells. Surface marker analysis indicated that PDGFRβ, CD146, and CD166 expression were highly co-expressed with COL2A1 but not CD45. e Cells expressing these desired markers were sorted from wildtype BJFF chondroprogenitor cells. To evaluate the chondrogenic potential of the sorted cells, pellets from the sorted cells were either made immediately post-sorting or formed after in vitro expansion. f A higher percentage of the total cell population (~ 16.8%) was triple positive for the desired markers compared to the population not expressing any of these markers. *p < 0.05. Data represented as mean ± SEM. n = 7–8 independent experiments. See also Figure S1
Fig. 2
Fig. 2
Cell populations and GO enrichment analysis of unsorted chondroprogenitor cells. a scRNA-seq identified unsorted chondroprogenitor cells contained at least 9 populations, which could be further categorized into 3 broad classes: neurogenic cells (blue dashed circle), chondrogenic cells (green dashed circle), and mesenchyme (brown dashed circle). b Expression of signature genes of each cell lineage. c GO terms analysis (biological process) of each unique population. d Percentage of total unsorted chondroprogenitor cells in each unique cell population. More than 20% of the unsorted chondroprogenitors were SOX2/TTR/NES+ neurogenic cells, while only small number of unsorted cells expressed SOX9 and COL2A1. See also Figure S1
Fig. 3
Fig. 3
Cell populations and GO enrichment analysis of sorted chondroprogenitor cells. a scRNA-seq identified PDGFRβ+/CD146+/CD166+ cells contained at least 6 populations. b Expression of signature genes of each cell lineage. The sorted cells were enriched for mesenchymal and chondrogenic genes. c Percentage of total sorted chondroprogenitor cells in each unique cell population. Twenty-seven percent of the sorted were SOX9/COL2A1. Interestingly, a small percentage of cells (4% of total sorted cells) expressing SOX2 and NES was still observed. d PDGFRβ+/CD146+/CD166+ sorted cells may belong to the mesenchymal population (brown dashed circle) in unsorted cells. The green dashed circle indicates the population that was positive for SOX9 and COL2A1.e GO terms analysis (biological process) showing skeletal system development was highlighted in SOX9/COL2A1+ cells, while HMGB2/TOP2A+ and LGALS1/PTTG1+ cells were enriched in gene sets of cell division. See also Figure S1
Fig. 4
Fig. 4
CCA for integrated analysis of sorted and unsorted scRNA-seq datasets. a Five major conserved populations were identified after CCA alignment of the sorted and unsorted chondroprogenitor cells. b DEG analysis indicated that sorted cells exhibited significantly upregulated expression of several mesenchymal genes including TPM1, TAGLN, and TMSB10 (brown circle), which have been suggested to be essential in chondrogenesis. Proliferative markers including SOX4 (red circle) and TUBA1A (yellow circle) were increased, but IGFBP5 (blue circle) and several ribosomal genes were decreased in sorted cells
Fig. 5
Fig. 5
Histology and IHC for matrix proteins in RVR-COL2 and BJFF pellets. a Safranin-O staining for sGAG showing pellets derived from sorted chondroprogenitor cells had more robust staining and homogenous cell morphology compared to pellets derived from unsorted cells in both lines. b Labeling of COL2A1 showed similar results with an increase in COL2A1 in sorted pellets as opposed to unsorted which has isolated areas of staining. c There was little labeling of COL1A1 for both unsorted and sorted cell pellets. d Labeling for COL10A1 was increased with sorting. Scale bar = 200 μm. Inset scale bar = 400 μm. See also Figure S4 and S5
Fig. 6
Fig. 6
Quantitative analysis of matrix production and gene expression. a Sorting of chondroprogenitor cells prior to chondrogenesis significantly increased the sGAG/DNA ratio to approximately 20 ng/ng. bd Expression of chondrogenic genes ACAN, SOX9, and COL2A1 was significantly increased with sorting. e, f Sorting significantly unregulated fibrocartilage and bone matrix marker COL1A1, and hypertrophic cartilage marker COL10A1. Gene expression in reference to undifferentiated hiPSCs with housekeeping gene TBP. *p < 0.05, **p < 0.01, ***p < 0.001, and ****p < 0.0001. Data represented as mean ± SEM. n = 6–7 per group: 2 experimental replicates, 3–4 technical replicates (pellets). See also Figure S6

References

    1. Mow Van C., Ateshian Gerard A., Spilker Robert L. Biomechanics of Diarthrodial Joints: A Review of Twenty Years of Progress. Journal of Biomechanical Engineering. 1993;115(4B):460–467. doi: 10.1115/1.2895525. - DOI - PubMed
    1. Guilak F. Biomechanical factors in osteoarthritis. Best Pract Res Clin Rheumatol. 2011;25:815–823. doi: 10.1016/j.berh.2011.11.013. - DOI - PMC - PubMed
    1. Lin Z, Willers C, Xu J, et al. The chondrocyte: biology and clinical application. Tissue Eng. 2006;12:1971–1984. doi: 10.1089/ten.2006.12.1971. - DOI - PubMed
    1. Fox AJS, Bedi A, Rodeo SA. The basic science of articular cartilage: structure, composition, and function. Sport Heal A Multidiscip Approach. 2009;1:461–468. doi: 10.1177/1941738109350438. - DOI - PMC - PubMed
    1. Berenbaum F, Griffin TM, Liu-Bryan R. Metabolic regulation of inflammation in osteoarthritis. Arthritis Rheumatol. 2016;69:9–21. doi: 10.1002/art.39842. - DOI - PMC - PubMed

Publication types