. 2020 Feb 18;8(1):19.
doi: 10.1186/s40478-020-0880-6.

Single-nucleus RNA-seq identifies Huntington disease astrocyte states

Affiliations

Single-nucleus RNA-seq identifies Huntington disease astrocyte states

Osama Al-Dalahmah et al. Acta Neuropathol Commun. .

Abstract

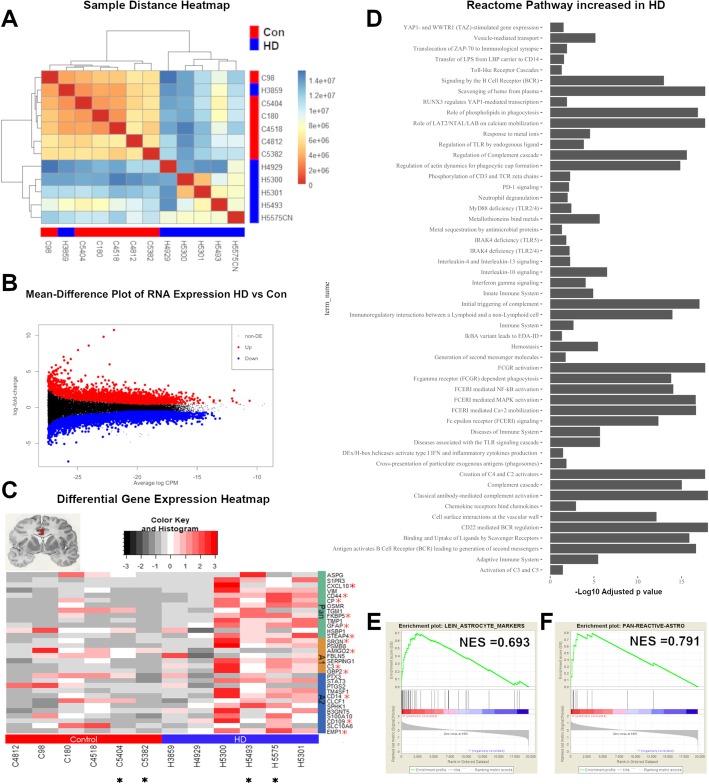
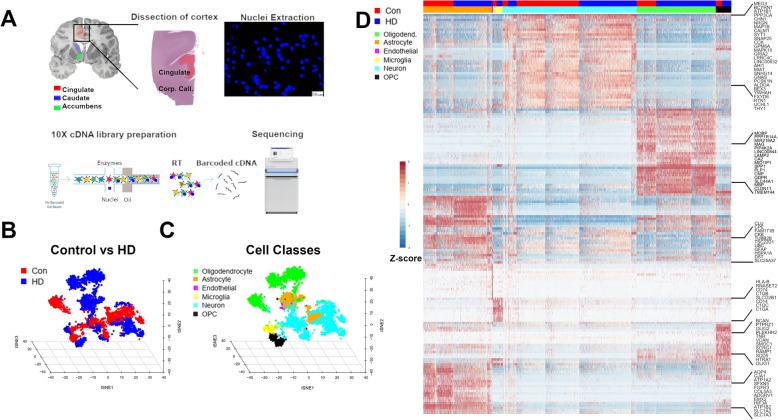
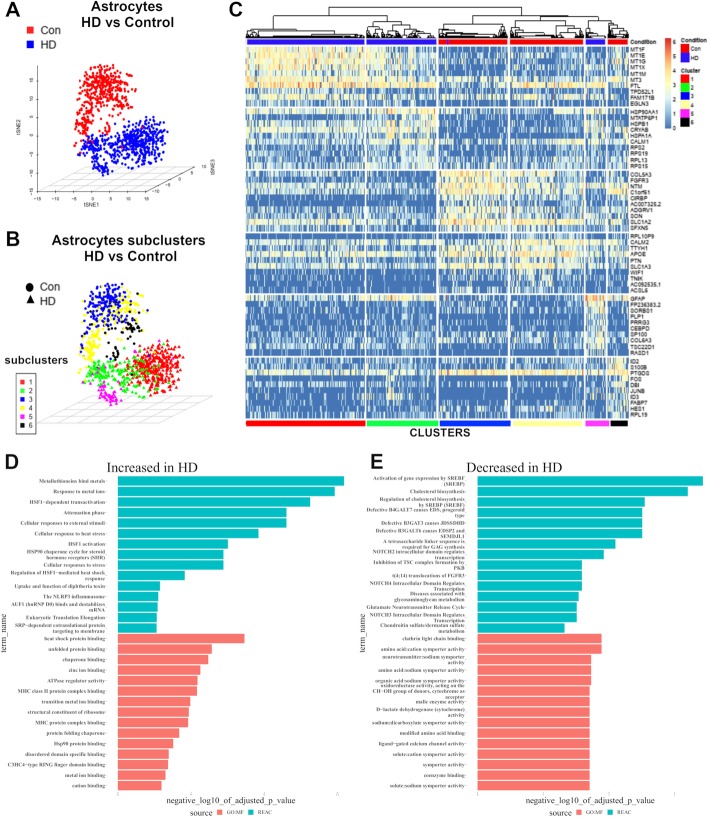
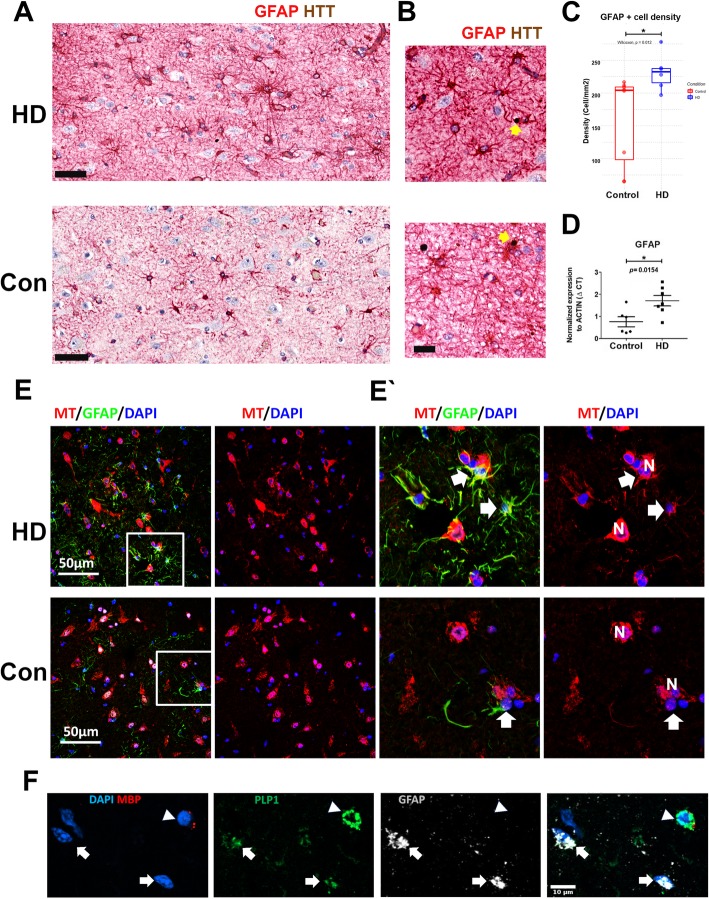
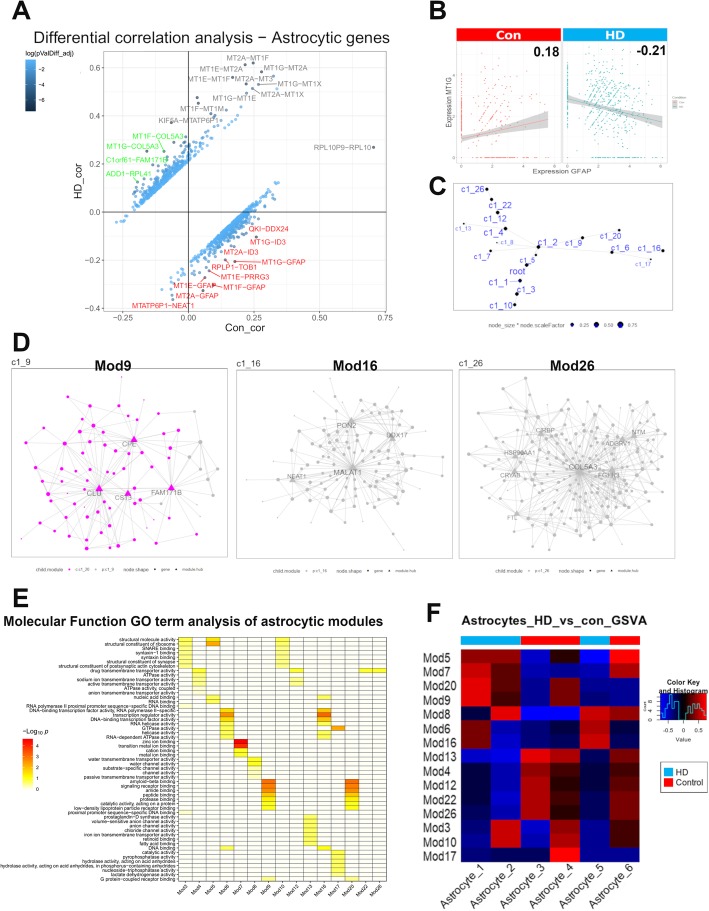
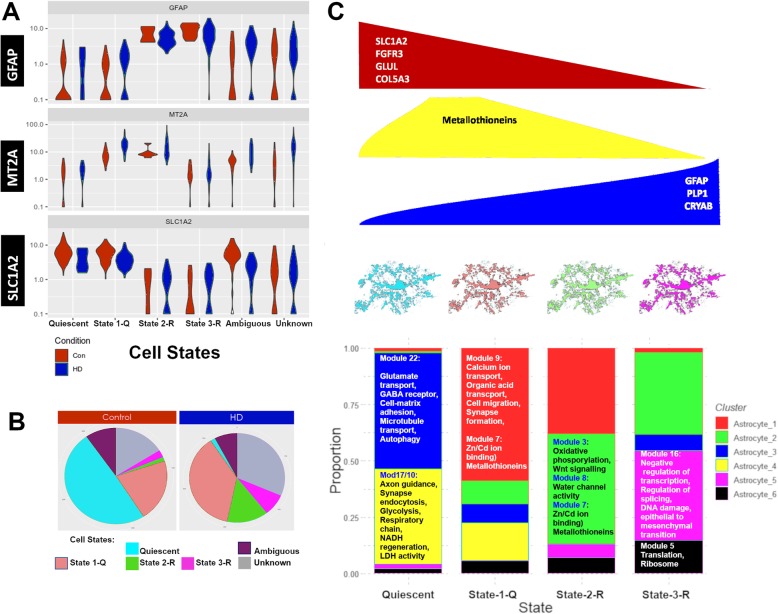
Huntington Disease (HD) is an inherited movement disorder caused by expanded CAG repeats in the Huntingtin gene. We have used single nucleus RNASeq (snRNASeq) to uncover cellular phenotypes that change in the disease, investigating single cell gene expression in cingulate cortex of patients with HD and comparing the gene expression to that of patients with no neurological disease. In this study, we focused on astrocytes, although we found significant gene expression differences in neurons, oligodendrocytes, and microglia as well. In particular, the gene expression profiles of astrocytes in HD showed multiple signatures, varying in phenotype from cells that had markedly upregulated metallothionein and heat shock genes, but had not completely lost the expression of genes associated with normal protoplasmic astrocytes, to astrocytes that had substantially upregulated glial fibrillary acidic protein (GFAP) and had lost expression of many normal protoplasmic astrocyte genes as well as metallothionein genes. When compared to astrocytes in control samples, astrocyte signatures in HD also showed downregulated expression of a number of genes, including several associated with protoplasmic astrocyte function and lipid synthesis. Thus, HD astrocytes appeared in variable transcriptional phenotypes, and could be divided into several different "states", defined by patterns of gene expression. Ultimately, this study begins to fill the knowledge gap of single cell gene expression in HD and provide a more detailed understanding of the variation in changes in gene expression during astrocyte "reactions" to the disease.

Keywords: Astrocytes; Cingulate cortex; Gene expression; Huntington disease; Single-cell RNA-sequencing.


Conflict of interest statement

The authors declare that they have no competing interests.

Figures

Fig. 1
Fig. 1
Bulk_RNASEQ. Transcriptomic analysis of Huntington disease cingulate cortex. Total RNA sequencing was done on 6 grade III/IV and 6 control cingulate cortices. a Sample distance (Manhattan method) heatmap clustered using the Ward method. b Mean-Expression plot showing log2 fold-change (LFC -HD versus control) on the y-axis, and mean normalized counts on the x-axis. Significantly differentially expressed genes are shown in red and blue for upregulated and downregulated genes, respectively. c Differential gene expression heatmap of select astrocytic genes as described in Liddelow et al. [27], with controls (Con) denoted by the red bar, and HD by the blue. Asterisks next to gene names indicate significance (Benjamini-Hochberg adjusted p value < 0.05 and absolute log fold change > = 1.5). A1, A2, and pan-reactive astrocytic genes are denoted. Asterisks below case numbers indicate which cases were selected for single cell nuclear RNAseq. d Representative GO ontology term analysis showing significantly increased Reactome pathways in HD cases from bulk RNAseq (using the gProfiler web-platform, Benjamini-Hochberg adjusted p-values set at < 0.05). e-f Gene set enrichment analysis of select astrocytic genes (Astrocyte markers and Astrocyte_differentiation -GO0048708). Normalized enrichment scores (NES) are shown
Fig. 2
Fig. 2
Single cell nucleus RNAseq of the cingulate cortex in Control and HD. a Experimental scheme; first, cingulate cortex was dissected, nuclei were extracted and visualized using DAPI nuclear stain under a fluorescence microscope to ascertain membrane integrity. The nuclei were subjected to 10X chromium single cell RNAseq workflow involving encapsulation of nuclei in oil droplets along with enzymes and barcoded beads, followed by cDNA synthesis and library preparation, and finally, sequencing. b Three-dimensional t-distributed stochastic neighbor embedding (tSNE) plot showing individual nuclei (Points, n = 4786) colored as red (Control) or blue (HD), reduced into three dimensions. c Three dimensional tSNE plot showing the classification of the nuclei into neurons (Cyan), Oligodendrocytes (Green), Astrocytes (Orange), Oligodendrocyte precursor cells (OPC- Black), Microglia (Magenta), and endothelial cells (Purple). d Gene expression heat map of z-scaled normalized counts showing nuclei (Columns) and specific cell-type markers (Rows), a subset of which are shown on the right. Condition (Con versus HD) and Cell-types are color-coded on the top as in panels b-c
Fig. 3
Fig. 3
Transcriptomic analysis of astrocytic nuclei in control and HD. a Three-dimensional t-distributed stochastic neighbor embedding (tSNE) plot showing astrocytic nuclei (n = 1064–469 control and 595 HD) colored as red (Control) or blue (HD), reduced into three dimensions. b Three dimensional tSNE plot showing the classification of the astrocytic nuclei into 6 sub-clusters using consensus k-means clustering (sc3 package). c Gene expression heat map of cluster markers showing nuclei (Columns) and specific cell-type markers (Rows). Condition (Con versus HD) and Cell-types are color-coded on the top and bottom, respectively. Cluster-specific gene markers were identified using Wilcoxon signed rank test comparing gene ranks in the cluster with the highest mean expression against all others. p-values were adjusted using the “Holm” method. The genes with the area under the ROC curve (AUROC) > 0.65 and p-value< 0.01 are shown as marker genes. d-e GO term analysis of differentially expressed genes in HD versus control astrocytes identified using EdgeR likelihood ratio test with an adjusted p.value of 0.05. Significantly enriched GO terms at Benjamini-Hochberg false discovery rate of 0.05 were identified. Selected Reactome pathways and Molecular function GO terms which are increased in HD astrocytes (d) and decreased in HD astrocytes (e) are shown
Fig. 4
Fig. 4
Validation of astrocytic activation in HD. a Representative micrograph of GFAP-HTT dual immunohistochemical stain showing increased GFAP immunoreactivity in the HD cingulate cortex compared to control (scale bar = 50um, GFAP in red & HTT in brown). b Representative images showing accumulation in HTT in the neuropil and in astrocytic in two HD cases (yellow arrows - scale bar = 20um). c Quantification of A, showing increased GFAP immunoreactive cell density in the HD cingulate cortex, n = 8 for control and 6 for HD (grade III and IV), P value = 0.012 (one-sided t-Mann-Whitney U test). d Real-time quantitative PCR showing relative expression of GFAP transcript in grade III/IV HD (n = 7 for HD and 6 for control) Delta CT value normalized to B-Actin transcript levels are shown. P value = 0.0154 (one-sided t-test). e Representative fluorescent immunohistochemical stains showing GFAP (red), metallothionein (MT-green), and DAPI stained nuclei (blue) from a representative control and grade IV HD case. There is increased GFAP immune-positive cells in layers V/VI of the HD cingulate cortex, and large proportion of these astrocytes are MT positive, compared to control (scale bar = 60um).60um). f In situ hybridization (RNAscope™) showing probes for MBP (red), GFAP (white), PLP1 (green), and DAPI-stained nuclei (blue). Note the co-localization of GFAP and PLP-1 (white arrows). An MBP positive PLP-1 positive Oligodendrocyte is indicated by the arrow head. (scale bar = 10um)
Fig. 5
Fig. 5
A deeper look into astrocytic gene regulation in HD. a Differential gene correlation analysis of the top 5% of genes in astrocytic nuclei by mean normalized expression (856 genes). Pearson correlation coefficients are shown and empirical p-values were calculated by a permutation test (100 permutations) in DGCA package in R. Top gene-pairs that are significantly differentially correlated between HD and control astrocytes are labeled. b Scatterplot of normalized expression of GFAP and MT1G (A representative metallothionein gene) in Control (left panel) and HD (Right panel) astrocytic nuclei. Pearson correlation coefficients are shown and are significantly different between control and HD. c Hierarchy structure representing the astrocytic gene modules/networks (labeled here as c1_3, c1_5, … etc) as the output using Multiscale Embedded Gene Co-Expression Network Analysis (MEGENA). Clusters on the same line are more related to each other than clusters on different lines. d Representative gene modules/networks, illustrating modules 9, 16, and 26. Hub genes are shown as triangles, genes as nodes, different colors represent different networks in the same graph (Left panel – Mod9). e Gene Ontology term enrichment analysis showing representative “Molecular Function” gene ontologies enriched in astrocytic gene modules. f Gene set variation analysis showing enrichment scores of modules in different astrocytic clusters, condition is shown as colored bars on the top
Fig. 6
Fig. 6
Three reactive astrocytic states in HD. a Supervised classification of astrocytic nuclei based on normalized expression levels of GFAP, MT2A, and SLC1A2 in control (red) and HD (blue) presented as violin plots. Four states are noted: Quiescent, state1Q, state-2R, and state-3R. Ambiguous and unknown state represent cells that met more than one classification condition or none, respectively. b Pie charts of the relative proportions of the astrocytic states in control and HD. c Cartoon summary of the astrocytic states color coded as in (b) with respect to the expression of reactive genes such as CRYAB, GFAP, and MTs, as well as protoplasmic astrocyte genes such as SLC1A2, FGFR3, and . The lower panel shows the proportion of astrocytic clusters colored as described in the legend on the right (same as Fig. 3a-c) in each of the quiescent and reactive states (as described in panels A-B). Top gene modules that characterize each astrocytic cluster are described

References

    1. Ament SA, Pearl JR, Cantle JP, Bragg RM, Skene PJ, Coffey SR, Bergey DE, Wheeler VC, MacDonald ME, Baliga NS et al (2018) Transcriptional regulatory networks underlying gene expression changes in Huntington’s disease. Mol Syst Biol 14. 10.15252/msb.20167435 - PMC - PubMed
    1. Arzberger T, Krampfl K, Leimgruber S, Weindl A. Changes of NMDA receptor subunit (NR1, NR2B) and glutamate transporter (GLT1) mRNA expression in Huntingtonʼs disease—an in situ hybridization study. J Neuropathol Exp Neurol. 1997;56:440–454. doi: 10.1097/00005072-199704000-00013. - DOI - PubMed
    1. Benraiss A, Wang S, Herrlinger S, Li X, Chandler-Militello D, Mauceri J, Burm HB, Toner M, Osipovitch M, Jim Xu Q et al (2016) Human glia can both induce and rescue aspects of disease phenotype in Huntington disease. Nat Commun 7. 10.1038/ncomms11758 - PMC - PubMed
    1. Björkqvist M, Wild EJ, Thiele J, Silvestroni A, Andre R, Lahiri N, Raibon E, Lee RV, Benn CL, Soulet D, et al. A novel pathogenic pathway of immune activation detectable before clinical onset in Huntington’s disease. J Exp Med. 2008;205:1869–1877. doi: 10.1084/jem.20080178. - DOI - PMC - PubMed
    1. Bradford J, Shin J-Y, Roberts M, Wang C-E, Li X-J, Li S. Expression of mutant huntingtin in mouse brain astrocytes causes age-dependent neurological symptoms. Proc Natl Acad Sci. 2009;106:22480–22485. doi: 10.1073/pnas.0911503106. - DOI - PMC - PubMed

Publication types