. 2020 Apr 9;10(4):1361-1374.
doi: 10.1534/g3.119.400908.

BlobToolKit - Interactive Quality Assessment of Genome Assemblies

Affiliations

BlobToolKit - Interactive Quality Assessment of Genome Assemblies

Richard Challis et al. G3 (Bethesda). .

Abstract

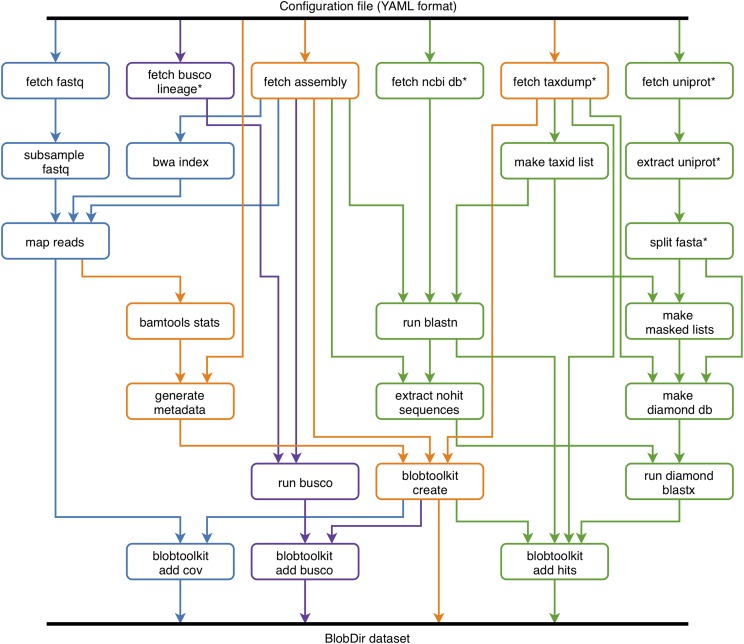
Reconstruction of target genomes from sequence data produced by instruments that are agnostic as to the species-of-origin may be confounded by contaminant DNA. Whether introduced during sample processing or through co-extraction alongside the target DNA, if insufficient care is taken during the assembly process, the final assembled genome may be a mixture of data from several species. Such assemblies can confound sequence-based biological inference and, when deposited in public databases, may be included in downstream analyses by users unaware of underlying problems. We present BlobToolKit, a software suite to aid researchers in identifying and isolating non-target data in draft and publicly available genome assemblies. BlobToolKit can be used to process assembly, read and analysis files for fully reproducible interactive exploration in the browser-based Viewer. BlobToolKit can be used during assembly to filter non-target DNA, helping researchers produce assemblies with high biological credibility. We have been running an automated BlobToolKit pipeline on eukaryotic assemblies publicly available in the International Nucleotide Sequence Data Collaboration and are making the results available through a public instance of the Viewer at https://blobtoolkit.genomehubs.org/view We aim to complete analysis of all publicly available genomes and then maintain currency with the flow of new genomes. We have worked to embed these views into the presentation of genome assemblies at the European Nucleotide Archive, providing an indication of assembly quality alongside the public record with links out to allow full exploration in the Viewer.

Keywords: Bioinformatics; genome assembly; quality control; visualisation web-tool.


Figures

Figure 1
Figure 1
Assembly views available in the BlobToolKit Viewer, illustrated using the Drosophila albomicans assembly ACVV01 (Zhou et al. 2012). (A) Square-binned blob plot showing the distribution of assembly scaffolds on GC proportion and coverage axes. Squares within each bin are colored according to taxonomic annotation and scaled according to total span. Scaffolds within each bin can be selected for further investigation. (B) Cumulative assembly span plot showing curves for subsets of scaffolds assigned to each phylum relative to the overall assembly. (C) Snail plot summary of assembly statistics. (D) BUSCO scores allow selection of all scaffolds with a BUSCO reference gene in each category. These images derive from analyses of the whole assembly. Each view updates automatically in response to any filters or selections that are applied to the dataset. This figure can be regenerated, and explored further, using the URLs given in File S1.
Figure 2
Figure 2
Depiction of the snakemake workflow used to analyze publicly available (INSDC-registered) eukaryotic genome assemblies. The workflow is run once for each assembly. Each box represents a Snakemake rule that may be run one or more times during workflow execution. The workflow can be logically divided into four parts: (i) creation of a minimal BlobDir dataset based on a single assembly with metadata derived from the configuration file and additional taxonomic annotation from the NCBI taxdump, shown in orange; (ii) addition of sequence-similarity search results based on blastn and Diamond blastp searches of the nt and refseq databases, shown in green; (iii) addition of read coverage data based on minimap2 alignment of read files linked to the assembly record (where available), shown in blue; and (iv) addition of BUSCO results based on analyses with all relevant BUSCO lineages, shown in purple. Rules marked with an asterisk are typically only run the first time the pipeline is executed as they generate local copies of relevant database files used elsewhere in the pipeline.
Figure 3
Figure 3
Blobplot of base coverage in read set SRR026696 against GC proportion for scaffolds in Drosophila albomicans assembly ACVV01. (A & B) Scaffolds are colored by phylum with Proteobacteria highlighted in orange and all other phyla grouped together in gray. Histograms show the distribution of scaffold length sum along each axis. (A) Square-binned blob plot at a resolution of 30 divisions on each axis. Colored squares within each bin are sized in proportion to the sum of individual scaffold lengths on a logarithmic scale, ranging from 867 to 40,536,114. The bins highlighted in pink contain a total of 5 scaffolds that have been annotated as Proteobacteria but that contain BUSCOs using the diptera_odb9 BUSCO set. (B) A simplified representation of the distributions of scaffolds assigned to each phylum highlights the difference in GC proportion and coverage of Proteobacteria scaffolds. Each kite has a pair of lines representing two standard deviations about the mean on each axis (weighted to account for scaffold lengths) that intersect at a point representing the weighted median. They are angled according to a weighted linear regression equation to indicate the relationship between coverage and GC proportion. (C) Assembly filtered to exclude non-proteobacterial scaffolds. Scaffolds are colored by genus with Acetobacter highlighted in orange, Gluconobacter shown in blue and Wolbachia shown in green. Colored squares within each bin are sized in proportion to the sum of individual scaffold lengths on a square-root scale, ranging from 1,005 to 771,195. (D) A simplified representation of the distributions of scaffolds assigned to each genus highlights the difference in GC proportion and coverage of Acetobacter, Gluconobacter and Wolbachia scaffolds. This figure can be regenerated, and explored further, using the URLs given in File S1. The list of scaffolds highlighted in (A) is available in File S2.
Figure 4
Figure 4
Visualization of the highly fragmented Conus consors assembly SDAX01. (A) Binned distribution of all 2,688,687 assembly scaffolds shows unimodal distributions in GC proportion and coverage axes. The majority of scaffolds lack a taxonomic annotation (assigned to “no-hit”). (B) Square-binned plot of coverage in read set SRR1719763 against coverage in SRR1712902 for scaffolds with coverage <= 0.01 in read set SRR1714990. The extent of the unfiltered distribution is indicated by the empty square bins. (C) In the interactive browser datasets with over 1,000,000 scaffolds are presented with the “no-hit” scaffolds filtered out to reduce computation. In this case, 43,857 scaffolds are plotted in the filtered dataset. (D) A non-binned presentation of the same data shows the challenges of interpreting a dataset plotted as a large number of overlapping circles, even after filtering “no-hit”. (E) A simplified representation of the distributions of scaffolds assigned to each phylum highlights the difference in GC proportion and coverage of scaffolds assigned to Firmicute. This figure can be regenerated, and explored further, using the URLs given in File S1.
Figure 5
Figure 5
Blob plots of the Crypturellus cinnamomeus assembly PTEZ01 showing the presence of an apicomplexan parasite. (A) Circles are scaled with area proportional to scaffold length and colored by phylum. Scaffolds assigned to the phylum Apicomplexa are colored orange and form a distinct blob relative to the majority of Chordata-assigned scaffolds, shown in gray. (B) Circles are colored by family and scaffolds assigned to families other than Physeteridae, Odontophoridae or Sarcocystidae have been filtered out. Scaffolds with coverage greater than 2 in the SRR6918124 read set have also been excluded. (C) A square-binned plot in which bins containing scaffolds with BUSCO annotations using any of the applicable reference gene sets are outlined in pink. This figure can be regenerated, and explored further, using the URLs given in File S1. The list of scaffolds highlighted in (C) is available in File S3.

References

    1. Altschul S., 1997. Gapped BLAST and PSI-BLAST: a new generation of protein database search programs. Nucleic Acids Res. 25: 3389–3402. 10.1093/nar/25.17.3389 - DOI - PMC - PubMed
    1. Amid, C., B. T. F. Alako, V. Balavenkataraman Kadhirvelu, T. Burdett, J. Burgin et al., 2019 The European Nucleotide Archive in 2019. Nucleic Acids Res. - PMC - PubMed
    1. Andreson R., Roosaare M., Kaplinski L., Laht S., Kõressaar T. et al. , 2019. Gene content of the fish-hunting cone snail Conus consors. bioRxiv. 590695 10.1101/590695 - DOI
    1. Arakawa K., 2016. No evidence for extensive horizontal gene transfer from the draft genome of a tardigrade. Proc. Natl. Acad. Sci. USA 113: E3057 10.1073/pnas.1602711113 - DOI - PMC - PubMed
    1. Artamonova I. I., Lappi T., Zudina L., and Mushegian A. R., 2015. Prokaryotic genes in eukaryotic genome sequences: when to infer horizontal gene transfer and when to suspect an actual microbe. Environ. Microbiol. 17: 2203–2208. 10.1111/1462-2920.12854 - DOI - PubMed

Publication types

LinkOut - more resources