Review
. 2020 Mar 3;117(9):4464-4470.
doi: 10.1073/pnas.1921724117. Epub 2020 Feb 18.

Climate and plant community diversity in space and time

Affiliations
Review

Climate and plant community diversity in space and time

Susan Harrison et al. Proc Natl Acad Sci U S A. .

Abstract

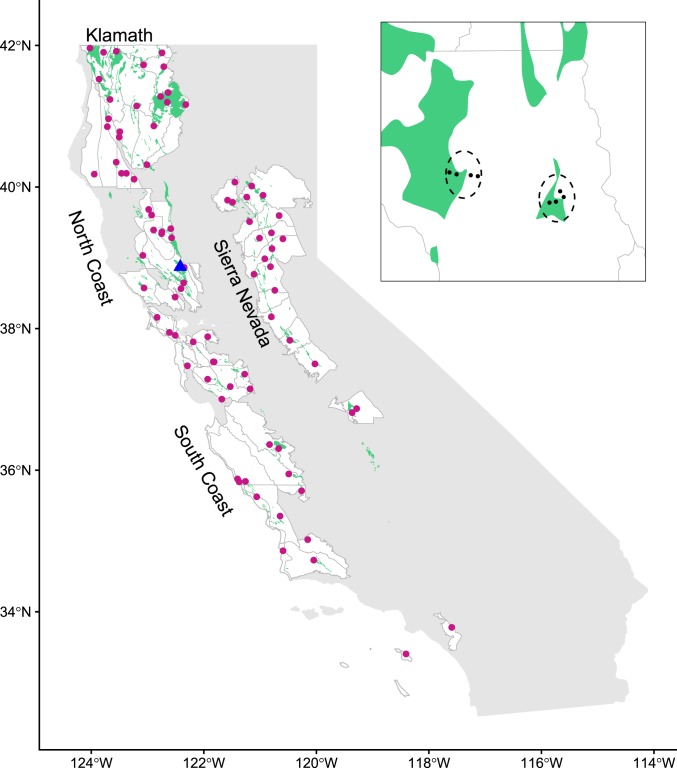
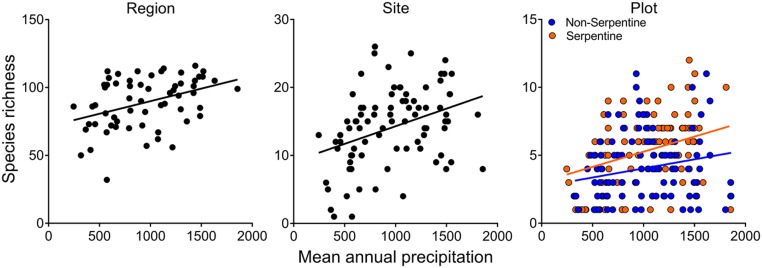
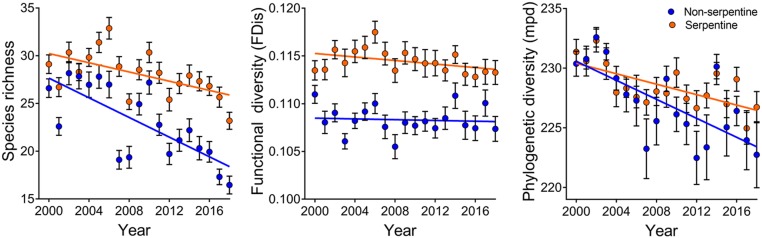
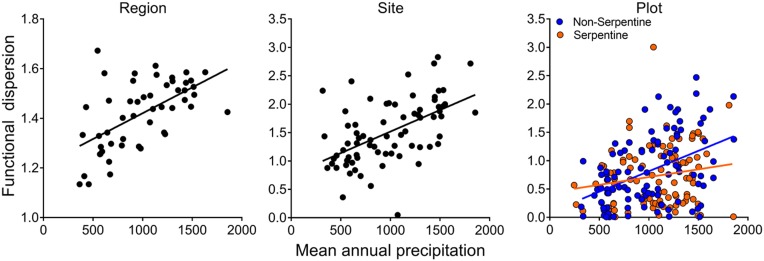
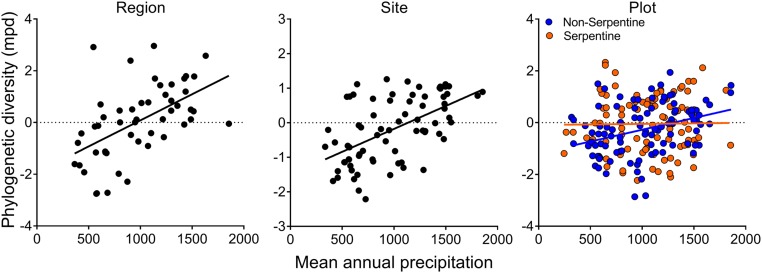
Climate strongly shapes plant diversity over large spatial scales, with relatively warm and wet (benign, productive) regions supporting greater numbers of species. Unresolved aspects of this relationship include what causes it, whether it permeates to community diversity at smaller spatial scales, whether it is accompanied by patterns in functional and phylogenetic diversity as some hypotheses predict, and whether it is paralleled by climate-driven changes in diversity over time. Here, studies of Californian plants are reviewed and new analyses are conducted to synthesize climate-diversity relationships in space and time. Across spatial scales and organizational levels, plant diversity is maximized in more productive (wetter) climates, and these consistent spatial relationships are mirrored in losses of taxonomic, functional, and phylogenetic diversity over time during a recent climatic drying trend. These results support the tolerance and climatic niche conservatism hypotheses for climate-diversity relationships, and suggest there is some predictability to future changes in diversity in water-limited climates.

Keywords: aridification; climate change; drought; functional diversity; phylogenetic diversity.


Conflict of interest statement

Competing interest statement: M.J.S. and F.S.C. are coauthors on a 2018 research article.

Figures

Fig. 1.
Fig. 1.
Statewide study regions (white areas) and sites (red dots). (Inset) One region with two sites (dashed ellipses), each of which consists of four plots (black dots), two of which are on serpentine soil (green area) and two of which are on nearby nonserpentine soil. Blue triangle represents grassland study location (McLaughlin University of California Reserve).
Fig. 2.
Fig. 2.
Taxonomic diversity (species richness) of woody plants versus mean annual rainfall at the regional scale (P = 0.002), site (P < 0.0001), and plot scale (rainfall P = 0.0001, soil type P = 0.001, interaction P = 0.12). Similar relationships (not shown) were found for taxonomic diversity versus NDVI at the regional (P < 0.0001), site (P = 0.0001), and plot scale (NDVI P < 0.0001, soil type P < 0.0001, interaction P = 0.08).
Fig. 3.
Fig. 3.
Taxonomic, functional, and phylogenetic diversity of herbaceous plants versus time at 80 grassland study sites on contrasting soils (38 serpentine, 42 nonserpentine). Time and time–soil interaction are significant for taxonomic diversity (P < 0.0001 for year and year × soil) and phylogenetic diversity (P < 0.0001 for year, P = 0.035 for year × soil); only time is significant for functional diversity (P = 0.037).
Fig. 4.
Fig. 4.
Functional diversity (dispersion) of woody plants versus mean annual rainfall at the regional scale (P = 0.0001), site (P < 0.0001), and plot scale (rainfall P = 0.0001, soil type P = 0.001, interaction P = 0.02). Similar relationships (not shown) were found for functional diversity versus NDVI at the regional (P < 0.0001), site (P = 0.0001), and plot scale (NDVI P < 0.0001, soil type P = 0.36, interaction P = 0.20). Sites or plots with only one woody species (4 of 78 sites, 32 of 224 plots) were excluded from these analyses.
Fig. 5.
Fig. 5.
Phylogenetic diversity (mean phylogenetic distance) of woody plants versus mean annual rainfall at the regional scale (P = 0.0001), site (P < 0.0001), and plot scale (rainfall P = 0.031, soil type P = 0.21, interaction P = 0.29). Similar relationships (not shown) were found for phylogenetic diversity versus NDVI at the regional (P < 0.0002), site (P = 0.0001), and plot scale (NDVI P = 0.81, soil type P = 0.15, interaction P = 0.045); the plot–scale relationship with NDVI was significant for nonserpentine soils but not for serpentine soils.

Comment in

References

    1. Hawkins B. A., et al. , Energy, water, and broad-scale geographic patterns of species richness. Ecology 84, 3105–3117 (2003).
    1. Kreft H., Jetz W., Global patterns and determinants of vascular plant diversity. Proc. Natl. Acad. Sci. U.S.A. 104, 5925–5930 (2007). - PMC - PubMed
    1. Sommer J. H., et al. , Projected impacts of climate change on regional capacities for global plant species richness. Proc. Biol. Sci. 277, 2271–2280 (2010). - PMC - PubMed
    1. McLaughlin B. C., et al. , Hydrologic refugia, plants, and climate change. Glob. Change Biol. 23, 2941–2961 (2017). - PubMed
    1. Currie D. J., et al. , Predictions and tests of climate-based hypotheses of broad-scale variation in taxonomic richness. Ecol. Lett. 7, 1121–1134 (2004).

Publication types