. 2020 Mar 3;117(9):4942-4947.
doi: 10.1073/pnas.1913135117. Epub 2020 Feb 18.

Noninvasive muscle activity imaging using magnetography

Affiliations

Noninvasive muscle activity imaging using magnetography

Rodolfo R Llinás et al. Proc Natl Acad Sci U S A. .

Abstract

A spectroscopic paradigm has been developed that allows the magnetic field emissions generated by the electrical activity in the human body to be imaged in real time. The growing significance of imaging modalities in biology is evident by the almost exponential increase of their use in research, from the molecular to the ecological level. The method of analysis described here allows totally noninvasive imaging of muscular activity (heart, somatic musculature). Such imaging can be obtained without additional methodological steps such as the use of contrast media.

Keywords: magnetocardiography; magnetoencephalography; magnetomyograph; precise frequency-pattern analysis.


Conflict of interest statement

The authors declare no competing interest.

Figures
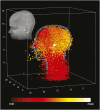
Fig. 1.
Fig. 1.
Average functional tomogram of resting activity reconstructed from the frequency spectra from 10 subjects (Methods). The tomogram is embedded in 3D space and can be viewed from any axis. The outline of a head has been superimposed on the tomogram as a guide to the orientation selected for this figure. Note that the spatial distribution of activity includes signals from the brain (yellow-range signal) and muscles of the head and neck region (red-range signal). (Inset) provides the position of the head and shows the nasion and left preauricular fiducial markers. The positions of these markers are superimposed on the tomogram as an aid to orientation. (Subject’s head inside the MEG sensor helmet, resolution = 3 mm.)
Fig. 2.
Fig. 2.
MCG and heart structure reconstructed from the frequency spectra of one subject. (A) Three cycles of the MCG. (B) Multichannel MCG spectrum. (C, Lower) Functional tomogram of the heart; (C, Upper), image of heart for reference. (Left side of chest under the sensor helmet, resolution = 2 mm.)
Fig. 3.
Fig. 3.
MCG of a single cardiac cycle. (Upper) Single cardiac cycle with stages of the cardiac cycle marked. (Lower) Current dipoles, calculated at every stage, are plotted over the functional tomogram, reconstructed from the spectra such as that shown in Fig. 2B. (Left side of chest under the sensor helmet, resolution = 2 mm.)
Fig. 4.
Fig. 4.
Magnetic structure of the activated hand musculature, reconstructed from the frequency spectra. (Left) The hand showing the fingers bound by tape and its location within the sensor helmet. Note that the back of the hand and the index finder touched the sensor helmet. Recordings were made with the hand relaxed (no signal) and during isometric extension (when the subject attempted to separate the fingers). (Center) Dorsal view of the magnetic image reconstructed from the frequency spectra of the contracting muscles during isometric extension. The dot above represents the tip of the index finger touching the upper part of the sensor helmet (resolution = 1 mm). (Right) Anatomical drawing of a hand illustrating the dorsal interossei musculature. (Left hand and wrist within the sensor helmet, resolution = 1 mm, color scale as in Fig. 3.)
Fig. 5.
Fig. 5.
Magnetic image of pain source in back muscles. (Upper Left) Functional tomogram of resting muscle activity in one subject. (Upper Right) Superposition of MEG activity on an image of the right hip showing psoas and iliacus muscles. (Lower Left) Photo of subject with his lower back under the sensor helmet. (Lower Right) Drawing for orientation showing location of psoas and iliacus muscles. (Lying prone with lower back under the sensor helmet, voxel size, 3 × 3 × 6 mm, color scale as in Fig. 3.)
Fig. 6.
Fig. 6.
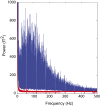
Comparison of the summary power of the magnetic recording for the isometrically extended hand, as described in Fig. 3 (blue) and the summary power for the “empty room” recording or baseline noise (red). Note that the contracted muscle signal is 20–30 times larger than the power of the baseline.

References

    1. Kherlopian A. R., et al. , A review of imaging techniques for systems biology. BMC Syst. Biol. 2, 74 (2008). - PMC - PubMed
    1. Zetter R., Iivanainen J., Parkkonen L., Optical co-registration of MRI and on-scalp MEG. Sci. Rep. 9, 5490 (2019). - PMC - PubMed
    1. Chella F., et al. , The impact of improved MEG-MRI co-registration on MEG connectivity analysis. Neuroimage 197, 354–367 (2019). - PubMed
    1. Clarke J., Lee Y.-H., Schneiderman J., Focus on SQUIDs in biomagnetism. Supercond. Sci. Technol. 31, 080201 (2018).
    1. Wijesinghe R. S., Magnetic measurements of peripheral nerve function using a neuromagnetic current probe. Exp. Biol. Med. (Maywood) 235, 159–169 (2010). - PubMed

Publication types

LinkOut - more resources