. 2020 Mar 3;117(9):4910-4920.
doi: 10.1073/pnas.1916034117. Epub 2020 Feb 18.

GDF11 promotes osteogenesis as opposed to MSTN, and follistatin, a MSTN/GDF11 inhibitor, increases muscle mass but weakens bone

Affiliations

GDF11 promotes osteogenesis as opposed to MSTN, and follistatin, a MSTN/GDF11 inhibitor, increases muscle mass but weakens bone

Joonho Suh et al. Proc Natl Acad Sci U S A. .

Abstract

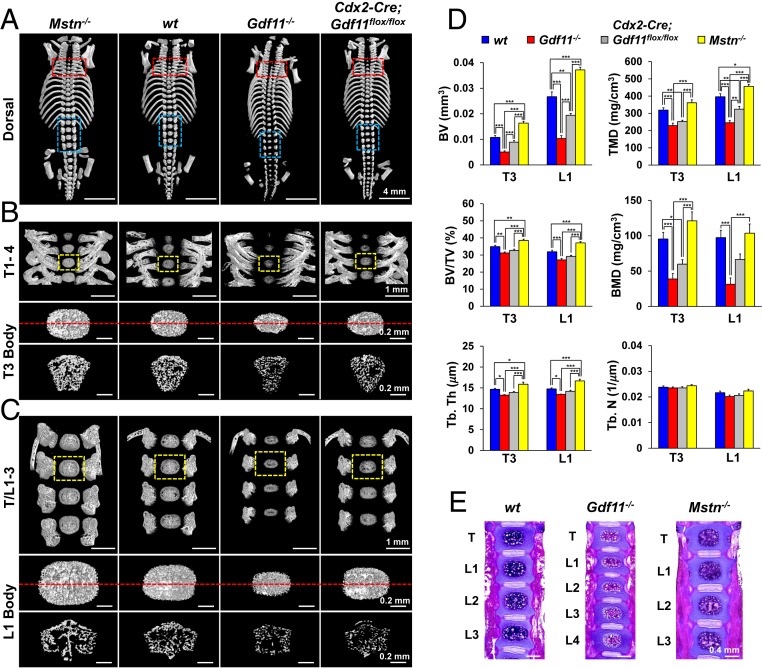
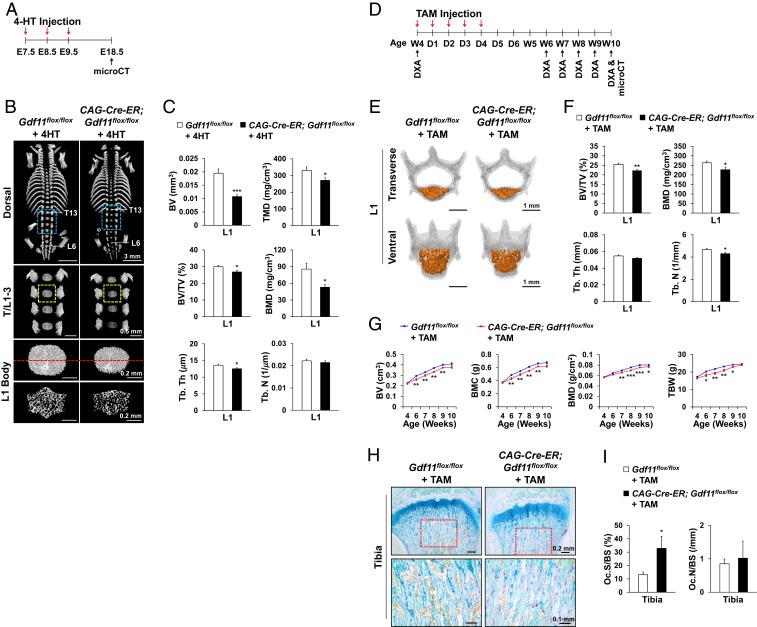
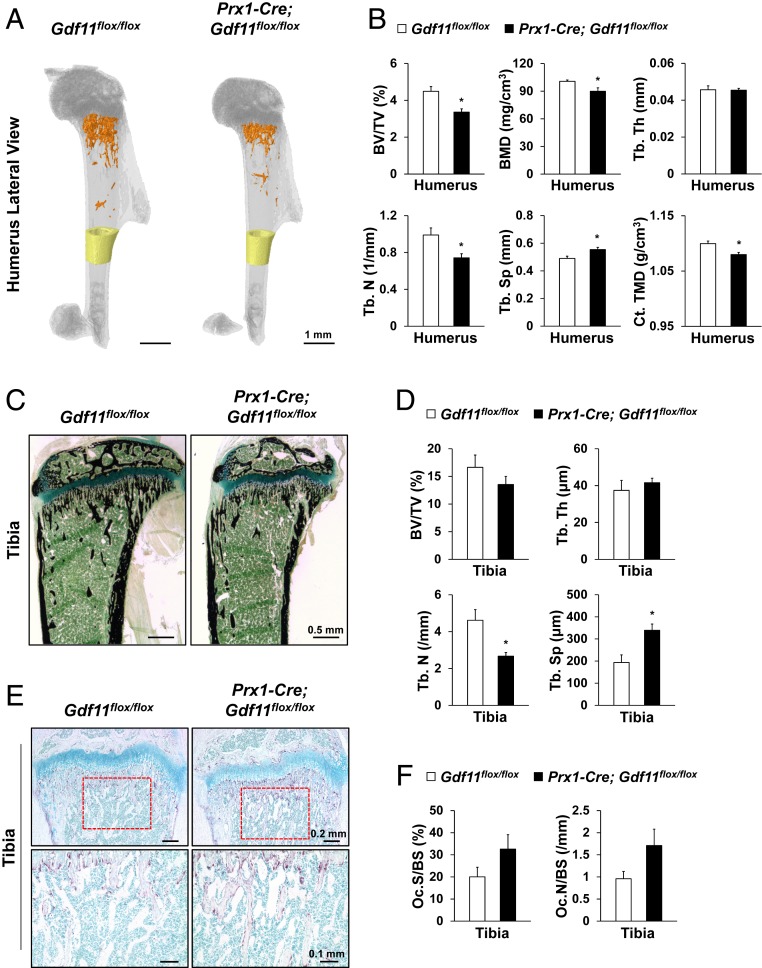
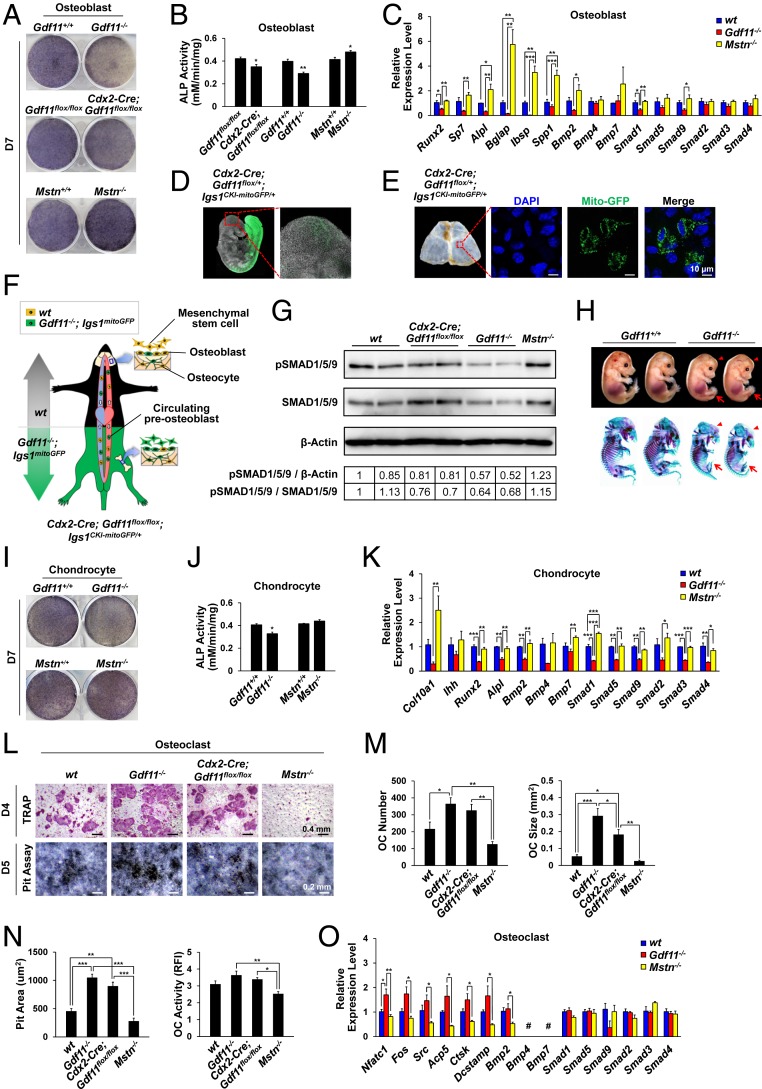
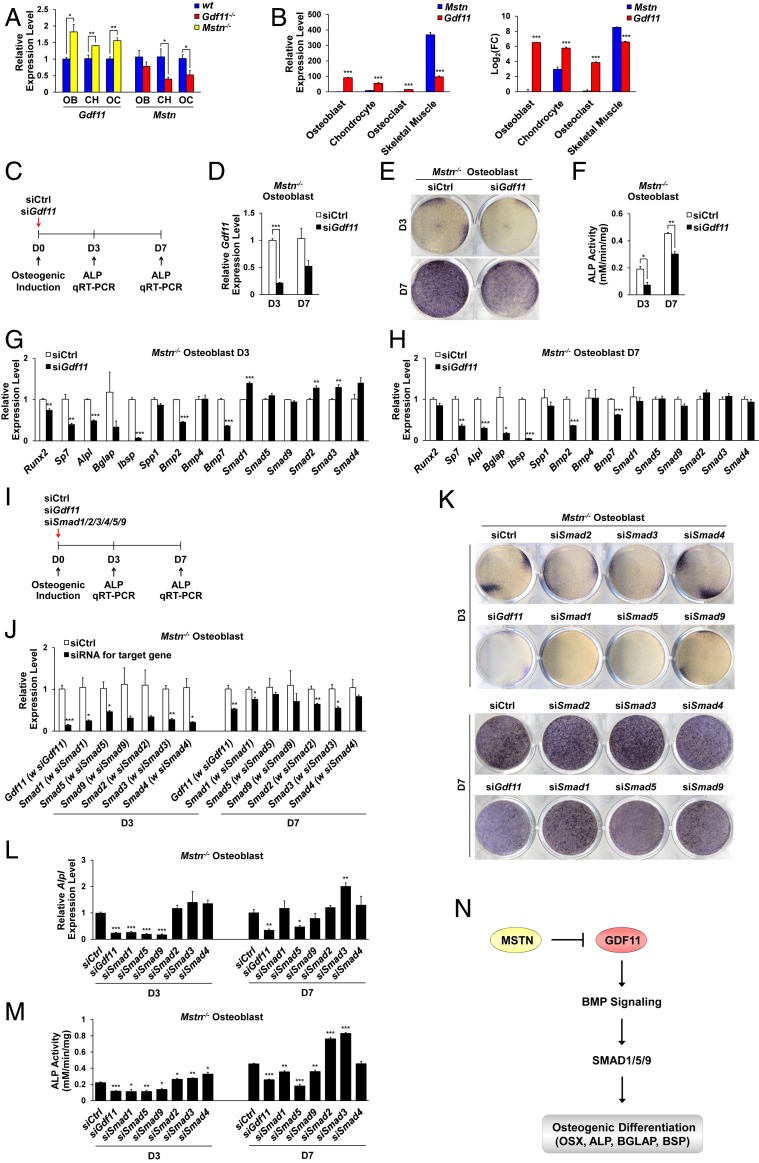
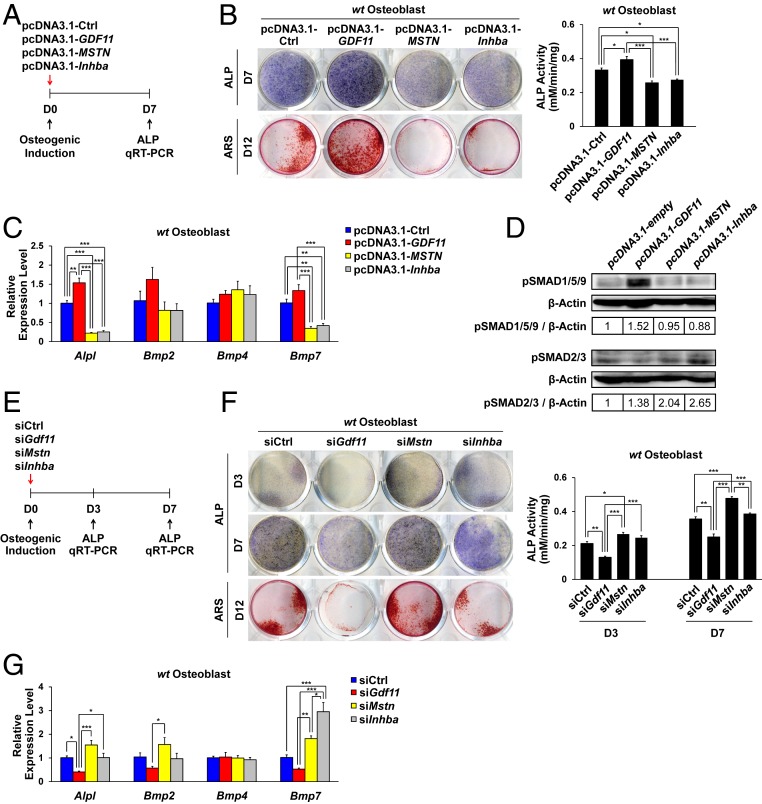
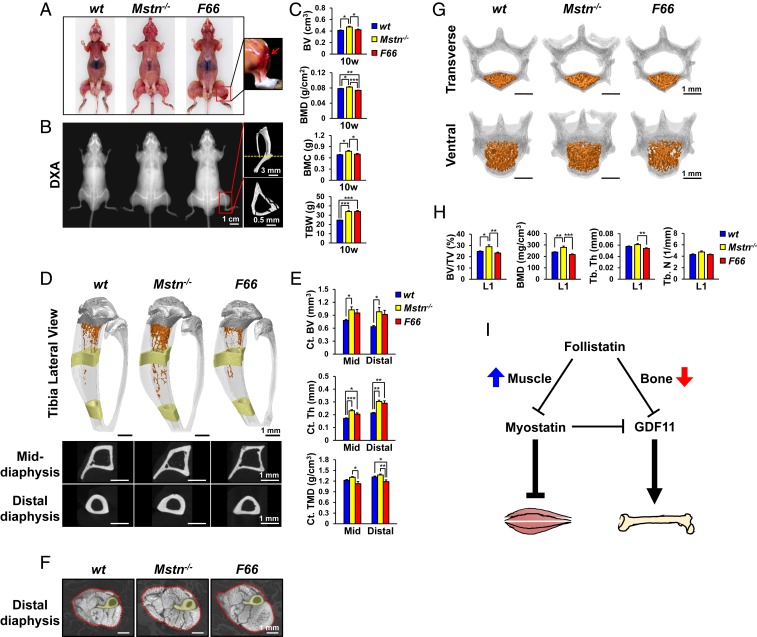
Growth and differentiation factor 11 (GDF11) and myostatin (MSTN) are closely related transforming growth factor β (TGF-β) family members, but their biological functions are quite distinct. While MSTN has been widely shown to inhibit muscle growth, GDF11 regulates skeletal patterning and organ development during embryogenesis. Postnatal functions of GDF11, however, remain less clear and controversial. Due to the perinatal lethality of Gdf11 null mice, previous studies used recombinant GDF11 protein to prove its postnatal function. However, recombinant GDF11 and MSTN proteins share nearly identical biochemical properties, and most GDF11-binding molecules have also been shown to bind MSTN, generating the possibility that the effects mediated by recombinant GDF11 protein actually reproduce the endogenous functions of MSTN. To clarify the endogenous functions of GDF11, here, we focus on genetic studies and show that Gdf11 null mice, despite significantly down-regulating Mstn expression, exhibit reduced bone mass through impaired osteoblast (OB) and chondrocyte (CH) maturations and increased osteoclastogenesis, while the opposite is observed in Mstn null mice that display enhanced bone mass. Mechanistically, Mstn deletion up-regulates Gdf11 expression, which activates bone morphogenetic protein (BMP) signaling pathway to enhance osteogenesis. Also, mice overexpressing follistatin (FST), a MSTN/GDF11 inhibitor, exhibit increased muscle mass accompanied by bone fractures, unlike Mstn null mice that display increased muscle mass without fractures, indicating that inhibition of GDF11 impairs bone strength. Together, our findings suggest that GDF11 promotes osteogenesis in contrast to MSTN, and these opposing roles of GDF11 and MSTN must be considered to avoid the detrimental effect of GDF11 inhibition when developing MSTN/GDF11 inhibitors for therapeutic purposes.

Keywords: BMP; GDF11; follistatin; myostatin; osteogenesis.


Figures

Fig. 1.
Fig. 1.
Gdf11 deletion reduces bone mass as opposed to Mstn deletion. (AC) Representative microCT images of newborn mouse vertebrae. Red and blue boxed regions indicate first–fourth thoracic vertebrae (T1–4), last thoracic vertebrae, and first–third lumbar vertebrae (T/L1–3), respectively. Yellow boxed regions in B and C are magnified to display T3 and L1 bodies, respectively. Cross sections of T3 and L1 bodies at positions indicated by the red dashed lines are shown right below them in B and C, respectively. (D) Histomorphometric analysis of T3 and L1 bodies in newborn mice (n = 10 each). BV; TMD; BV/TV, BV/total volume of interest; BMD; Tb. Th; Tb. N, trabecular number. Data represent mean ± SEM. *P < 0.05, **P < 0.01, and ***P < 0.001 by ANOVA with Tukey’s post hoc test. (E) Representative hematoxylin and eosin staining of frontal vertebrae sections in newborn mice (n = 3 each). All scale bars are displayed with actual size values.
Fig. 2.
Fig. 2.
Time-specific Gdf11 deletion impairs bone development in both E18.5 embryos and young adult mice. (A) 4-HT injection scheme. (B) Representative microCT images of mouse vertebrae at E18.5. Blue boxed regions indicate T/L1–3, and yellow boxed regions are magnified to display L1 bodies. Cross sections of L1 bodies at the position indicated by the red dashed line are shown right below them. (C) Histomorphometric analysis of L1 bodies in E18.5 embryos (n = 10 each). (D) TAM injection scheme. Dual-energy X-ray absorptiometry (DXA). (E) Representative microCT images of 10-wk-old mouse vertebrae (L1). Tb. bones of vertebral bodies are colored in orange. (F) Histomorphometric analysis of L1 Tb. bone in 10-wk-old mice (n = 10 for Gdf11flox/flox mice and n = 8 for CAG-Cre-ER; Gdf11flox/flox mice). (G) DXA analysis of TAM-treated mice from 4 to 10 wk of age (n = 10 for Gdf11flox/flox mice and n = 8 for CAG-Cre-ER; Gdf11flox/flox mice). BMC, Bone mineral content; TBW. (H) Representative TRAP-stained images of 6-wk-old mouse tibia. Magnified images of the red boxed regions are displayed in the Lower panel. (I) Histomorphometric analysis of TRAP-stained images (n = 5 for Gdf11flox/flox mice and n = 3 for CAG-Cre-ER; Gdf11flox/flox mice). OC.S/BS; OC.N/BS, OC.N per BS. All scale bars are displayed with actual size values. All data represent mean ± SEM. *P < 0.05, **P < 0.01, and ***P < 0.001 by t test.
Fig. 3.
Fig. 3.
Gdf11 deletion in Prx1-Cre-expressing mesenchyme results in decreased bone mass. (A) Representative microCT images of 5-wk-old mouse humerus. Tb. bones of Prx1-Cre; Gdf11flox/flox mice are colored in orange and Ct. bones (1 mm in height) are colored in yellow. (B) Histomorphometric analysis of Tb. and Ct. bones of 5-wk-old mouse humerus (n = 4 each). (C) Representative von Kossa-stained images of 5-wk-old mouse tibia. (D) Histomorphometric analysis of von Kossa-stained sections of 5-wk-old mouse tibia (n = 4 each). (E) Representative TRAP-stained images of 5-wk-old mouse tibia. Magnified images of the red boxed regions are displayed in the Lower panel. (F) Histomorphometric analysis of TRAP-stained images of 5-wk-old mouse tibia (n = 4 each). OC.S/BS; OC.N/BS. All Scale bars are displayed with actual size values. All data represent mean ± SEM. *P < 0.05 by t test.
Fig. 4.
Fig. 4.
Gdf11 deletion, in contrast to Mstn deletion, impairs OB differentiation and CH maturation while stimulating OC formation. (A) Representative images of ALP staining of OBs of newborn mice after 7 d of differentiation. (B) ALP activity analysis in OBs after 7 d of differentiation (n = 3 each). (C) Quantitative RT-PCR analysis in OBs after 7 d of differentiation (n = 4 each). (D) Confocal images of a mouse embryo at E9.5 display circulating GFP-positive cells. (E) Confocal images of mouse calvaria at week 4. Note the GFP-positive cells embedded in the calvaria. (F) Western blot analysis of protein extracts from calvaria of newborn mice. Quantification numbers are indicated in the table below the blots. (G) Schematic of circulating preosteoblasts. WT and GFP-positive Gdf11−/− cells are marked in yellow and green, respectively. (H) Alcian blue/alizarin red staining of E15.5 littermate embryos. The arrowheads and arrows indicate underdeveloped skulls and hindlimbs of Gdf11−/− embryos, respectively. (I) Representative images of ALP staining of costal cartilage-derived CHs of newborn mice after 7 d of differentiation. (J) ALP activity analysis in CHs after 7 d of differentiation (n = 3 each). (K) Quantitative RT-PCR analysis in CHs after 7 d of differentiation (n = 4 each). (L) Representative images of TRAP staining of spleen-derived OCs and resorption pit formation after 4 d (for TRAP) or 5 d (for pit assay) of differentiation. (M) OC number and size after TRAP staining (n = 5 each). (N) Resorption pit area and OC activity after pit assay (n = 3 each). RFI, relative fluorescence intensity. (O) Quantitative RT-PCR analysis in OCs after 4 d of differentiation (n = 4 each). #, Expression is too low to evaluate. All scale bars are displayed with actual size values. Data B and J represent mean ± SEM. *P < 0.05, and **P < 0.01 by t test. Data C, K, M, N, and O represent mean ± SEM. *P < 0.05, **P < 0.01, and ***P < 0.001 by ANOVA with Tukey’s post hoc test.
Fig. 5.
Fig. 5.
Gdf11 knockdown abrogates the enhanced osteogenic effect of Mstn deletion. (A) Quantitative RT-PCR analysis of Gdf11 and Mstn expressions in OBs, CHs, and OCs after 7 d of differentiation for OBs and CHs, and 4 d of differentiation for OCs (n = 4 each). (B) Relative expression levels of Gdf11 and Mstn are evaluated in OBs, CHs, OCs, and skeletal muscle by comparing them with the Mstn expression level in OBs, which is the lowest (n = 4 for OB, CH, OC, and n = 3 for skeletal muscle). Data on gene expression levels in skeletal muscle were taken from our previous report (45). FC, fold change. (C) Gdf11 knockdown scheme. Control (siCtrl) or Gdf11 siRNA (siGdf11) was treated with Mstn−/− OBs at day 0 of differentiation. (D) Quantitative RT-PCR analysis of Gdf11 expression in Mstn−/− OBs 3 and 7 d after Gdf11 knockdown (n = 3 each). (E) Representative images of ALP staining of Mstn−/− OBs 3 and 7 d after Gdf11 knockdown. (F) ALP activity analysis in Mstn−/− OBs 3 and 7 d after Gdf11 knockdown (n = 3 each). (G and H) Quantitative RT-PCR analysis in Mstn−/− OBs 3 d (G) and 7 d (H) after Gdf11 knockdown (n = 3 each). (I) Gdf11 and Smads knockdown scheme. Control, Gdf11, or Smad1–5, or 9 siRNA was individually treated with Mstn−/− OBs at day 0 of differentiation. (J) Quantitative RT-PCR analysis in Mstn−/− OBs 3 and 7 d after knockdown of target genes (n = 3 each). (K) Representative images of ALP staining of Mstn−/− OBs 3 and 7 d after knockdown of target genes. (L) Quantitative RT-PCR analysis of Alpl expression in Mstn−/− OBs 3 and 7 d after knockdown of target genes (n = 3 each). (M) ALP activity analysis in Mstn−/− OBs 3 and 7 d after knockdown of target genes (n = 3 each). (N) A model for regulation of bone formation by GDF11 and MSTN. All data represent mean ± SEM. *P < 0.05, **P < 0.01, and ***P < 0.001 by t test.
Fig. 6.
Fig. 6.
GDF11 overexpression enhances OB differentiation by activating the BMP signaling pathway. (A) GDF11, MSTN, and Inhba overexpression scheme. Plasmids were transfected OBs at day 0 of differentiation. (B) Representative images of ALP staining at day 7, ARS staining at day 12, and ALP activity analysis of WT OBs at day 7 of overexpression (n = 3 each). (C) Quantitative RT-PCR analysis in WT OBs at day 7 of overexpression (n = 4 each). (D) Western blot analysis of WT OBs at day 7 of overexpression. Quantification numbers are indicated in tables below the blots. (E) Gdf11, Mstn, and Inhba knockdown scheme. Control (siCtrl), Gdf11 siRNA (siGdf11), Mstn siRNA (siMstn), or Inhba siRNA (siInhba) was treated with WT OBs at day 0 of differentiation. (F) Representative images of ALP staining at day 3 and 7, ARS staining at day 12, and ALP activity analysis of WT OBs at day 3 and 7 of knockdown of target genes (n = 3 each). (G) Quantitative RT-PCR analysis in WT OBs at day 7 of knockdown of target genes (n = 4 each). Data B and F represent mean ± SEM. *P < 0.05, **P < 0.01, and ***P < 0.001 by t test. Data C and G represent mean ± SEM. *P < 0.05, **P < 0.01, and ***P < 0.001 by ANOVA with Tukey’s post hoc test.
Fig. 7.
Fig. 7.
FST overexpression reduces BMD and induces tibia fractures. (A) Representative images of 10-wk-old mice. The boxed region is magnified to display fractured tibia in F66 mice, which is pointed by a red arrow. (B) Representative DXA images of 10-wk-old mice, and microCT images of F66 mouse’s fractured tibia in the boxed region. The cross sectional image at the position indicated by yellow dashed line is shown in the Bottom panel. (C) DXA analysis of 10-wk-old mice (n = 5 for WT mice, n = 5 for Mstn−/− mice, and n = 8 for F66 mice). (D) Representative microCT images of 10-wk-old mouse tibia. Fractured tibias of F66 mice were excluded from microCT analysis. Tb. bones are colored in orange and Ct. bones (1 mm in height) are colored in yellow. Raw cross sectional images of the colored middle and distal diaphysis are displayed in the Bottom panel. (E) Histomorphometric analysis of Ct. bones of 10-wk-old mice (n = 5 each). (F) Representative microCT images of 10-wk-old mouse distal hindlimbs cross sectioned at the level where tibia and fibula start to fuse. The red dotted lines mark muscle boundaries. C. bones are colored in yellow. (G) Representative microCT images of 10-wk-old mouse vertebrae (L1). Tb. bone of the vertebral body is colored in orange. (H) Histomorphometric analysis of L1 Tb. bone in 10-wk-old mice (n = 5 each). (I) A model for regulation of skeletal muscle and bone mass by FST. FST enhances skeletal muscle mass by inhibiting MSTN, while decreasing BMD by blocking GDF11. All scale bars are displayed with actual size values. All data represent mean ± SEM. *P < 0.05, **P < 0.01, and ***P < 0.001 by ANOVA with Tukey’s post hoc test.

References

    1. McPherron A. C., Lawler A. M., Lee S. J., Regulation of skeletal muscle mass in mice by a new TGF-beta superfamily member. Nature 387, 83–90 (1997). - PubMed
    1. McPherron A. C., Lawler A. M., Lee S. J., Regulation of anterior/posterior patterning of the axial skeleton by growth/differentiation factor 11. Nat. Genet. 22, 260–264 (1999). - PubMed
    1. Andersson O., Reissmann E., Ibáñez C. F., Growth differentiation factor 11 signals through the transforming growth factor-beta receptor ALK5 to regionalize the anterior-posterior axis. EMBO Rep. 7, 831–837 (2006). - PMC - PubMed
    1. Rebbapragada A., Benchabane H., Wrana J. L., Celeste A. J., Attisano L., Myostatin signals through a transforming growth factor beta-like signaling pathway to block adipogenesis. Mol. Cell. Biol. 23, 7230–7242 (2003). - PMC - PubMed
    1. Lee S. J., McPherron A. C., Regulation of myostatin activity and muscle growth. Proc. Natl. Acad. Sci. U.S.A. 98, 9306–9311 (2001). - PMC - PubMed

Publication types

MeSH terms

LinkOut - more resources