. 2020 Mar 3;117(9):4781-4791.
doi: 10.1073/pnas.1912656117. Epub 2020 Feb 18.

Spatial mapping of tissue properties in vivo reveals a 3D stiffness gradient in the mouse limb bud

Affiliations

Spatial mapping of tissue properties in vivo reveals a 3D stiffness gradient in the mouse limb bud

Min Zhu et al. Proc Natl Acad Sci U S A. .

Abstract

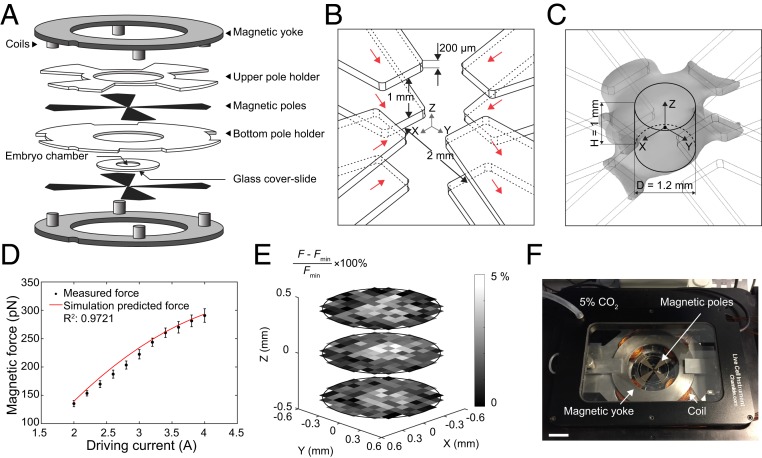
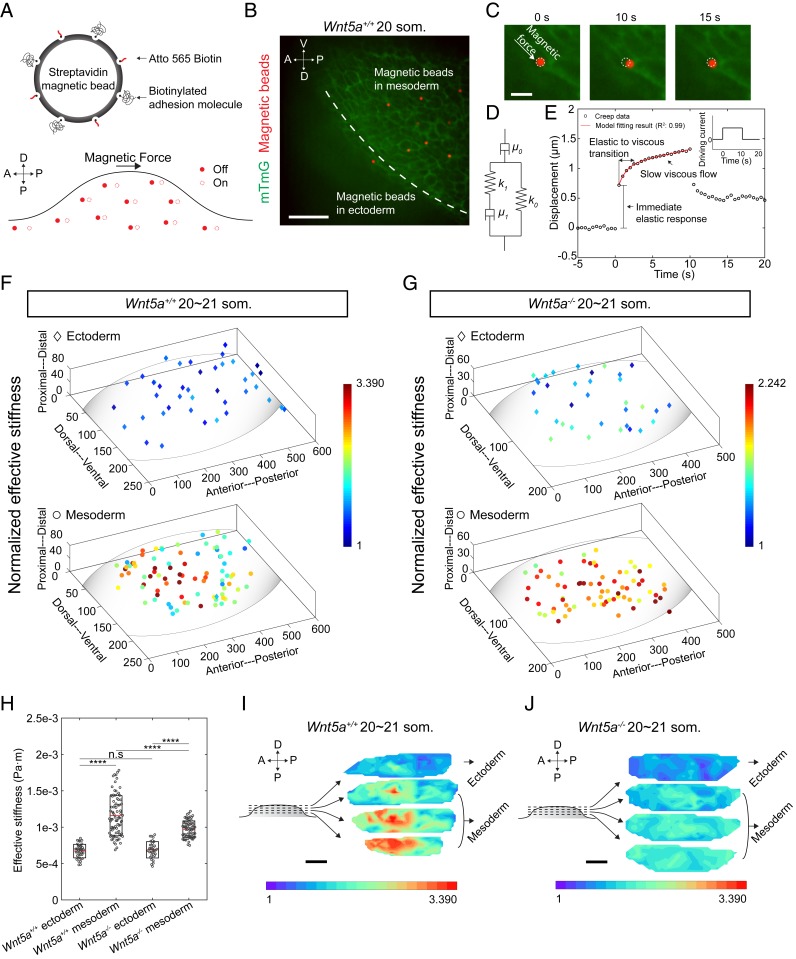
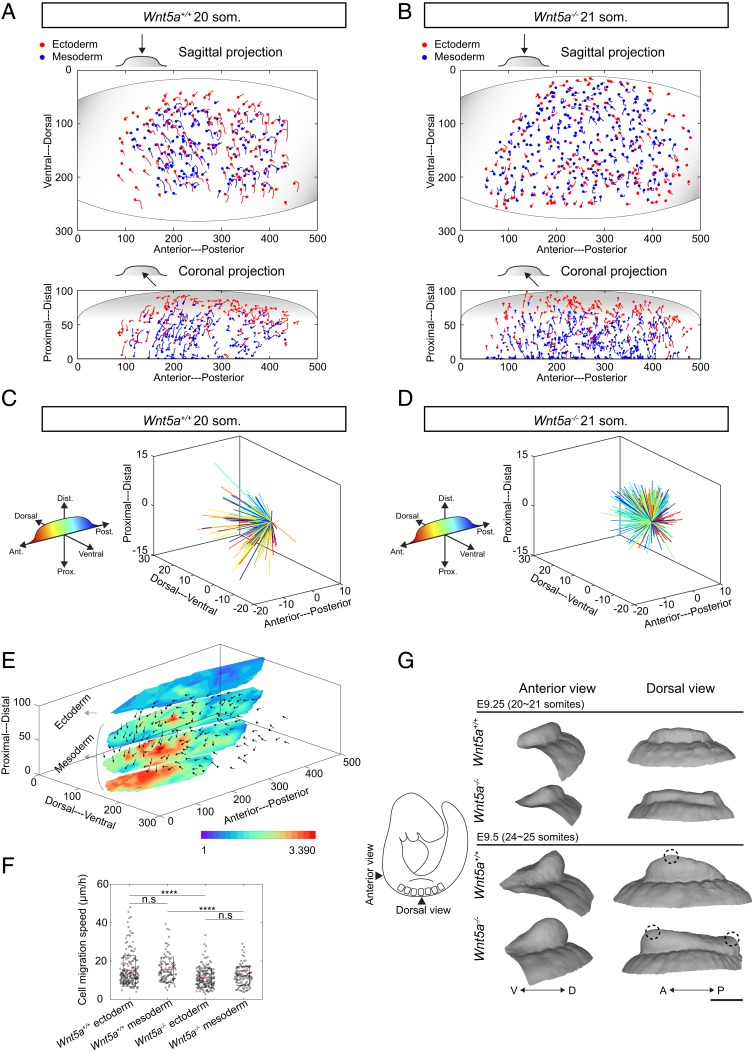
Numerous hypotheses invoke tissue stiffness as a key parameter that regulates morphogenesis and disease progression. However, current methods are insufficient to test hypotheses that concern physical properties deep in living tissues. Here we introduce, validate, and apply a magnetic device that generates a uniform magnetic field gradient within a space that is sufficient to accommodate an organ-stage mouse embryo under live conditions. The method allows rapid, nontoxic measurement of the three-dimensional (3D) spatial distribution of viscoelastic properties within mesenchyme and epithelia. Using the device, we identify an anteriorly biased mesodermal stiffness gradient along which cells move to shape the early limb bud. The stiffness gradient corresponds to a Wnt5a-dependent domain of fibronectin expression, raising the possibility that durotaxis underlies cell movements. Three-dimensional stiffness mapping enables the generation of hypotheses and potentially the rigorous testing of mechanisms of development and disease.

Keywords: cell movements; durotaxis; limb bud; morphogenesis; tissue stiffness.


Conflict of interest statement

The authors declare no competing interest.

Figures

Fig. 1.
Fig. 1.
Three-dimensional magnetic tweezer system. (A) Structures of the device. (B) Configuration of magnetic poles. Red arrow indicates magnetic flux direction along each pole. (C) Gray space shows the uniform magnetic field gradient (3% error) predicted by simulation. The volume in which the magnetic field gradient is uniform is approximated as a column (diameter: 1.2 mm, height: 1 mm). (D) Magnetic force-driving current calibration result. Red line shows simulated force prediction. Error bars represent SD. (E) Calibrated force error in three different planes (0.4-mm interval) within the workspace. Each grid represents an 100- × 100-µm area. (F) Experimental setup of the magnetic device on a spinning-disk confocal stage with live imaging chamber. (Scale bar: 2 cm.)
Fig. 2.
Fig. 2.
Three-dimensional tissue stiffness mapping using magnetic device. (A) Schematic describing magnetic bead functionalization and actuation during tissue stiffness mapping. (B) A representative image showing multiple magnetic beads within tissue. The beads were deposited by stepwise microinjection. (C) Higher-magnification views of bead displacement during one actuation cycle. (D) Sketch of the Zener model with a serial dashpot diagram characterized by viscous (μ0 and μ1) and elastic components (k0 and k1). (E) Representative bead displacement of one actuation cycle characterized by an immediate elastic response followed by a slow viscous flow. Red line shows the model fitting result. (Inset) The driving current during actuation. (F and G) Stiffness maps of 20∼21 som. stage WT (n = 5 embryos) and Wnt5a−/− (n = 4 embryos) limb buds. (H) Absolute effective stiffness values of data shown in F and G (two-tailed t test, ****P < 0.0001) n.s, not significant. (I and J) Three-dimensional rendering of the stiffness maps in F and G. For comparison, normalization was performed against lower boundary ectodermal values which were similar in both conditions. (Scale bars: 50 µm in B, 10 µm in C, and 100 µm in I and J.)
Fig. 3.
Fig. 3.
Collective cell migration contributes to early limb bud shape change. (A and B) Three-dimensional cell movement trajectories (projected in sagittal and coronal planes) within 20∼21 som. stage WT and Wnt5a−/− limb buds tracked by light sheet live imaging (unit: micrometers, duration: 2 h). Each dot denotes the last time point of tracking. (C and D) Three-dimensional dandelion plot of spatially color-coded trajectories of mesodermal cells at the start and end of 20∼21 som. stage WT and Wnt5a−/− limb buds (unit: micrometers, duration: 2 h). WT mesodermal cells move anteroproximally while the Wnt5a−/− mesodermal cell migration pattern has no directional bias. (E) The 20∼21 som. stage WT 3D cell movement pattern (unit: micrometers, duration: 2 h) overlaid with the tissue’s stiffness map. (F) Cell migration speeds within 20∼21 som. WT and Wnt5a−/− limb buds (two-tailed t test, ****P < 0.0001, n = 3 embryos for each condition). n.s, not significant. (G) Limb bud shape change from 20 to 25 som. stage reconstructed from optical projection tomography. Dashed circles indicate the location of distally based peaks of the limb buds. (Scale bar: 200 µm.)
Fig. 4.
Fig. 4.
Fibronectin expression domain spatially mirrors the stiffness gradient within the limb bud. (A and B) Transverse and coronal sections of 20 som. WT (A) and Wnt5a−/− (B) embryos at forelimb anterior and posterior regions. Sections were stained with DAPI (cyan) and antifibronectin antibody (green). Arrows indicate the anteriorly biased region of early fibronectin expression. nt: neural tube; me: mesoderm; ec: ectoderm. (Scale bars: 100 µm.) (C) Relative fibronectin fluorescence intensity of 20 to 21 som. WT (n = 3) and Wnt5a−/− (n = 3) embryos (two-tailed t test, *P < 0.05, **P < 0.01). n.s, not significant. (D) Schematic model representing Wnt5a up-regulation of fibronectin to generate a stiffness gradient which guides mesodermal cell movements and drives limb bud shape change. (E) Graphical description of the potential mechanism by which the stiffness gradient is localized. Error bars indicate SEM.

References

    1. Lau K., et al. , Anisotropic stress orients remodelling of mammalian limb bud ectoderm. Nat. Cell Biol. 17, 569–579 (2015). - PMC - PubMed
    1. Yu J. C., Fernandez-Gonzalez R., Local mechanical forces promote polarized junctional assembly and axis elongation in Drosophila. eLife 5, e10757 (2016). - PMC - PubMed
    1. Rauzi M., Verant P., Lecuit T., Lenne P. F., Nature and anisotropy of cortical forces orienting Drosophila tissue morphogenesis. Nat. Cell Biol. 10, 1401–1410 (2008). - PubMed
    1. Hopyan S., Biophysical regulation of early limb bud morphogenesis. Dev. Biol. 429, 429–433 (2017). - PubMed
    1. Wyngaarden L. A., et al. , Oriented cell motility and division underlie early limb bud morphogenesis. Development 137, 2551–2558 (2010). - PMC - PubMed

Publication types

Grants and funding

LinkOut - more resources