. 2020 Feb 18;11(1):931.
doi: 10.1038/s41467-020-14642-0.

Heterogeneity of response to immune checkpoint blockade in hypermutated experimental gliomas

Affiliations

Heterogeneity of response to immune checkpoint blockade in hypermutated experimental gliomas

Katrin Aslan et al. Nat Commun. .

Abstract

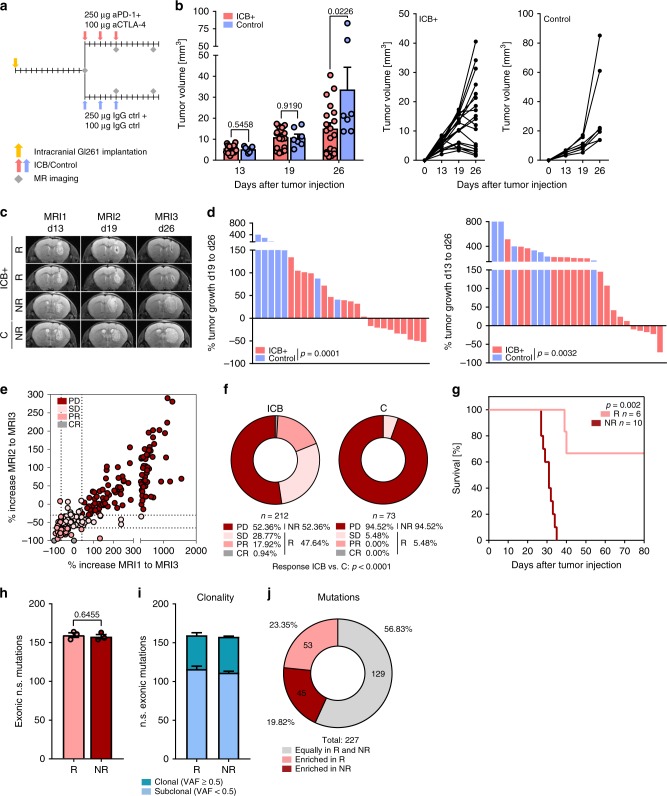
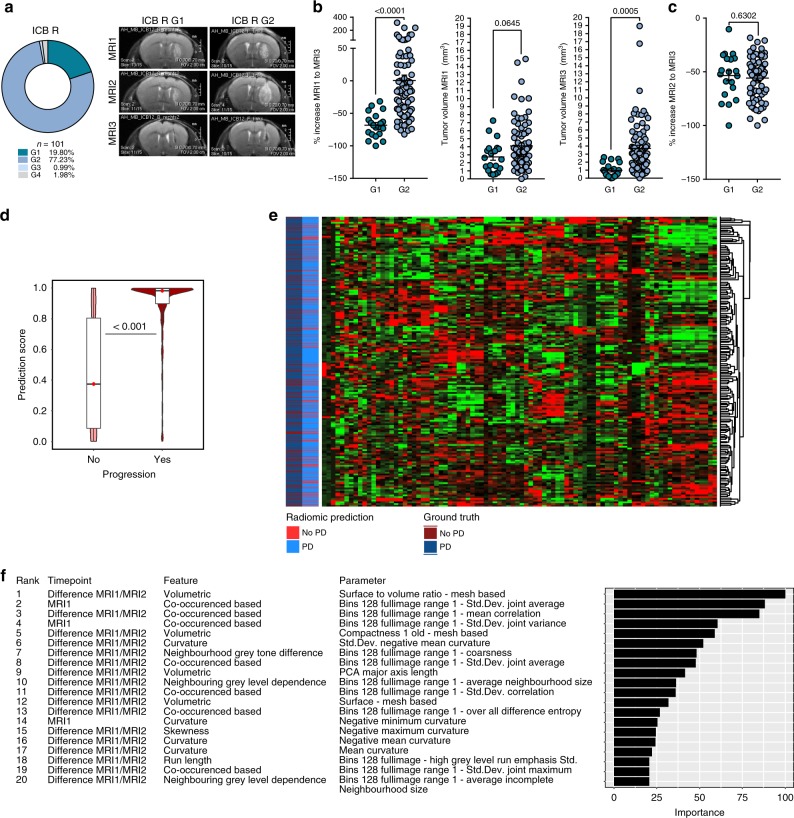
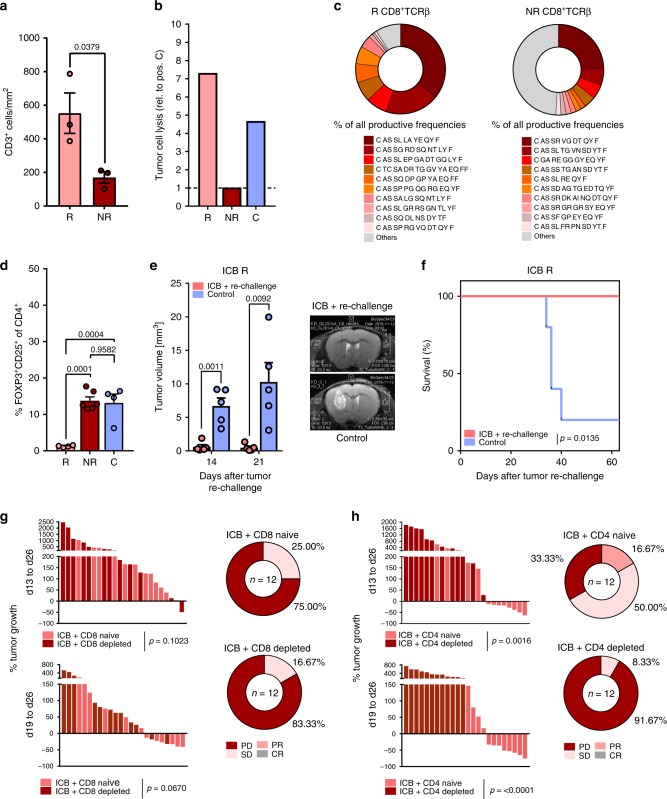
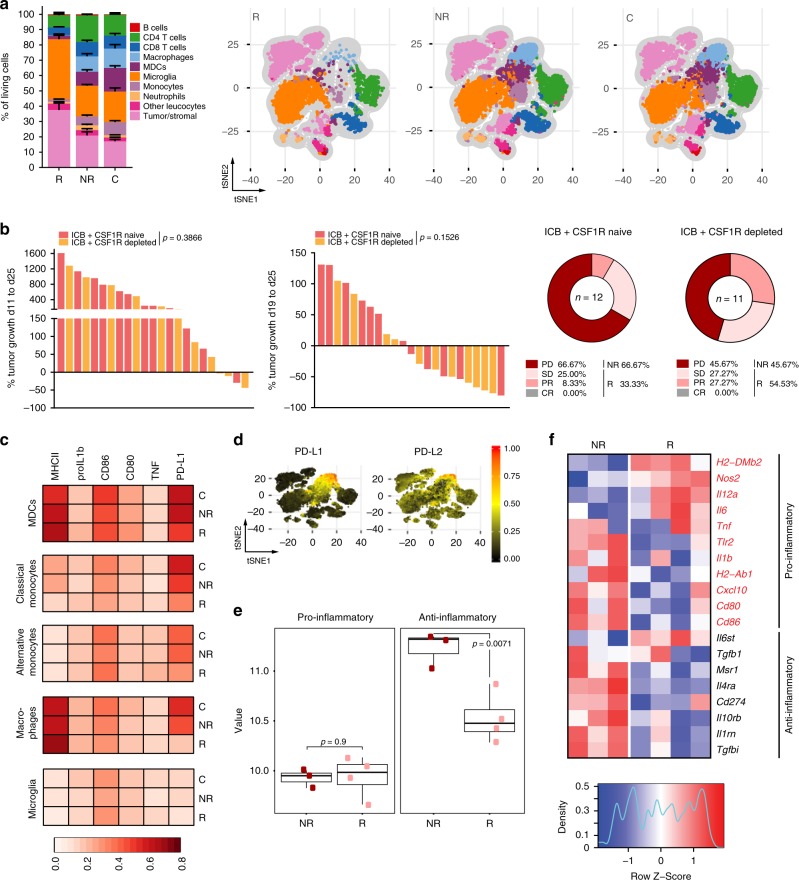
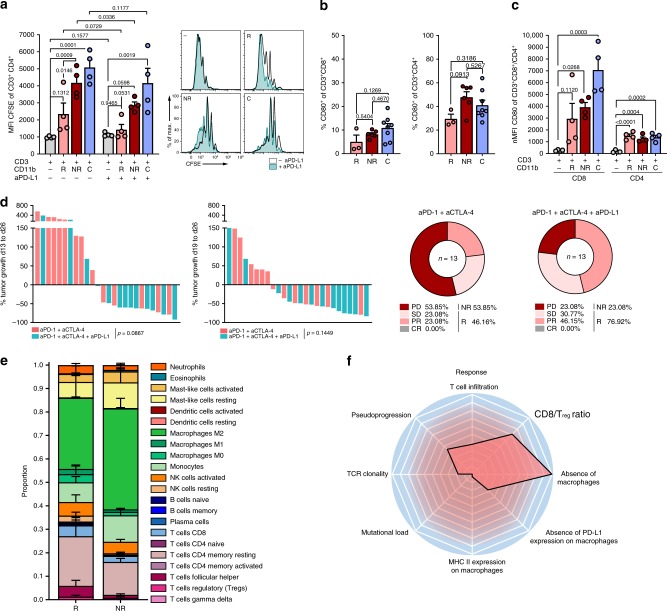
Intrinsic malignant brain tumors, such as glioblastomas are frequently resistant to immune checkpoint blockade (ICB) with few hypermutated glioblastomas showing response. Modeling patient-individual resistance is challenging due to the lack of predictive biomarkers and limited accessibility of tissue for serial biopsies. Here, we investigate resistance mechanisms to anti-PD-1 and anti-CTLA-4 therapy in syngeneic hypermutated experimental gliomas and show a clear dichotomy and acquired immune heterogeneity in ICB-responder and non-responder tumors. We made use of this dichotomy to establish a radiomic signature predicting tumor regression after pseudoprogression induced by ICB therapy based on serial magnetic resonance imaging. We provide evidence that macrophage-driven ICB resistance is established by CD4 T cell suppression and Treg expansion in the tumor microenvironment via the PD-L1/PD-1/CD80 axis. These findings uncover an unexpected heterogeneity of response to ICB in strictly syngeneic tumors and provide a rationale for targeting PD-L1-expressing tumor-associated macrophages to overcome resistance to ICB.


Conflict of interest statement

The authors declare no competing interests.

Figures

Fig. 1
Fig. 1. PD-1 and CTLA-4 blockade decreases Gl261 tumor growth in ICB R mice.
ad C57Bl/6 J mice were treated with 250 µg anti-PD-1 and 100 µg anti-CTLA-4 (ICB+) or isotype control (C) on d13, d16, and d19. Tumor growth was monitored by MRI on d13 (MRI1), d19 (MRI2), and d26 (MRI3) post intracranial Gl261 injection (n = 19 vs. n = 7 animals). b, c Tumor growth and representative MR images of ICB+responder (R), non-responder (NR), and control-treated (C) mice. d Response assessed by % of tumor growth between d19 and d26, and between d13 and d26 post tumor inoculation. e, f Advanced response evaluation was performed on an extended dataset (ICB n = 212 vs. C n = 73 animals). Mice were grouped according to their response pattern with complete response (CR): %VMRI3–MRI1 −100 %, partial response (PR): % VMRI3-MRI1 ≤ −65.0 % or % VMRI3-MRI2 ≤ −65.0 %, sfig disease (SD): %VMRI3–MRI1 > −65.0% and < + 40.0% or %VMRI3–MRI1 ≥ + 40.0% and %VMRI3–MRI2 ≤ −30% and progressive disease (PD): %VMRI3–MRI1 ≥ + 40.0%. e Relative increase in lesion volume MRI1–MRI3 (%VMRI3–MRI1) vs. relative increase in lesion volume MRI2–MRI3 (%VMRI3–MRI2). f Response pattern of ICB and C mice. g Survival of ICB R and ICB NR mice (n = 6 vs. n = 10 animals). Data of two independent experiments were pooled. h Tumors of ICB R and ICB NR mice were excised on d26 post tumor inoculation and exonic non-synonymous (n.s.) mutational load was assessed by exome sequencing (n = 3 vs. n = 3 animals). i, j Clonality of mutations in ICB R and ICB NR tumors i and mutations predominantly enriched in ICB R or ICB NR tumors, VAF, variant allele frequency. j Data are represented as mean ± SEM for b, h and i. Statistical significance was determined by two-tailed Student’s t-test for b, d and h, Fisher’s exact test for f or log-rank Mantel–Cox test for g. Source data are provided as a Source Data file.
Fig. 2
Fig. 2. Radiomic prediction of therapy response to ICB therapy.
ac C57Bl/6 J mice were treated with 250 µg anti-PD-1 and 100 µg anti-CTLA-4 (ICB+) and tumor growth, therapy response and pseudoprogression were evaluated by MRI before (MRI1), during (MRI2), and after ICB therapy (MRI3). a Growth pattern analysis of ICB R (n = 101 animals). G1: %VMRI2–MRI1 < 0% and %VMRI3–MRI2 < 0%; G2: %VMRI2–MRI1 > 0% and %VMRI3–MRI2 < 0%; G3: %VMRI2–MRI1 > 0% and %VMRI3–MRI2 > 0%; and G4: %VMRI2–MRI1 < 0% and %VMRI3–MRI2 > 0%. b %VMRI3–MRI1 (left), VMRI1 (baseline tumor volume; middle), and VMRI3 (final tumor volume; right) of ICB R mice with growth pattern G1 and G2 (G1 n = 20 vs. G2 n = 78 animals). c %VMRI3–MRI2 of ICB R mice with growth pattern G1 and G2 (G1 n = 20 vs. G2 n = 78 animals). df Radiomic response prediction after ICB therapy based on radiomic features of MRI1 (baseline) and MRI2 (during ICB therapy) images (n = 148 animals). Boxplot with blocks showing the interquartile range (IQR) of data points and horizontal central line (red dot) corresponding to the median. The superimposed violin plot visualizes the distribution of the data and its probability density. Radiomic signature score d, heatmap of radiomic features e, and top predictive radiomic features f of R and NR tumors based on radiomic features of MRI1 and MRI2. Data are presented as mean ± SEM for b and c. Statistical significance was determined by two-tailed Student’s t-test for bd. Source data are provided as a Source Data file.
Fig. 3
Fig. 3. Impaired antitumor T cell immunity in ICB NR tumors.
C57Bl/6 J mice were treated with 250 µg anti-PD-1 and 100 µg anti-CTLA-4 (ICB + ), or isotype control (C) on d13, d16, and d19 and tumor monitoring was performed on d13, d19, and d26 post tumor inoculation. a CD3+ cell counts per mm² tumor area assessed by immunohistochemistry (ICB R n = 3, ICB NR n = 3 animals). b CD3+ TILs were isolated by MACS from ICB R, ICB NR, and C tumors on d27 and incubated for 4 h with Gl261 cells ex vivo. Cytotoxicity was analyzed by LDH release relative to positive lysis control (ratio). Five samples per group were pooled. Values are corrected for spontaneous effector and target cell LDH release. c Representative ICB R and ICB NR CD8+ TCRβ TIL repertoire and % of ten most frequent sequences. d Flow cytometry for frequency of CD25+FOXP3+ Tregs of CD4+ TILs (ICB R n = 4, ICB NR n = 6, C n = 4 animals). e, f C57BL/6 J mice were treated with ICB on d14, d17, and d20 after Gl261 injection and tumors were measured on d14, d21, d29, d42, and d50. Gl261 rechallenge of ICB R was performed on d57 after first tumor injection. Tumor volumes on d14 and d21 after rechallenge e and survival f of Gl261 rechallenged ICB R and control-injected mice (n = 5 vs. n = 5 animals). g, h CD8+ or CD4+ T cells were depleted prior and during ICB using monoclonal depletion antibodies (4 × 500 µg 2.43 or 2 × 1000 µg GK1.5). g ICB response in CD8+-depleted or naive mice (ICB + CD8 naive n = 13, ICB + CD8 depl. n = 13 animals) and h in CD4 depleted or naive mice (ICB + CD4 naive n = 12, ICB + CD4 depl. n = 12 animals). Data are represented as mean ± SEM for a, d and e. Statistical significance was determined by one-way ANOVA with Tukey’s test for d, two-tailed Student’s t-test for a, e, g and h or log-rank Mantel–Cox test for f. Source data are provided as a Source Data file.
Fig. 4
Fig. 4. Enhanced frequencies of PD-L1-expressing macrophages in ICB NR tumors.
C57Bl/6 J mice were treated with 250 µg anti-PD-1 and 100 µg anti-CTLA-4 (ICB + ), or isotype control (C) on d13, d16, and d19 and tumors were monitored by MRI on d13, d19, and d26 post Gl261 injection. a Multiparameter flow cytometry analysis of CNS samples from ICB R, ICB NR, and C on d27. (ICB R n = 5, ICB NR n = 5, C n = 5 animals). tSNE-guided immune cell subset identification using tSNE composite dimensions by multiparameter flow cytometry analysis. Relative frequencies (left) and FlowSOM-guided meta-clustering on living and single cells (right) of ICB R, NR, and C CNS tissue. b CSF1R was targeted prior and during ICB therapy using monoclonal antibodies (AFS98; 6 × 250 µg). Response to ICB therapy in CSF1R-targeted and control mice (ICB + n = 12, ICB + CSF1R depleted n = 11 animals). c Multiparameter flow cytometry analysis of CNS samples from ICB R, ICB NR, and C mice on d27. (ICB R n = 5, ICB NR n = 5, C n = 5 animals). Heatmaps showing the median expression (value range 0–1, white–red) of pro- and anti-inflammatory markers in MDCs, classical monocytes, alternative monocytes, macrophages, and microglia clusters in ICB R, NR, and C CNS tissue. d PD-L1 and PD-L2 expression on identified CNS subsets from stochastically selected cells from ICB R, ICB NR, and C CNS tissue. e, f Pro- and anti-inflammatory gene signature score (geometric mean of pro- and anti-inflammatory genes) e and gene expression of pro- and anti-inflammatory genes f in tumor-associated CD45highCD11b+ cells (macrophages) from ICB R and ICB NR assessed by NanoString analysis (ICB R n = 4, ICB NR n = 3 animals). Center line of the boxplot shows the mean and the whiskers represent the upper and lower most quartiles. Data are represented as mean ± SEM for a. Statistical significance was determined by two-tailed Student’s t-test for b and e. Source data are provided as a Source Data file.
Fig. 5
Fig. 5. TAMs establish ICB resistance through PD-L1-CD80-mediated CD4+ T cell suppression and Treg expansion.
a, c Ex vivo T cell suppression by tumor-associated myeloid cells. CD11b+ cells were purified from ICB R, ICB NR, and C tumors on d27 by MACS and co-cultured for 72 h with pre-activated naive CD3+ splenocytes with and without 20 µg ml−1 anti-PD-L1 (10 F.9G2; ICB R n = 4, ICB NR n = 4, C n = 4 animals). a CD4+ T cell proliferation after co-culture assessed by CFSE staining. b Frequency of CD80+ cells of CD8+ (left) and CD4+ (right) TILs (ICB R n = 3, ICB NR n = 6, C n = 8 animals). c CD80 expression on pre-activated naive CD4+ and CD8+ T cells before and after co-culture with tumor-associated myeloid cells from ICB R, ICB NR, and C. d Tumor growth (left) and response (right) of C57BL/6 J mice treated with 250 µg anti-PD-1 and 100 µg anti-CTLA-4, and as combinatory therapy with additional 200 µg anti-PD-L1 on d13, d16, and d19 post Gl261 inoculation (aPD-1 + aCTLA-4 n = 13, aPD-1 + aCTLA-4 + aPD-L1 n = 13 animals). e CIBERSORT analysis of a GBM expression dataset of PD-1 inhibitor-treated patients before therapy (R n = 4, NR n = 5 biologically independent samples)—two-sided WRST. f Mediators of ICB response (Z-transformed log2 fold change R/NR). Data are represented as mean ± SEM for a, b, c and e. For a, statistical significance was determined by one-way ANOVA in combination with Dunnett’s test (CD3+ cells + R, NR, or C CD11b+ cells vs. T cells only) and Sidak’s test for multiple comparison (CD3+ cells + R CD11b+ cells vs. CD3+ cells + NR CD11b+ cells) or two-tailed paired Student’s t-test (− PD-L1 vs. + PD-L1). Statistical significance was analyzed by one-way ANOVA with Tukey’s test for multiple comparison for b, by one-way ANOVA in combination with Dunnett’s test (CD3+ cells + R, NR, or C CD11b+ cells vs. T cells only) for c, by unpaired two-tailed Student’s t-test for d, and WRST with Benjamini–Hochberg correction for e. Source data are provided as a Source Data file.

References

    1. Pardoll DM. The blockade of immune checkpoints in cancer immunotherapy. Nat. Rev. Cancer. 2012;12:252–264. doi: 10.1038/nrc3239. - DOI - PMC - PubMed
    1. Larkin J, et al. Combined nivolumab and ipilimumab or monotherapy in untreated melanoma. N. Engl. J. Med. 2015;373:23–34. doi: 10.1056/NEJMoa1504030. - DOI - PMC - PubMed
    1. Gettinger S, et al. Nivolumab monotherapy for first-line treatment of advanced non–small-cell lung cancer. J. Clin. Oncol. 2016;34:2980–2987. doi: 10.1200/JCO.2016.66.9929. - DOI - PMC - PubMed
    1. Goldberg SB, et al. Pembrolizumab for patients with melanoma or non-small-cell lung cancer and untreated brain metastases: early analysis of a non-randomised, open-label, phase 2 trial. Lancet Oncol. 2016;17:976–983. doi: 10.1016/S1470-2045(16)30053-5. - DOI - PMC - PubMed
    1. Tawbi HA, et al. Combined nivolumab and ipilimumab in melanoma metastatic to the brain. N. Engl. J. Med. 2018;379:722–730. doi: 10.1056/NEJMoa1805453. - DOI - PMC - PubMed

Publication types

MeSH terms