. 2020 Feb 18;11(1):941.
doi: 10.1038/s41467-020-14788-x.

Pyridoxine induces glutathione synthesis via PKM2-mediated Nrf2 transactivation and confers neuroprotection

Affiliations

Pyridoxine induces glutathione synthesis via PKM2-mediated Nrf2 transactivation and confers neuroprotection

Yao Wei et al. Nat Commun. .

Abstract

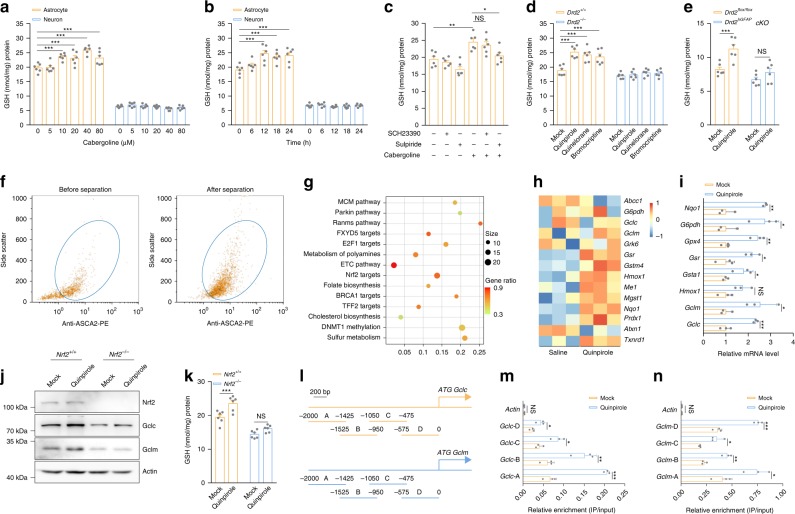
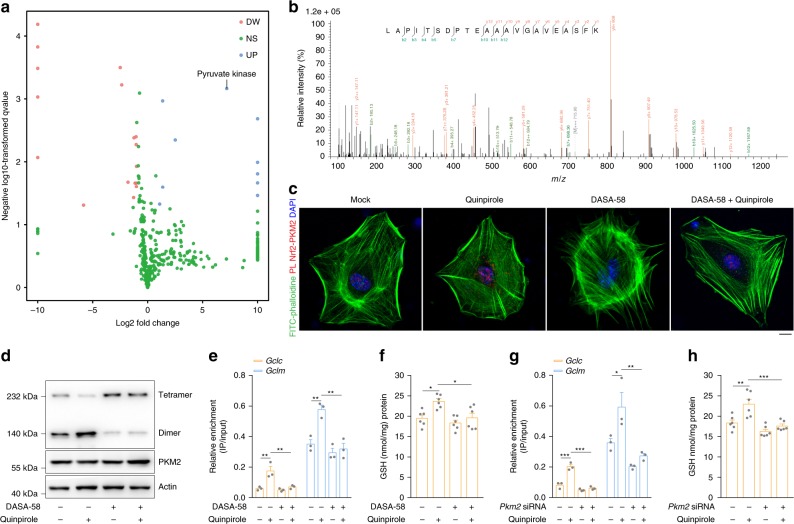
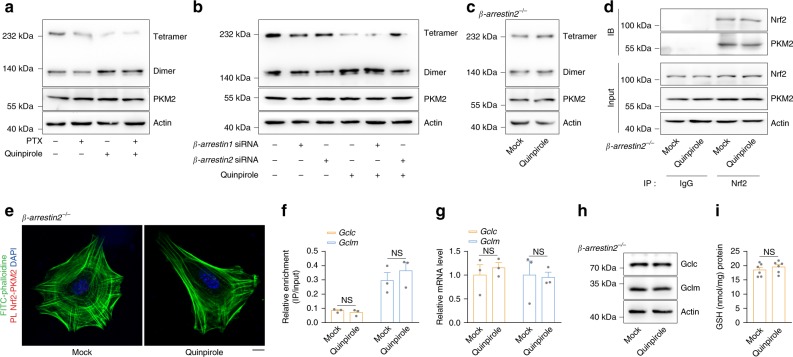
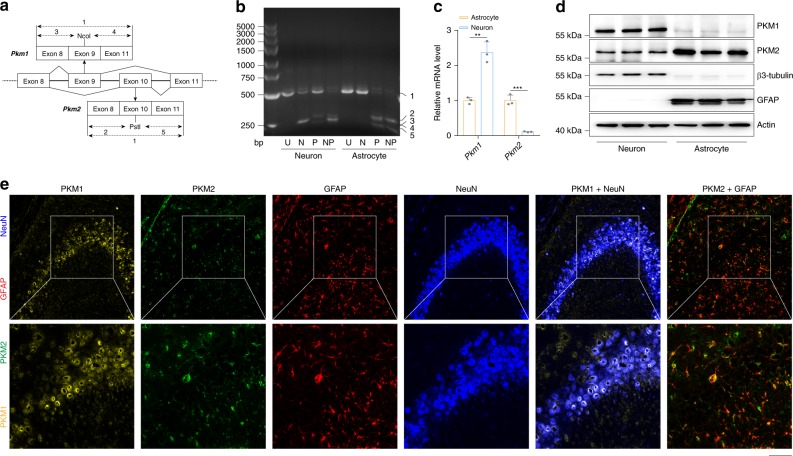
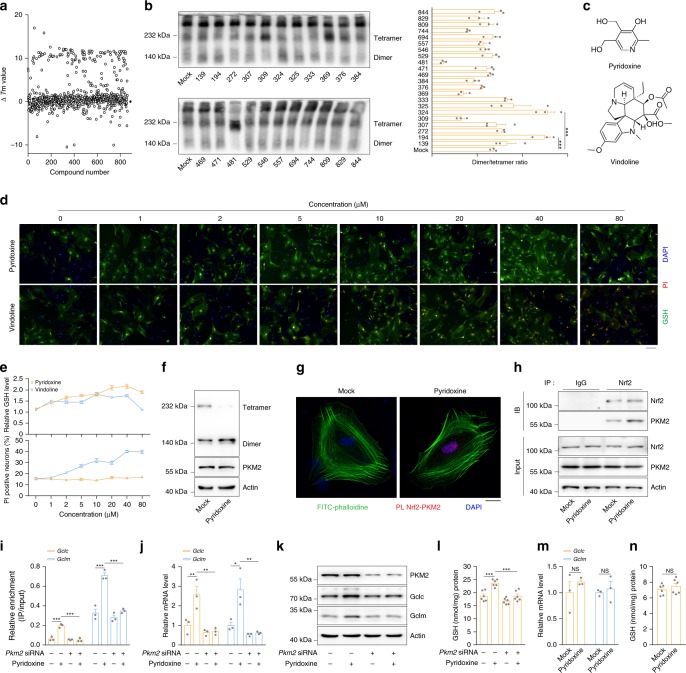
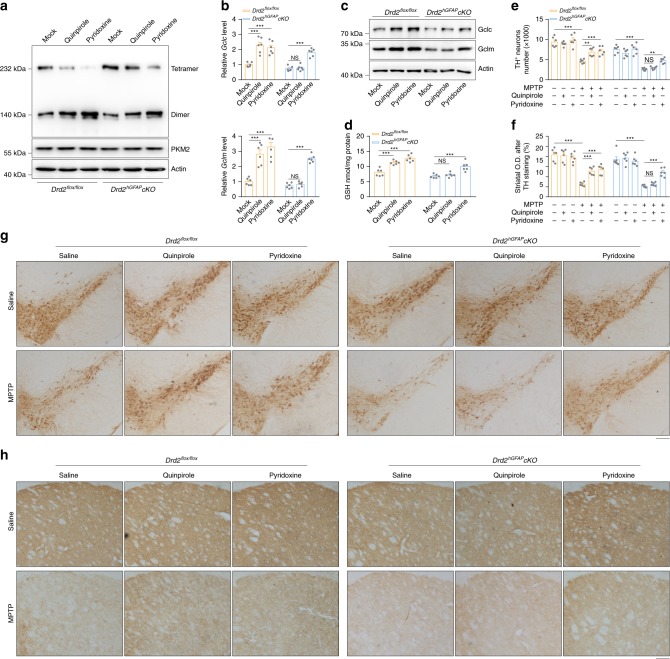
Oxidative stress is a major pathogenic mechanism in Parkinson's disease (PD). As an important cellular antioxidant, glutathione (GSH) balances the production and incorporation of free radicals to protect neurons from oxidative damage. GSH level is decreased in the brains of PD patients. Hence, clarifying the molecular mechanism of GSH deficiency may help deepen our knowledge of PD pathogenesis. Here we report that the astrocytic dopamine D2 receptor (DRD2) regulates GSH synthesis via PKM2-mediated Nrf2 transactivation. In addition we find that pyridoxine can dimerize PKM2 to promote GSH biosynthesis. Further experiments show that pyridoxine supplementation increases the resistance of nigral dopaminergic neurons to 1-methyl-4-phenyl-1,2,3,6-tetrahydropyridine (MPTP)-induced neurotoxicity in wild-type mice as well as in astrocytic Drd2 conditional knockout mice. We conclude that dimerizing PKM2 may be a potential target for PD treatment.


Conflict of interest statement

The authors declare no competing interests.

Figures

Fig. 1
Fig. 1. Astrocytic DRD2 facilitates GSH synthesis via Nrf2 activation.
a GSH levels in astrocytes and neurons after treatment with 0, 5, 10, 20, 40, or 80 µM cabergoline for 24 h. b GSH levels in astrocytes and neurons after treatment with 10 µM cabergoline for 6, 12, 18, or 24 h. c GSH levels in astrocytes treated with 10 μM cabergoline for 12 h after pretreatment with SCH23390 (10 μM) or sulpiride (10 μM). d GSH levels in astrocytes from wild-type mice or Drd2-knockout mice after quinpirole (10 μM), quinelorane (20 μM), or bromocriptine (40 μM) treatment for 12 h. Six independent experiments per condition in ad. e Striatal GSH levels in Drd2flox/flox mice and Drd2hGFAPcKO mice after 5 mg kg−1 quinpirole administration for 7 days. n = 6 mice per group. f Representative dot plots of ACSA-2 labeling of astrocytes (gated in blue circles) collected after microbead kit separation. g, h Gene set enrichment analysis of upregulated pathways (g) and heat map of the expression of Nrf2 targets (h) identified by RNA sequencing in astrocytes from mice after quinpirole administration. i Astrocytes were treated with 10 μM quinpirole, and Nrf2 target expression was determined by qRT-PCR. Three independent experiments per condition. j, k Immunoblotting with actin as a loading control (j) and GSH levels (k) in wild-type and Nrf2-null astrocytes after 10 μM quinpirole treatment. Immunoblotting: three independent experiments; GSH assay: six independent experiments. l Diagram of the Gclc and Gclm promoters showing the locations of the different fragments tested. The numbers indicate the base pairs upstream of the transcriptional start site. m, n ChIP assays showing enrichment of the Gclc (m) and Gclm (n) promoters in DNA isolated from astrocytes treated with 10 μM quinpirole and precipitated with anti-Nrf2 antibodies. Three independent experiments per condition. Data are presented as the mean ± s.e.m. *P < 0.05, **P < 0.01, ***P < 0.001, NS, not significant. One-way ANOVA with Tukey’s multiple comparisons test (c), two-way ANOVA with Dunnett’s multiple comparisons test (a, b and d) or with Sidak’s multiple comparisons test (e, k), Student’s two-tailed unpaired t-test (i, m and n). Source data are provided as a Source Data file.
Fig. 2
Fig. 2. DRD2 induces PKM2 dimerization to bind with and activate Nrf2.
a Volcano plot of label-free mass spectrometry-quantified proteins that bound Nrf2 with a significant fold change after DRD2 activation. Only proteins identified in at least two or three replicates with a fold change > 2.0 and a p-value < 0.05 were regarded significantly changed. b Representative fragmentation spectrum of 401LAPITSDPTEATAVGAVEASFK422 in PKM2. cf Primary astrocytes were pretreated with 50 µM DASA-58 for 1 h and then stimulated with 10 µM quinpirole for 12 h. PKM2 and Nrf2 proximity ligation signals (c). PKM2 dimer and tetramer formation analyzed by BN-PAGE and total PKM2 detected by immunoblotting with actin as a loading control (d). The amount of anti-Nrf2-immunoprecipitated DNA detected by qRT-PCR with primers flanking the Gclc and Gclm promoter regions (e) and GSH levels (f). Immunoblotting and qRT-PCR: three independent experiments; GSH assay: six independent experiments. Scale bar, 10 µm. g, h Primary astrocytes transfected with Pkm2-specific siRNA were stimulated with 10 µM quinpirole for 12 h. The amount of anti-Nrf2-immunoprecipitated DNA detected by qRT-PCR with primers flanking the Gclc and Gclm promoter regions (g) and GSH levels (h). qRT-PCR: three independent experiments; GSH assay: six independent experiments. Data are presented as the mean ± s.e.m. *P < 0.05, **P < 0.01, ***P < 0.001. One-way ANOVA with Tukey’s multiple comparisons test (eh). Source data are provided as a Source Data file.
Fig. 3
Fig. 3. DRD2 activation triggers β-arrestin2 to bind and dimerize PKM2.
a The PKM2 dimer and tetramer formation in primary astrocytes pretreated with 100 ng ml−1 PTX for 20 min and then stimulated with 10 µM quinpirole for 12 h was analyzed by BN-PAGE, and total PKM2 was detected by immunoblotting with actin as a loading control. Three independent experiments per condition. b Primary astrocytes transfected with β-arrestin1- or β-arrestin2-specific siRNA were stimulated with 10 µM quinpirole for 12 h. PKM2 dimer and tetramer formation analyzed by BN-PAGE and total PKM2 detected by immunoblotting with actin as a loading control. Three independent experiments per condition. ci Primary astrocytes from β-arrestin2-knockout mice were stimulated with 10 µM quinpirole for 12 h. PKM2 dimer and tetramer formation analyzed by BN-PAGE and total PKM2 detected by immunoblotting with actin as a loading control (c). Immunoblot analysis of PKM2 in cell lysates immunoprecipitated with a Nrf2 antibody (d). PKM2 and Nrf2 proximity ligation signals (e). Amount of anti-Nrf2-immunoprecipitated DNA detected by qRT-PCR with primers flanking the Gclc and Gclm promoter regions (f). Gclc and Gclm mRNA detected by qRT-PCR (g). Immunoblotting with actin as a loading control (h) and GSH levels (i). Immunoblotting and qRT-PCR: three independent experiments; GSH assay: six independent experiments. Scale bar, 10 µm. Data are presented as the mean ± s.e.m. NS, not significant. Student’s two-tailed unpaired t-test (f, g and i). Source data are provided as a Source Data file.
Fig. 4
Fig. 4. Divergent expression patterns of PKM in neurons and astrocytes.
a Primers annealing to exons 8 and 11 were used to amplify PKM transcripts. The PCR products were cleaved with Ncol, Pstl or both to distinguish between the PKM1 (including exon 9) and PKM2 (including exon 10) isoforms. b RNA from primary neurons and astrocytes was analyzed by qRT-PCR, followed by digestion with Ncol (N), Pstl (P), or both enzymes (NP), plus an uncut control (U). The numbered bands are as follows: 1: uncut M1 or M2 (502 bp); 2: Pstl-cleaved M2 5’ fragment (286 bp); 3: Ncol-cleaved M1 5’ fragment (245 bp); 4: Ncol-cleaved M1 3’ fragment (240 bp); and 5: Pstl-cleaved M2 3’ fragment (216 bp). c Pkm1 and Pkm2 mRNA detected by qRT-PCR in primary neurons and astrocytes. d Immunoblotting with actin as a loading control. e PKM1 and PKM2 immunohistochemical signals in cortical neurons and astrocytes after tyramide signal amplification. Immunoblotting and qRT-PCR: three independent experiments. Scale bar, 50 µm. Data are presented as the mean ± s.e.m. ***P < 0.001. Student’s two-tailed unpaired t-test (c). Source data are provided as a Source Data file.
Fig. 5
Fig. 5. Pyridoxine facilitates GSH synthesis via the PKM2-Nrf2 pathway.
a, b Purified recombinant PKM2 (rPKM2) was mixed with 863 natural products individually. ▵Tm values analyzed by NanoDSF (a). rPKM2 dimer and tetramer formation analyzed by BN-PAGE (left) and densitometric analysis of the dimer/tetramer ratio (right) (b). c Chemical structures of compound no. 194 (vindoline) and no. 324 (pyridoxine). d, e Primary astrocytes were stimulated with different concentrations of pyridoxine or vindoline for 12 h. Immunofluorescence of GSH and PI analyzed by high-content screening (d). The relative intensity of GSH signals (upper) and the percentage of PI-positive nuclei (lower) (e). Scale bar, 100 µm. fh Primary astrocytes were stimulated with 5 µM pyridoxine for 12 h. PKM2 dimer and tetramer formation analyzed by BN-PAGE and total PKM2 detected by immunoblotting with actin as a loading control (f). PKM2 and Nrf2 proximity ligation signals (g). Immunoblot analysis of PKM2 in cell lysates immunoprecipitated with a Nrf2 antibody (h). Immunoblotting: three independent experiments. Scale bar, 10 µm. il Primary astrocytes transfected with Pkm2-specific siRNA were stimulated with 5 µM pyridoxine for 12 h. The amount of anti-Nrf2-immunoprecipitated DNA analyzed by qRT-PCR with primers flanking the Gclc and Gclm promoter regions (i). Gclc and Gclm mRNA detected by qRT-PCR (j). Immunoblotting with actin as a loading control (k) and GSH levels (l). Immunoblotting and qRT-PCR: three independent experiments; GSH assay: six independent experiments. m, n Primary neurons were stimulated with 5 µM pyridoxine for 12 h. Gclc and Gclm mRNA detected by qRT-PCR (m) and GSH levels (n). qRT-PCR: three independent experiments; GSH assay: six independent experiments. Data are presented as the mean ± s.e.m. *P < 0.05, **P < 0.01, ***P < 0.001, NS, not significant. One-way ANOVA with Dunnett’s multiple comparisons test (b) or with Tukey’s multiple comparisons test (i, j and l). Student’s two-tailed unpaired t-test (m, n). Source data are provided as a Source Data file.
Fig. 6
Fig. 6. Pyridoxine reduces dopaminergic neuron loss in the PD mouse model.
ad Drd2flox/flox and Drd2hGFAPcKO mice were sacrificed after continuous infusion of 5 mg kg−1 quinpirole or 5 mg kg−1 pyridoxine for 7 consecutive days, and the striatum was dissected for further analysis. PKM2 dimer and tetramer formation analyzed by BN-PAGE and total PKM2 detected by immunoblotting with actin as a loading control (a). Gclc and Gclm mRNA detected by qRT-PCR (b). Immunoblotting with actin as a loading control (c) and GSH levels (d). Immunoblotting and qRT-PCR: three independent experiments; GSH assay: six independent experiments. eh Drd2flox/flox and Drd2hGFAPcKO mice were used to generate an MPTP-induced PD mouse model (20 mg kg−1 i.h., 5 d), which was treated by continuous infusion of quinpirole (5 mg kg−1 i.p.) or pyridoxine (5 mg kg−1 i.p.). Quantification of TH+ neurons (e). Striatal optical density (O.D.) measurements of TH-stained slices (f). Immunohistochemical staining of TH+ neurons (g). Immunohistochemical staining of TH in the nigrostriatal system (h). n = 6 mice per group. Scale bar, 200 µm. Data are presented as the mean ± s.e.m. **P < 0.01, ***P < 0.001, NS, not significant. Two-way ANOVA with Dunnett’s multiple comparisons test (b, d) or with Tukey’s multiple comparisons test (e, f). Source data are provided as a Source Data file.

References

    1. Przedborski S. The two-century journey of Parkinson disease research. Nat. Rev. Neurosci. 2017;18:251–259. doi: 10.1038/nrn.2017.25. - DOI - PubMed
    1. Dawson TM, Dawson VL. Molecular pathways of neurodegeneration in Parkinson’s disease. Science. 2003;302:819–822. doi: 10.1126/science.1087753. - DOI - PubMed
    1. Alam ZI, et al. Oxidative DNA damage in the parkinsonian brain: an apparent selective increase in 8-hydroxyguanine levels in substantia nigra. J. Neurochem. 1997;69:1196–1203. doi: 10.1046/j.1471-4159.1997.69031196.x. - DOI - PubMed
    1. Dexter DT, et al. Basal lipid peroxidation in substantia nigra is increased in Parkinson’s disease. J. Neurochem. 1989;52:381–389. doi: 10.1111/j.1471-4159.1989.tb09133.x. - DOI - PubMed
    1. Alam ZI, et al. A generalised increase in protein carbonyls in the brain in Parkinson’s but not incidental Lewy body disease. J. Neurochem. 1997;69:1326–1329. doi: 10.1046/j.1471-4159.1997.69031326.x. - DOI - PubMed

Publication types

MeSH terms