. 2020 Feb 18;11(1):855.
doi: 10.1038/s41467-020-14676-4.

Gut microbiota mediates intermittent-fasting alleviation of diabetes-induced cognitive impairment

Affiliations

Gut microbiota mediates intermittent-fasting alleviation of diabetes-induced cognitive impairment

Zhigang Liu et al. Nat Commun. .

Abstract

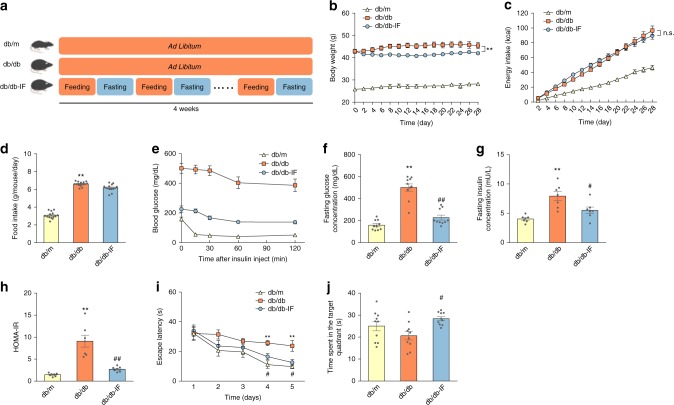
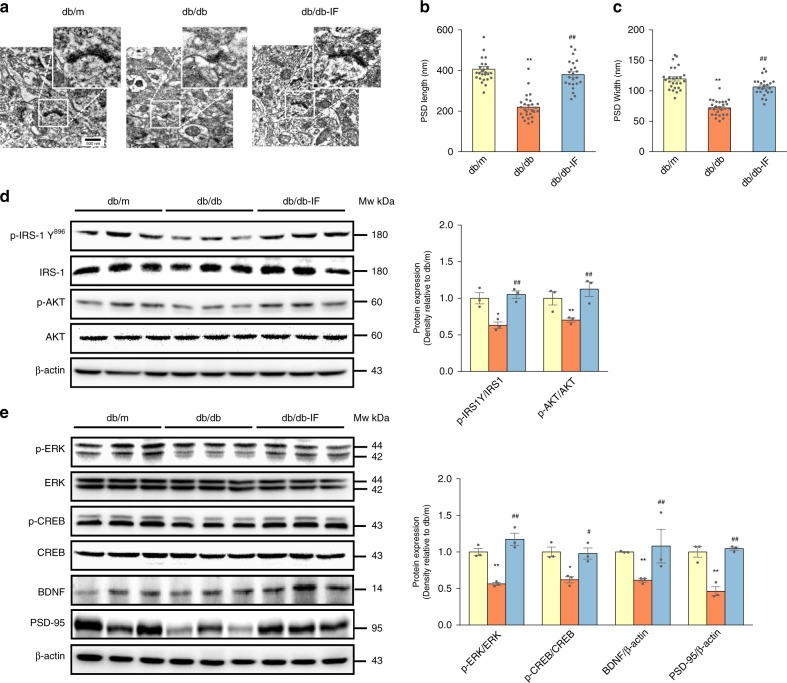
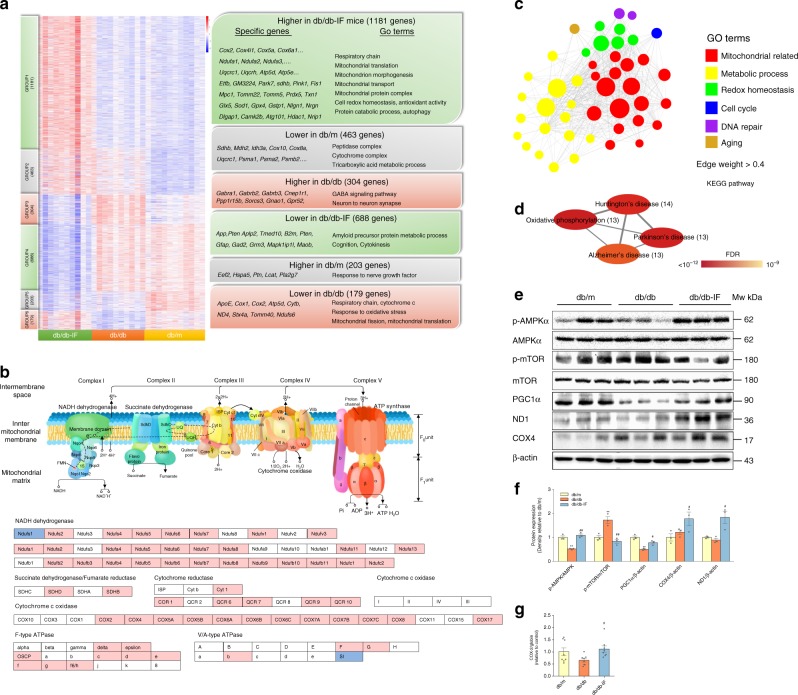
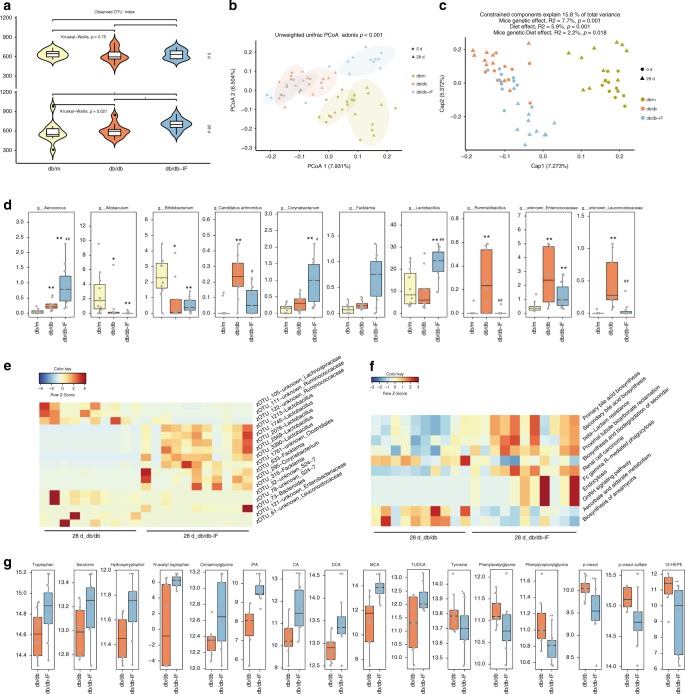
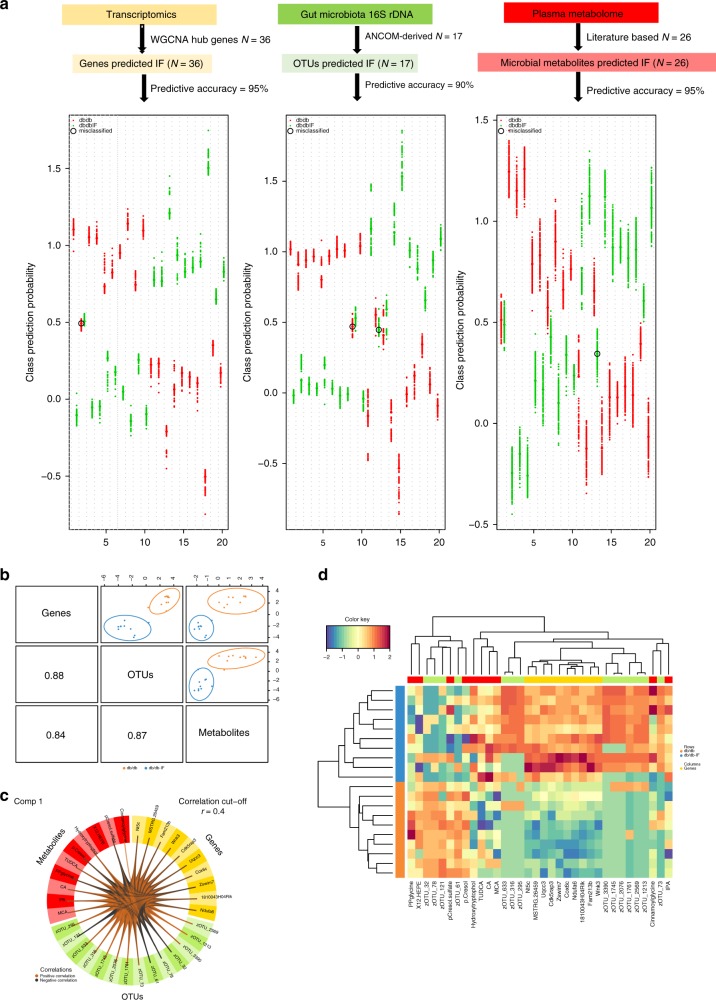
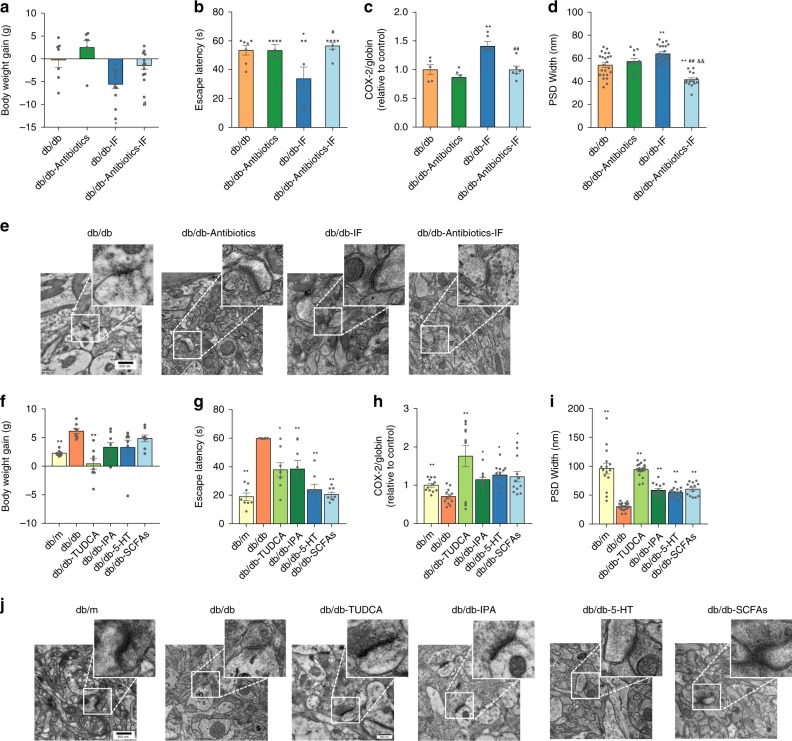
Cognitive decline is one of the complications of type 2 diabetes (T2D). Intermittent fasting (IF) is a promising dietary intervention for alleviating T2D symptoms, but its protective effect on diabetes-driven cognitive dysfunction remains elusive. Here, we find that a 28-day IF regimen for diabetic mice improves behavioral impairment via a microbiota-metabolites-brain axis: IF enhances mitochondrial biogenesis and energy metabolism gene expression in hippocampus, re-structures the gut microbiota, and improves microbial metabolites that are related to cognitive function. Moreover, strong connections are observed between IF affected genes, microbiota and metabolites, as assessed by integrative modelling. Removing gut microbiota with antibiotics partly abolishes the neuroprotective effects of IF. Administration of 3-indolepropionic acid, serotonin, short chain fatty acids or tauroursodeoxycholic acid shows a similar effect to IF in terms of improving cognitive function. Together, our study purports the microbiota-metabolites-brain axis as a mechanism that can enable therapeutic strategies against metabolism-implicated cognitive pathophysiologies.


Conflict of interest statement

The authors declare no competing interests.

Figures

Fig. 1
Fig. 1. Intermittent fasting alleviated insulin resistance and cognitive impairment in db/db mice.
a Timeline depicting the diet of IF or ad libitum in each group; b bodyweight (n = 10 mice per group); c energy intake; d food intake; e insulin-tolerance test; f fasting glucose; g fasting insulin level (n = 7 mice per group); h HOMA-IR (n = 7 mice per group). The animals’ cognitive functions were assessed by the Morris water-maze test as described in “Methods” (n = 10 mice per group); i escape latency (s), and j the time spent in the target quadrant (s) during the probe trial were recorded. Data presented as mean ± SEM. *p < 0.05, **p < 0.01, compared with db/m group, #p < 0.05, ##p < 0.01 compared with the db/db group. Significant differences between mean values were determined by one-way ANOVA with Tukey’s multiple comparisons test. See also Supplementary Fig. 1. Source data are provided as a Source Data file.
Fig. 2
Fig. 2. Intermittent fasting improved synapse ultrastructure and altered IRS/Akt and CREB/ERK signaling in db/db mice brain.
a Representative images of ultrastructure of synapse. b, c The length and width of PSD (n = 6 slices per group). d, e Western blots analysis of hippocampal IRS/Akt and CREB/ERK related signaling (n = 3 mice per group). Data presented as mean ± SEM. *p < 0.05, **p < 0.01, compared with db/m group, #p < 0.05, ##p < 0.01 compared with the db/db group. Significant differences between mean values were determined by one-way ANOVA with Tukey’s multiple comparisons test. See also Supplementary Fig. 2. Source data are provided as a Source Data file.
Fig. 3
Fig. 3. Intermittent fasting improved energy metabolism and mitochondrial biogenesis in the hippocampus.
a Heatmap displaying 2503 differentially expressed genes in the hippocampus among db/m, db/db, and db/db-IF groups (n = 11, 9, 11 mice in each group, respectively) that were clustered into six distinct gene groups through DEG analysis using Ballgown software (FDR-p < 0.05). Enriched GO terms (FDR-p < 0.05) and representative genes are shown on the right for each cluster. The p-values of GO terms were determined on the WebGestalt website; b KEGG of oxidative phosphorylation (FDR-p < 0.05) of group 1 (1181) and group 4 (688) genes based on DEG analysis. Pink represents upregulation during Intermittent fasting. Blue represents downregulation during Intermittent fasting. c Network and GO annotation of 49 brown-module hub genes (upregulated when intermittent fasting, r[ME and gene] > 0.8, r[trait and gene] > 0.85, FDR-p < 0.01) in WGCNA analysis (edge weights > 0.4). The p-values of GO terms were determined on the WebGestalt website; d KEGG analysis (FDR-p < 0.05) of the brown-module hub genes in the WGCNA analysis. The p-values of KEGG analysis were determined on the WebGestalt website; e, f Western blots of mTOR/AMPK/PGC1α signaling (n = 3 mice per group); g mitochondrial DNA levels in brain tissue (n = 8 mice per group). Data of f, g presented as mean ± SEM. *p < 0.05, **p < 0.01, compared with the db/m group, #p < 0.05, ##p < 0.01 compared with the db/db group. Significant differences in d, g between mean values were determined by one-way ANOVA with Tukey’s multiple comparisons test. The boxplot elements are defined as following: center line, median; box limits, upper and lower quartiles; whiskers, 1.5 × interquartile range. See also Supplementary Fig. 3 and Supplementary Data 1–5. Source data are provided as a Source Data file.
Fig. 4
Fig. 4. Gut microbiome and plasma metabolome analysis of intermittent fasting-treated db/db mice.
a Total number of observed OTUs in db/m, db/db, and db/db-IF (n = 11, 10, 11 mice in each group, respectively). Significant differences between day 0 and day 28 were tested by Kruskal-Wallis test. Significant differences between treatment groups were tested by Wilcoxon rank-sum test (*p < 0.05). b Principal coordinate analysis (PCoA) based on unweighted Unifrac distance and permutational manova (adonis) were used to test the difference in gut microbiota composition and diversity between groups (the colored ellipse denotes an 80% confidence within each group. c Constrained analysis of principal coordinate (CAP) of diet and mice gene type was performed on cumulative sum scaling (CSS) normalized Bray Curtis distance after the removing time effect. The permutational ANOVA-like test for constrained respondence analysis (ANOVA.CCA) was applied to examine the influence of diet and mice gene type on the matrix. d Relative abundance of different genera was identified by an analysis of composition of microbiome (ANCOM) on day 28 (FDR-p < 0.05). Wilcoxon rank-sum test was adopted for comparisons between groups (*p < 0.05, **p < 0.01, compared with the db/dm group, #p < 0.05, ##p < 0.01 compared with the db/db group). e A Z-score scaled heatmap of different zOTUs identified by ANCOM between db/db-IF and db/db on day 28 with FDR-p < 0.05. f A Z-score scaled heatmap of different pathways identified by an extraction of differential gene expression (Edge) between db/db-IF and db/db on day 28 with FDR-p < 0.1. g The difference in microbial metabolites in db/db and db/db-IF mice (n = 10 mice per group). Microbial metabolites that were up/downregulated after IF treatment. Differences were examined by Wilcoxon rank-sum test (*p < 0.05, **p < 0.01). IPA 3-indolepropionic acid, CA cholic acid, DCA deoxycholic acid, MCA muricholic acid, TUDCA tauroursodeoxycholic acid, 12-HEPE 12-hydroxyeicosapentaenoic acid. The boxplot elements are defined as following: center line, median; box limits, upper and lower quartiles; whiskers, 1.5 × interquartile range. See also Supplementary Figs. 4–6 and Supplementary Data 6–9. Source data are provided as a Source Data file.
Fig. 5
Fig. 5. Strategy and model performance of the integrative modeling on multi-OMICS in relation to IF treatment.
a The performance of predictive models for three OMICs signatures on IF status. OMICs signatures include: 36 IF-upregulated hub genes from the IF-related brown module that was identified using WGCNA; 17 OTUs that were found to be influenced by IF treatment; 26 priori defined sets of microbial metabolites, including 23 plasma metabolites and 3 SCFAs measured in fecal samples. For each OMICs data set, multivariate predictive modeling was conducted using partial least square-discriminant analysis incorporated into a repeated double cross-validation framework (rdcv-PLS). Prediction performance is shown in downstream figures: each swim lane represents one mice sample. For each sample, class probabilities were computed from 200 double cross-validations. Class probabilities are color coded by class and presented per repetition (smaller dots) and averaged over all repetitions (larger dots). Misclassified samples are circled. Predictive accuracy was calculated as a number of correctly predicted samples/total number of measured samples. b The model performance of DIABLO integrative modeling on OMICs signatures in relation to IF. The use of DIABLO maximized the correlated information between multiple data sets, i.e., genes, OTUs and metabolites, while optimally identifying in a parsimonious set of key OMICs variables relevant for IF status, i.e., ten key predictors from each of OMICs data sets. Scatter plots depicting the clustering of groups, i.e., db/db and db/db-IF, based on the first component of each data set from the model showed a significant separation between groups. A scatterplot displays the first component in each data set (upper diagonal plot) and Pearson correlation between components (lower diagonal plot). c The Circos plot shows the positive (negative) correlation, denoted as brown (gray) lines, between selected multi-OMICs features. d A clustered image map (Euclidean distance, complete linkage) of the multi-OMICs signature. Samples are represented in rows, selected features on the first component in columns. See also Supplementary Fig. 7. Source data are provided as a Source Data file. Detailed procedure and R code are provided in the Supplementary Information.
Fig. 6
Fig. 6. The effects of antibiotics and microbial metabolites on the cognitive functions of IF-treated db/db mice.
The mice were administrated with antibiotics in the drinking water starting 14 days before the 4-week IF regimen and throughout the experiment (the detailed antibiotics treatment is as described in “Methods”). a Bodyweight gain (g) (n = 7 mice and 13 mice in ad libitum feeding and IF regimen groups, respectively). b Escape latency (s) in place navigation test (the 5th day). c Mitochondrial DNA levels in brain tissue (n = 7 mice per group); d width of PSD. e Representative images of ultrastructure of synapse (n = 6 slices per group). Data presented as mean ± SEM. *p < 0.05, **p < 0.01, compared with the db/db group, &p < 0.05, &&p < 0.01, compared with the db/db- antibiotics group, #p < 0.05, ##p < 0.01 compared with the db/db-IF group. Significant differences between mean values were determined by two-way ANOVA (IF regimen and antibiotics treatment as two factors) with Tukey’s multiple comparisons test. The db/db mice were administrated with IPA, 5-HT, TUDCA, or SCFAs, i.e., acetate, butyrate, and propionate, individually (n = 8 mice per group). f Bodyweight gain; g escape latency (s) in place navigation test (the 5th day) (n = 8 mice per group); h mitochondrial DNA levels in brain tissue (n = 8 mice per group); i width of PSD; and j representative images of ultrastructure of synapse (n = 6 slices per group). Data presented as mean ± SEM. *p < 0.05, **p < 0.01 versus the db/db group. Significant differences between mean values were determined by one-way ANOVA with Tukey’s multiple comparisons test. See also Supplementary Figs. 8–11, Supplementary Data 10. Source data are provided as a Source Data file.

References

    1. Atlas I. D. Brussels, Belgium: international diabetes federation; 2013. International Diabetes Federation (IDF), (2017).
    1. Gold S, et al. Hippocampal damage and memory impairments as possible early brain complications of type 2 diabetes. Diabetologia. 2007;50:711–719. - PubMed
    1. Shuko T, et al. Diabetes-accelerated memory dysfunction via cerebrovascular inflammation and Abeta deposition in an Alzheimer mouse model with diabetes. Proc. Natl Acad. Sci. USA. 2010;107:7036–7041. - PMC - PubMed
    1. De Felice FG, Ferreira STJD. Inflammation, defective insulin signaling, and mitochondrial dysfunction as common molecular denominators connecting type 2 diabetes to Alzheimer disease. Diabetes. 2014;63:2262–2272. - PubMed
    1. Carvalho C, Santos MS, Oliveira CR, Moreira PI. Alzheimer’s disease and type 2 diabetes-related alterations in brain mitochondria, autophagy and synaptic markers. Biochim. Biophys. Acta. 2015;1852:1665–1675. - PubMed

Publication types

MeSH terms