. 2020 Feb 18;10(1):2851.
doi: 10.1038/s41598-020-59469-3.

Targeting Oncogenic Super Enhancers in MYC-Dependent AML Using a Small Molecule Activator of NR4A Nuclear Receptors

Affiliations

Targeting Oncogenic Super Enhancers in MYC-Dependent AML Using a Small Molecule Activator of NR4A Nuclear Receptors

S Greg Call et al. Sci Rep. .

Abstract

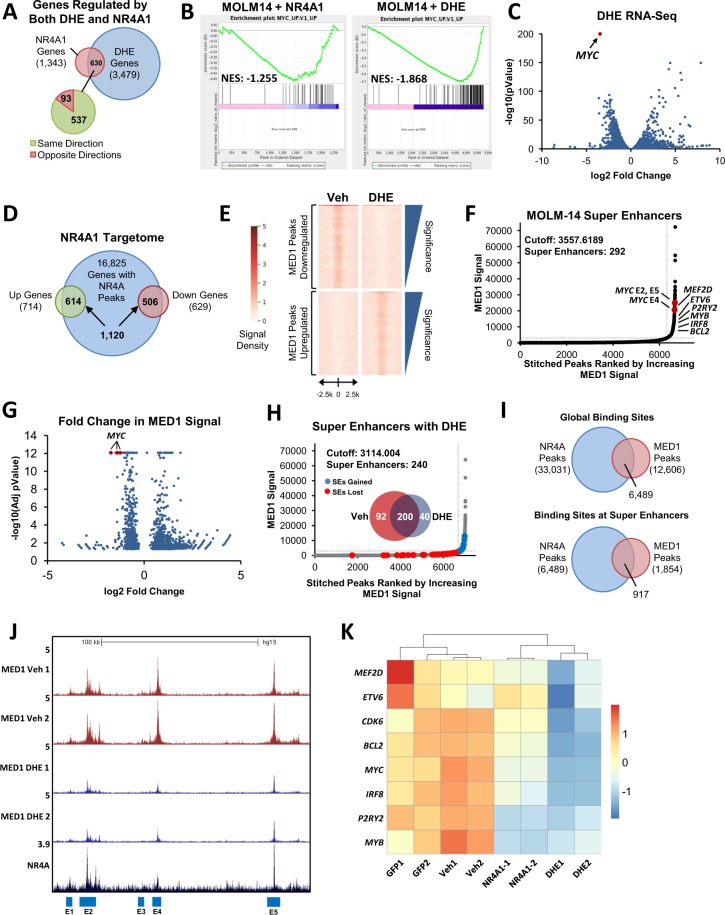
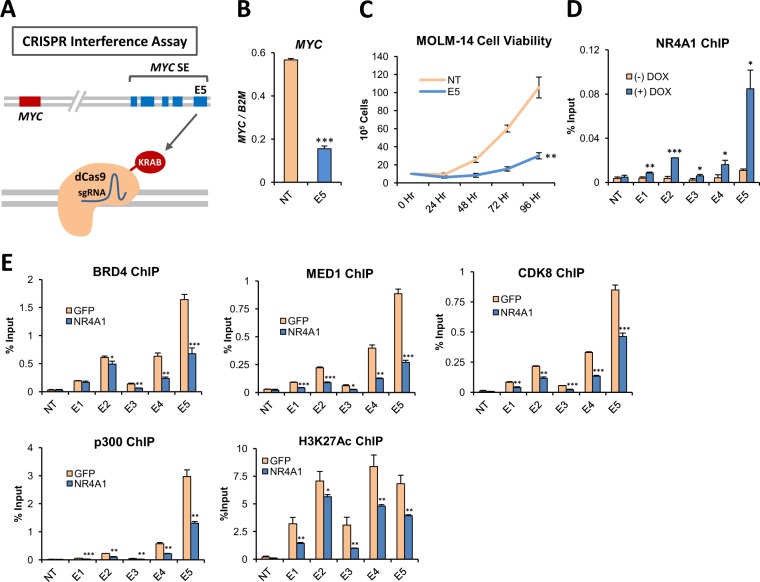
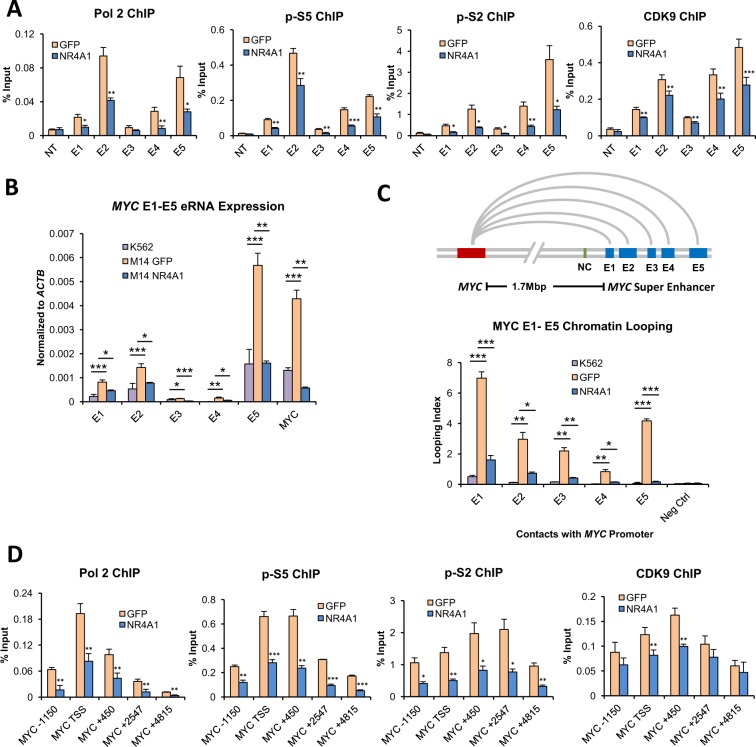
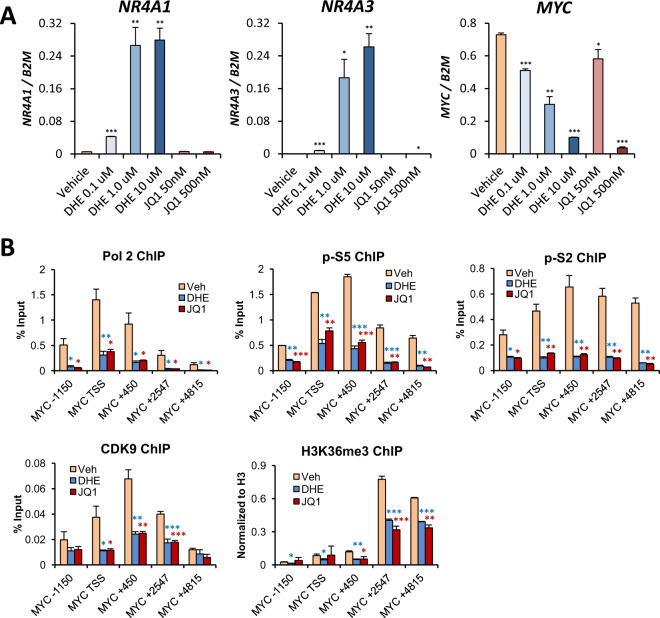
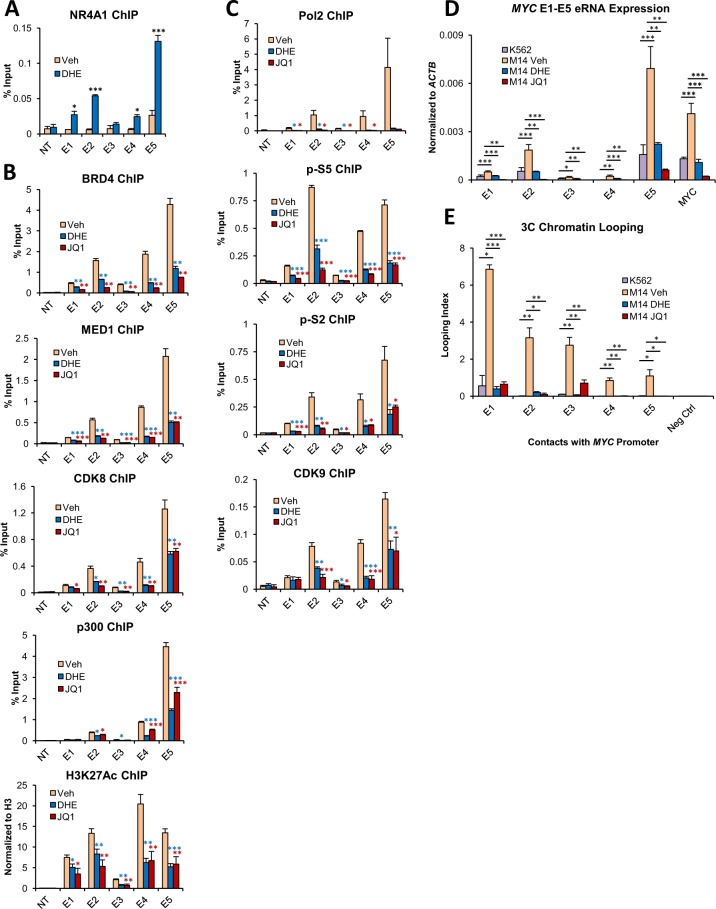
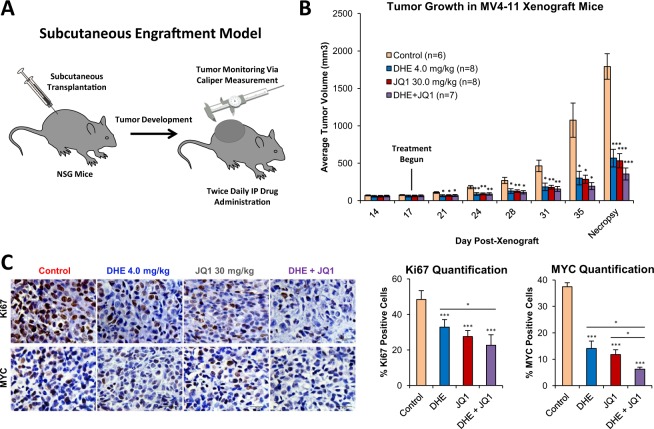
Epigenetic reprogramming in Acute Myeloid Leukemia (AML) leads to the aberrant activation of super enhancer (SE) landscapes that drive the expression of key oncogenes, including the oncogenic MYC pathway. These SEs have been identified as promising therapeutic targets, and have given rise to a new class of drugs, including BET protein inhibitors, which center on targeting SE activity. NR4A nuclear receptors are tumor suppressors of AML that function in part through transcriptional repression of the MYC-driven oncogenic program via mechanisms that remain unclear. Here we show that NR4A1, and the NR4A inducing drug dihydroergotamine (DHE), regulate overlapping gene expression programs in AML and repress transcription of a subset of SE-associated leukemic oncogenes, including MYC. NR4As interact with an AML-selective SE cluster that governs MYC transcription and decommissions its activation status by dismissing essential SE-bound coactivators including BRD4, Mediator and p300, leading to loss of p300-dependent H3K27 acetylation and Pol 2-dependent eRNA transcription. DHE shows similar efficacy to the BET inhibitor JQ1 at repressing SE-dependent MYC expression and AML growth in mouse xenografts. Thus, DHE induction of NR4As provides an alternative strategy to BET inhibitors to target MYC dependencies via suppression of the AML-selective SE governing MYC expression.


Conflict of interest statement

The authors declare no competing interests.

Figures

Figure 1
Figure 1
DHE Regulates Overlapping Target Genes with NR4A1 and Decommissions a Subset of NR4A1-Bound AML Super Enhancers. For analysis of acute changes in gene expression in response to NR4A1 or DHE, MOLM-14 cells were electroporated with GFP control or NR4A1 IVT RNA, or treated with vehicle or 10 uM DHE, and incubated for 6 hours. (A) Venn diagram summarizing gene expression overlap taken from RNA-Seq in MOLM-14 cells with NR4A1 IVT RNA expression or treatment with 10 uM DHE. (B) Gene set enrichment analysis reveals suppression of MYC pathway genes in MOLM-14 cells by NR4A1 or DHE treatment. (C) Volcano plot showing the distribution of genes that are upregulated or downregulated in response to DHE. Arrow points to MYC, which is the most statistically repressed target of DHE. (D) Venn diagram representing the integration of NR4A ChIP-Seq with NR4A1-dependent changes in gene expression assessed by RNA-Seq (NR4A1 targetome). (E) MED1 ChIP-Seq density plots comparing MED1 peaks upregulated (10,992) and downregulated (2,922) in response to DHE treatment as determined by diffReps (fold change cutoff of 2, q-val < 0.25). (F) ROSE analysis summary of MED1 ChIP-Seq identifying 292 super-enhancers in vehicle-treated cells. (G) Volcano plot summarizing fold changes in MED1 peaks in response to DHE. The MYC super enhancers are highlighted in red and are among the most statistically repressed MED1 peaks. (H) Venn diagram and ROSE summary of 240 super enhancers in DHE treated cells, highlighting super enhancers that are gained (blue) versus those that are lost (red). (I) Venn diagram highlighting NR4A ChIP-Seq overlap with MED1 ChIP-Seq occupancy, both on a global scale and selectively at super enhancer regions. (J) UCSC Genome Browser ChIP-Seq screenshot showing suppression of MED1 occupancy at the MYC SE region in response to DHE treatment. NR4A peaks are also displayed to show peak overlap with super enhancers. (K) Heatmap depiction of select SE-associated leukemic genes whose expression is repressed by both NR4A1 and DHE.
Figure 2
Figure 2
NR4A1 Disrupts the Activity of an AML-Selective MYC Super Enhancer by Dismissing Essential Transcriptional Coactivators. (A) Schematic illustrating CRISPR interference strategy involving the use of a guide RNA specific to the E5 enhancer, which targets dCas9-KRAB to disrupt the activation status of the enhancer. (B) RT-qPCR for MYC in MOLM-14 cells transduced with dCas9-KRAB lentivirus containing either a non-targeting (NT) sgRNA cassette, or sgRNA targeting the E5 enhancer. (C) Cell viability measured in MOLM-14 cells transduced with dCas9-KRAB lentivirus targeting NT or E5. (D) ChIP-qPCR for NR4A1 in MOLM-14 with dox-inducible lentiviral NR4A1 expression showing its enrichment across the MYC SE. NT refers to the negative control from a non-transcribed desert region. (E) ChIP-qPCR for BRD4, MED1, CDK8, p300 and H3K27Ac at 3 hours after electroporation with GFP or NR4A1 IVT RNA. Primer pairs were specific for the MYC SE E1-E5, and NT represents a non-transcribed gene desert negative control. ***p < 0.001, **p < 0.01, *p < 0.05 compared to GFP or vehicle controls.
Figure 3
Figure 3
NR4A1 Disrupts Transcriptional Activity and Enhancer-Promoter Looping of the MYC SE. For (AC) MOLM-14 cells were treated with vehicle or 10 uM DHE for 4 hours. (A) ChIP-qPCR for total RNA polymerase II (Pol 2), Pol 2 phospho serine 5 (p-S5), Pol 2 phospho serine 2 (p-S2), and CDK9 using primer pairs specific for the MYC SE E1-E5. (B) RT-qPCR for enhancer RNAs (eRNAs) from the MYC SE E1-E5 as well as MYC mRNA. K562 cells were included as a negative control as they do not express eRNA at E1-E5. (C) 3C chromatin looping demonstrating the frequency of interactions between the MYC SE E1-E5 and the MYC promoter, represented as looping index. K562 cells are included as a non-looping negative control. The green bar in the schematic labeled NC represents a genomic region between the MYC locus and the MYC SE which was used as an additional non-looping negative control. (D) ChIP-qPCR for total RNA polymerase II (Pol 2), Pol 2 phospho serine 5 (p-S5), Pol 2 phospho serine 2 (p-S2), and CDK9 at 3 hours after electroporation with GFP or NR4A1 IVT RNA. ChIP-qPCRs were done using primer pairs that span the MYC locus. ***p < 0.001, **p < 0.01, *p < 0.05 compared to vehicle, GFP or K562 controls.
Figure 4
Figure 4
DHE and JQ1 suppress transcription progression across the MYC locus. (A) Dose responsive expression of NR4A1, NR4A3 and MYC mRNAs using RT-qPCR in MOLM-14 cells treated with specified concentrations of DHE or JQ1 for 6 hours. (B) ChIP-qPCR for total RNA polymerase II (Pol 2), Pol 2 phospho serine 5 (p-S5), Pol 2 phospho serine 2 (p-S2), CDK9, and H3K36me3. ChIP-qPCRs were done using primer pairs that span the MYC locus at 4 hours after treatment with 10 uM DHE or 500 nM JQ1. ***p < 0.001, **p < 0.01, *p < 0.05 compared to vehicle controls.
Figure 5
Figure 5
DHE mimics NR4A-dependent suppression of the MYC SE and displays similar efficacy to BET inhibitor JQ1. MOLM-14 cells were treated with 10 uM DHE or 500 nM JQ1 for 4 hours. (A) ChIP-qPCR for NR4A occupancy at the MYC SE in response to DHE treatment. (B) ChIP-qPCR for BRD4, MED1, CDK8, p300 and H3K27Ac. (C) ChIP-qPCR for total RNA polymerase II (Pol 2), Pol 2 phospho serine 5 (p-S5), Pol 2 phospho serine 2 (p-S2), and CDK9. ChIP-qPCRs for (AC) were done using primer pairs specific for the MYC SE E1-E5 enhancers. NT represents a non-transcribed gene desert negative control. (D) RT-qPCR for enhancer RNAs (eRNAs) from the MYC SE E1-E5 as well as MYC mRNA in MOLM-14 cells. K562 cells are included as a negative control for eRNA expression at the MYC SE. (E) 3C chromatin looping frequency of interactions between the MYC SE E1-E5 and the MYC promoter. K562 cells are included as a non-looping negative control. Also included is a non-looping negative control genomic region between the MYC locus and the MYC SE. ***p < 0.001, **p < 0.01, *p < 0.05 compared to vehicle or K562 controls.
Figure 6
Figure 6
DHE and JQ1 suppress tumor growth and intratumoral MYC expression in a xenograft mouse model of MLL-rearranged AML. (A) Schematic depicting subcutaneous xenograft strategy. (B) 7 week-old NSG mice were transplanted with 1 × 107 MV4–11 cells, and monitored until average tumor volume reached 60 mm3, at which point intraperitoneal injections of vehicle, 4.0 mg/kg DHE, 30 mg/kg JQ1, or the two drugs combined were administered twice daily. Average tumor volume is indicated. (C) Immunohistochemical staining and quantification of proliferative marker Ki67, and MYC in MV4–11 xenograft tumor tissues. ***p < 0.001, **p < 0.01, *p < 0.05 compared to vehicle controls.

References

    1. Bonifer C, Hoogenkamp M, Krysinska H, Tagoh H. How transcription factors program chromatin–lessons from studies of the regulation of myeloid-specific genes. Seminars in immunology. 2008;20:257–263. doi: 10.1016/j.smim.2008.05.001. - DOI - PubMed
    1. Sive JI, Gottgens B. Transcriptional network control of normal and leukaemic haematopoiesis. Experimental cell research. 2014;329:255–264. doi: 10.1016/j.yexcr.2014.06.021. - DOI - PMC - PubMed
    1. Heinz S, Romanoski CE, Benner C, Glass CK. The selection and function of cell type-specific enhancers. Nature reviews. Molecular cell biology. 2015;16:144–154. doi: 10.1038/nrm3949. - DOI - PMC - PubMed
    1. Kuhn MW, et al. High-resolution genomic profiling of adult and pediatric core-binding factor acute myeloid leukemia reveals new recurrent genomic alterations. Blood. 2012;119:e67–75. doi: 10.1182/blood-2011-09-380444. - DOI - PMC - PubMed
    1. Shi J, et al. Role of SWI/SNF in acute leukemia maintenance and enhancer-mediated Myc regulation. Genes & development. 2013;27:2648–2662. doi: 10.1101/gad.232710.113. - DOI - PMC - PubMed

Publication types

MeSH terms