

Co-occurrence patterns of bacteria within microbiome of Moscow subway
- PMID: 32071708
- PMCID: PMC7016200
- DOI: 10.1016/j.csbj.2020.01.007
Co-occurrence patterns of bacteria within microbiome of Moscow subway
Abstract
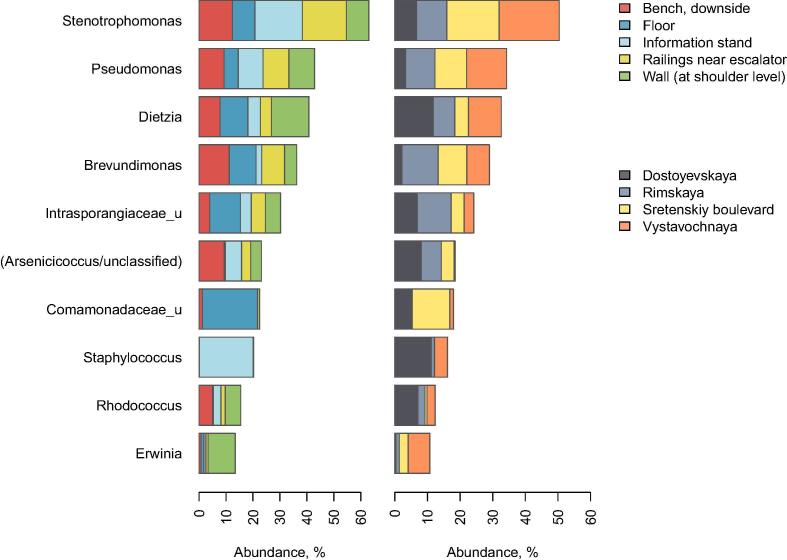
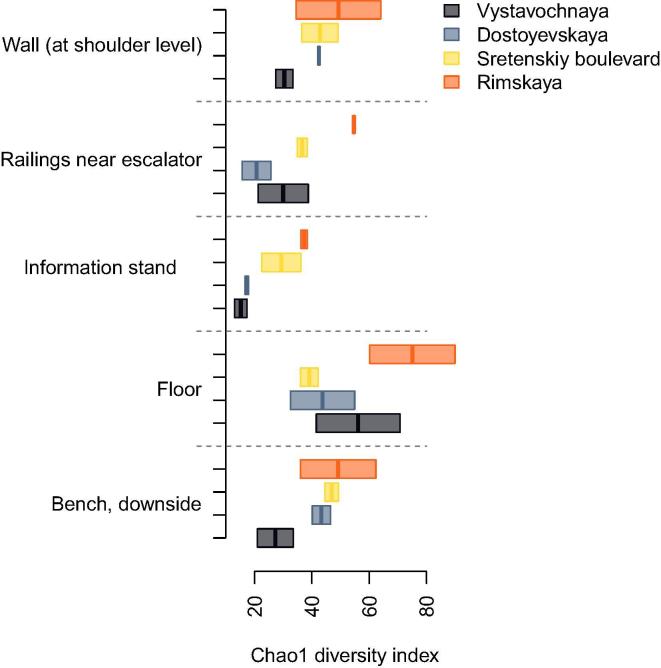
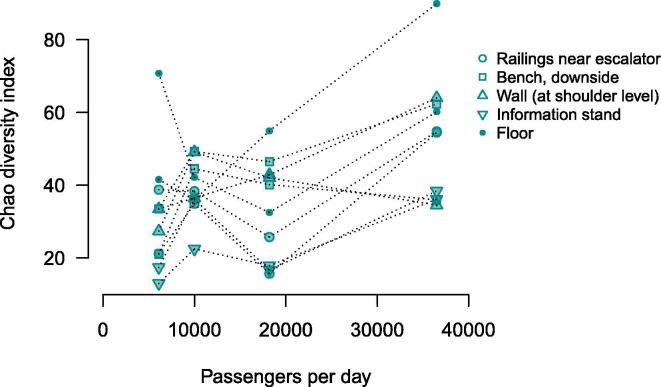
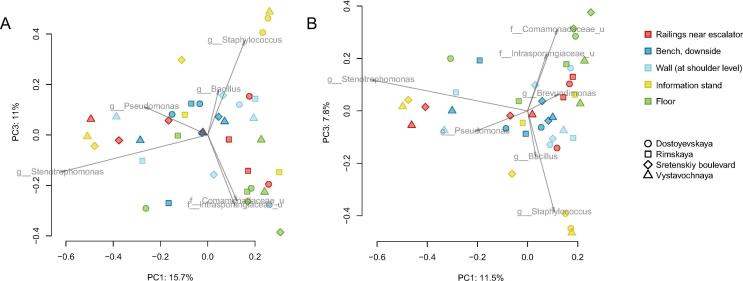
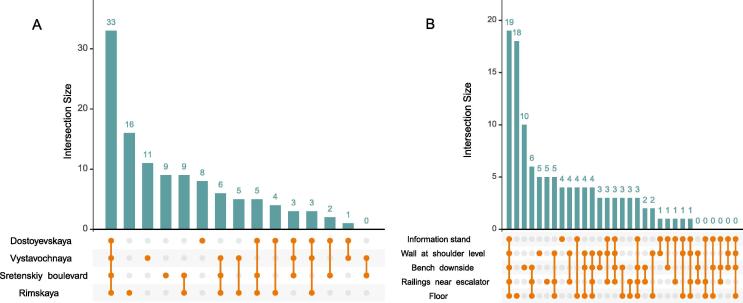
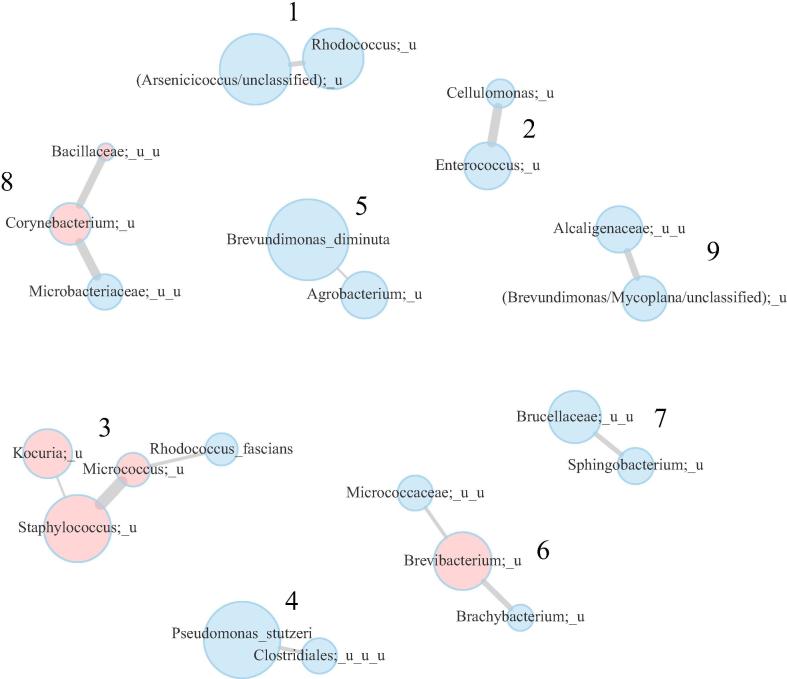
Microbial ecosystems of the built environments have become key mediators of health as people worldwide tend to spend large amount of time indoors. Underexposure to microbes at an early age is linked to increased risks of allergic and autoimmune diseases. Transportation systems are of particular interest, as they are globally the largest space for interactions between city-dwellers. Here we performed the first pilot study of the Moscow subway microbiome by analyzing swabs collected from 5 types of surfaces at 4 stations using high-throughput 16S rRNA gene sequencing. The study was conducted as a part of The Metagenomics and Metadesign of the Subways and Urban Biomes (MetaSUB) project. The most abundant microbial taxa comprising the subway microbiome originated from soil and human skin. Microbiome diversity was positively correlated with passenger traffic. No substantial evidence of major human pathogens presence was found. Co-occurrence analysis revealed clusters of microbial genera including combinations of microbes likely originating from different niches. The clusters as well as the most abundant microbes were similar to ones obtained for the published data on New-York City subway microbiome. Our results suggest that people are the main source and driving force of diversity in subway-associated microbiome. The data form a basis for a wider survey of Moscow subway microbiome to explore its longitudinal dynamics by analyzing an extended set of sample types and stations. Complementation of methods with viability testing, "shotgun" metagenomics, sequencing of bacterial isolates and culturomics will provide insights for public health, biosafety, microbial ecology and urban design.
Keywords: 16S rRNA; Biosurveillance; Built environments; Co-occurrence patterns; Subway; Urban microbiome.
© 2020 The Authors.
Conflict of interest statement
C.E.M. is a cofounder and board member for Biotia and Onegevity Health.
Figures
References
-
- Afshinnekoo Ebrahim, Meydan Cem, Chowdhury Shanin, Jaroudi Dyala, Boyer Collin, Bernstein Nick. Geospatial resolution of human and bacterial diversity with city-scale metagenomics. Cell Syst. 2015;1(1):97. e3. - PubMed
-
- Best D.J., Roberts D.E. Algorithm AS 89: the upper tail probabilities of Spearman’s Rho. J Royal Stat Soc Ser C Appl Stat. 1975;24(3):377–379.
LinkOut - more resources
Full Text Sources