

ABCA12 regulates insulin secretion from β-cells
- PMID: 32072744
- PMCID: PMC7054684
- DOI: 10.15252/embr.201948692
ABCA12 regulates insulin secretion from β-cells
Abstract
Dysregulation of lipid homeostasis is intimately associated with defects in insulin secretion, a key feature of type 2 diabetes. Here, we explore the role of the putative lipid transporter ABCA12 in regulating insulin secretion from β-cells. Mice with β-cell-specific deletion of Abca12 display impaired glucose-stimulated insulin secretion and eventual islet inflammation and β-cell death. ABCA12's action in the pancreas is independent of changes in the abundance of two other cholesterol transporters, ABCA1 and ABCG1, or of changes in cellular cholesterol or ceramide content. Instead, loss of ABCA12 results in defects in the genesis and fusion of insulin secretory granules and increases in the abundance of lipid rafts at the cell membrane. These changes are associated with dysregulation of the small GTPase CDC42 and with decreased actin polymerisation. Our findings establish a new, pleiotropic role for ABCA12 in regulating pancreatic lipid homeostasis and insulin secretion.
Keywords: ABCA12; cholesterol homeostasis; insulin secretion; lipid rafts; type 2 diabetes.
© 2020 The Authors.
Conflict of interest statement
The authors declare that they have no conflict of interest.
Figures
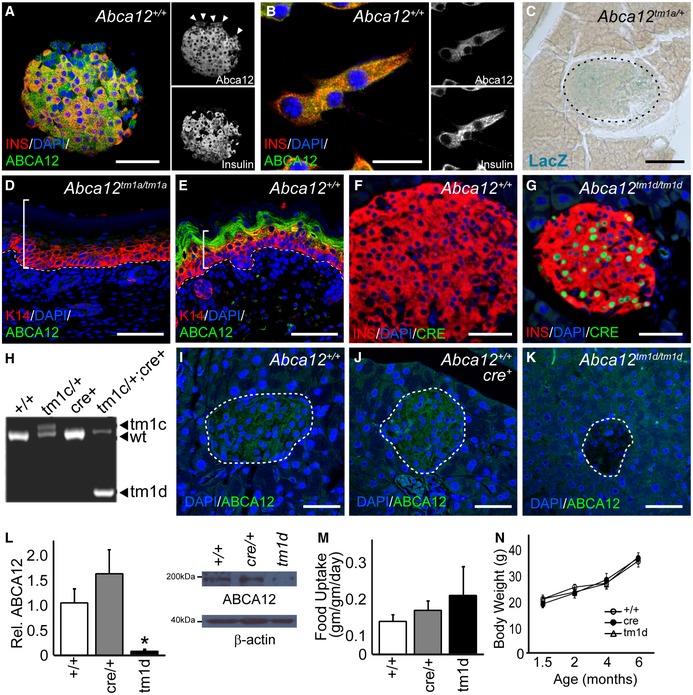
- A
Immunofluorescent staining of ABCA12 (green) and insulin (red) in mouse islets showing extensive co‐localisation in β‐cells as well as expression in other islet populations (arrowheads, scale bar = 25 μm).
- B
Co‐expression of Abca12 (green) and insulin (red) in MIN6 cells (scale bar = 10 μm).
- C
LacZ staining (blue) to detect gene expression of the knocked‐in LacZ cassette from the Abca12 locus in islets (islet outlined, scale bar = 25 μm).
- D, E
ABCA12 immunostaining and the development of hyperkeratotic skin disease in E18.5 Abca12 tm1a/tm1a mouse embryos (brackets indicate thickened epidermis, and dashed line indicates epidermal basement membrane, scale bar = 50 μm).
- F, G
Immunohistochemical detection of cre expression (green) in pancreatic islets from conditional mouse lines showing co‐expression with insulin (red) (scale bar = 50 μm).
- H
Detection of recombination of the Abca12 locus by PCR, indicating different alleles (tm1c, wild type and tm1d).
- I–K
Detection of ABCA12 expression (green) and deletion in pancreas sections from mice of indicated genotypes (islets outlined, scale bar = 25 μm).
- L
Quantitation of ABCA12 expression by densitometry of Western blots from purified pancreatic islets (values relative to wild type, n = 3–8 animals per genotype, mean ± SEM, *P = < 0.05, Student's t‐test), showing representative blot with actin loading control (right).
- M, N
(M) Average daily food intake of conditionally modified mice and (N) animal body weight (n = 4–10 animals/genotype, mean ± SEM).
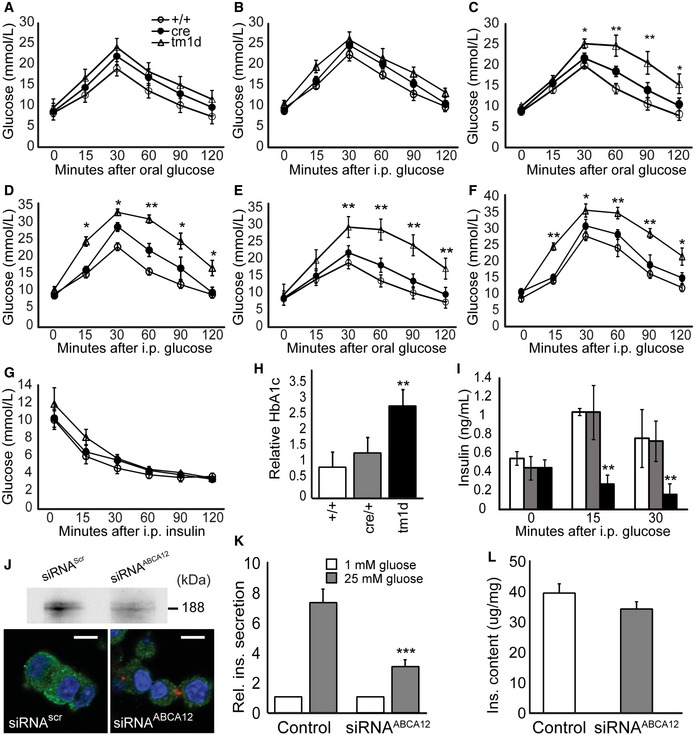
- A–F
Oral and intraperitoneal glucose tolerance testing in Abca12 tm1d mice at 6 (A, B), 8 (C, D) and 12 weeks (E, F) (mean ± SEM, n = 4–9 mice per group, *P = < 0.05, **P < 0.01 Student's t‐test).
- G
Insulin tolerance in 12‐week‐old mice (mean ± SEM, n = 4–9 mice per group).
- H
Whole blood Hb1Ac levels in 16‐week‐old Abca12 tm1d mice (mean ± SEM, n = 4–9 mice per group, **P < 0.01 Student's t‐test).
- I
Acute phase insulin secretion after intraperitoneal injection of glucose (mean ± SEM, n = 4–9 animals per group, white/grey/black = Abca12 +/+, cre/+ and Abca12 tm1d , respectively, mice at 8 weeks of age, **P < 0.01 Student's t‐test).
- J
Silencing of ABCA12 in MIN6 cells as assessed by Western blot of ABCA12 immuno‐precipitate (top panel) or confocal microscopy in cells transfected with Dy547‐siRNAABCA12 (lower panel, scale bar = 10 μm).
- K
Glucose‐stimulated insulin secretion (GSIS) from MIN6 cells after silencing of ABCA12 (mean ± SEM, n = 4 replicates from assays in quadruplicate, ***P < 0.0001, Student's t‐test).
- L
Cellular insulin content in MIN6 cells after silencing of ABCA12 (mean ± SEM, n = 4 replicates from assays in quadruplicate).
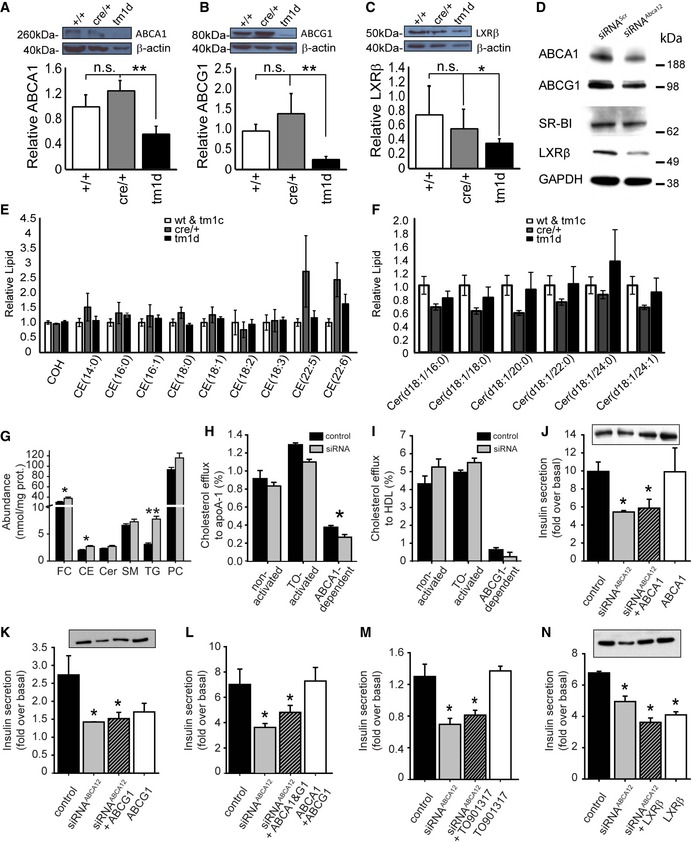
- A–C
(A) ABCA1, (B) ABCG1 and (C) LXRβ expression in islets of 8‐week‐old mice assessed by Western blotting (mean ± SEM, n = 3–6 mice per genotype, relative to β‐actin controls, *P < 0.05, **P = < 0.01, Student's t‐test).
- D
Western blot of cell lysates of MIN6 cells after silencing of Abca12, probed with antibodies against ABCA1, ABCG1, SR‐B1 and LXRβ.
- E
Total cholesterol (COH) or cholesteryl ester (CE) levels in isolated pancreatic islets of mice at 8 weeks of age with deletion of Abca12 in β‐cells (mean ± SEM n = 9, 5 and 5 mice per genotype, respectively).
- F
Ceramides levels in isolated pancreatic islets of mice at 8 weeks of age with deletion of Abca12 in β‐cells (mean ± SEM n = 10, 4 and 5 mice per genotype, respectively).
- G
Lipid levels in MIN6 cells in which ABCA12 had been depleted by siRNA treatment (mean ± SEM, n = 5 (biological replicates assayed in triplicate), FC = free cholesterol, CE = cholesterol ester, Cer = ceramide, SM = sphingomyelin, TG = triacylglycerol, PC = phosphatidylcholine, *P < 0.05, **P = < 0.01, Student's t‐test).
- H
Cholesterol efflux to lipid‐free apoA‐I (30 μg/ml, 2 h) from MIN6 cells transfected with siRNAscr or siRNAABCA12 and activated or not with TO901317 (4 μM) (mean ± SEM, n = 4, (biological replicates assayed in triplicate), *P = < 0.05, Student's t‐test).
- I
Cholesterol efflux to HDL (30 μg/ml, 2 h) from MIN6 cells transfected with siRNAscr or siRNAABCA12 and activated or not with TO901317 (4 μM); (mean ± SEM, n = 4 (biological replicates assayed in triplicate)).
- J
The effect of overexpression of ABCA1 on GSIS from MIN6 cells with ABCA12 deficiency (mean ± SEM, n = 4 (biological replicates assayed in triplicate), *P = < 0.05, Student's t‐test), inset shows a Western blot of cell lysates probed with anti‐ABCA1 antibody in which the order of bands corresponds to the order of bars).
- K
The effect of overexpression of ABCG1 on GSIS from MIN6 cells with ABCA12 deficiency (mean ± SEM, n = 4 (biological replicates assayed in triplicate), *P = < 0.05, Student's t‐test), inset shows a Western blot of cell lysate probed with anti‐ABCG1 antibodies in which the order of bands corresponds to the order of bars).
- L
The effect of overexpression of ABCA1 and ABCG1 on GSIS from MIN6 cells with ABCA12 deficiency (mean ± SEM, n = 4 (biological replicates assayed in triplicate), *P = < 0.05, Student's t‐test).
- M
The effect of activation of cells with TO901317 (4 μM) on GSIS from MIN6 cells with ABCA12 deficiency (mean ± SEM, n = 4 (biological replicates assayed in triplicate), *P = < 0.05, Student's t‐test).
- N
The effect of overexpression of LXRβ on GSIS from MIN6 cells with ABCA12 deficiency (mean ± SEM, n = 4 (biological replicates), *P = < 0.05, Student's t‐test), inset shows a Western blot of cell lysates probed with anti‐LXRβ antibody in which the order of bands corresponds to the order of bars).
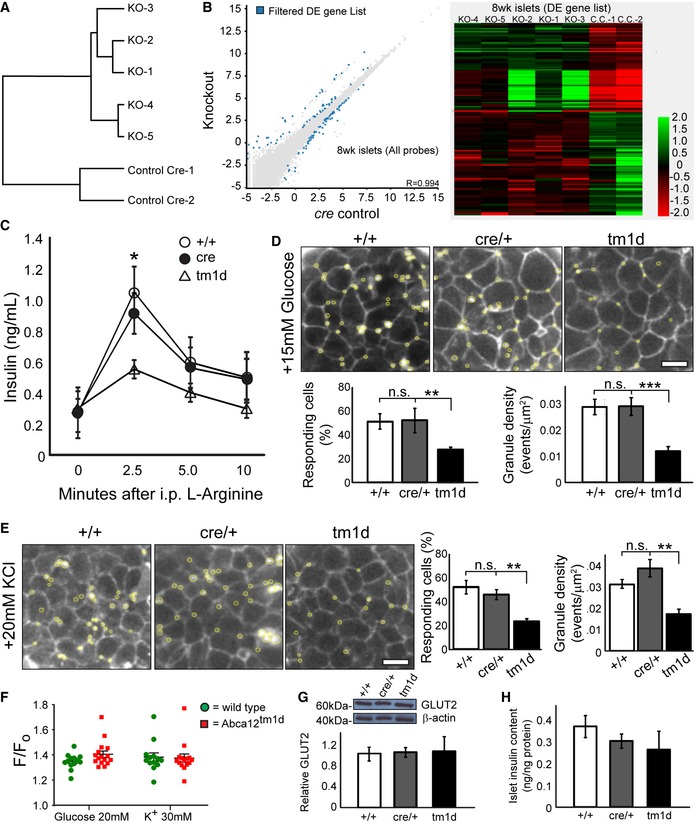
- A
Clustering of gene expression by genotype in RNAseq of islets isolated of cre control and Abca12 tm1d mice at 8 weeks of age.
- B
Scatter plot and heat map of differential gene expression between cre control and Abca12 tm1d mice at 8 weeks of age. Legend indicates log2 fold change values.
- C
Circulating glucose levels after administration of intraperitoneal
l ‐arginine in mice at 8 weeks of age (mean ± SEM, n = 3 mice per genotype, *P = < 0.05 of cre relative to tm1d, Student's t‐test). - D
Representative images of insulin granule fusion events (yellow circles) in mice of indicated genotypes in response to administration of 15 mM glucose (scale bar = 10 μm). Quantification of the proportion of responding cells and the density of granule fusion events are presented in graphs in the lower panel (mean ± SEM, 8–10 islets/mouse, > 4 mice/genotype, **P = < 0.01, ***P = < 0.001 of cre relative to tm1d, Student's t‐test).
- E
Representative images of insulin granule fusion events (yellow circles) in mice of indicated genotypes in response to administration of 20 mM KCl (scale bar = 10 μm). Quantification of the proportion of responding cells and the density of granule fusion events are presented in graphs in the right panel (mean ± SEM, 8–10 islets/mouse, > 4 mice/genotype, **P = < 0.01 of cre relative to tm1d, Student's t‐test).
- F
Assessment of calcium flux measured by Fluo4 in response to either glucose or potassium in isolated islets from 11‐week‐old animals. Fluorescence responses were corrected for basal fill (F/F 0). (mean ± SEM, each data point represents the average of 10 cells/coverslip for 13–16 coverslips for each of 4 wild‐type and 5 Abca12 tm1d mice).
- G
The expression of GLUT2 in isolated mouse islets at 8 weeks of age. The upper panel depicts a representative Western blot and the lower graph the quantitation of protein levels from three mice of each genotype, normalised to β‐actin (mean ± SEM).
- H
Insulin content of islets of Abca12 tm1d mice (mean ± SEM, n = 3 mice of each genotype, normalised to total protein content).
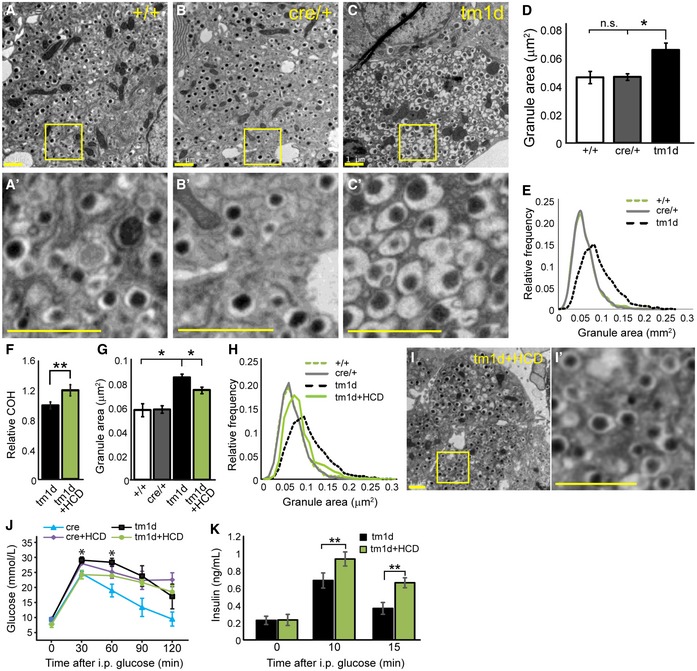
- A–C
Transmission electron microscopy of β‐cells from Abca12 tm1d and control mice at 8 weeks of age. Panels (A′–C′) depict higher resolution images from the boxed regions in (A–C) (scale bar = 1 μm).
- D
Quantitation of the area of 3,000 granules from each genotype (mean ± SEM, n = 4, 3 and 3 animals, respectively, *P = < 0.05 of cre relative to tm1d, Student's t‐test).
- E
Relative frequency distribution of granule areas from (D).
- F
Assessment of total cholesterol (COH) by mass spectroscopy in mice fed normal chow or a high cholesterol diet (HCD) (mean ± SEM, n = 5 and 4 animals, respectively, **P = < 0.01, Student's t‐test).
- G, H
Quantification of change in mean granule area in Abca12 tm1d on chow diet and Abca12 tm1d on high cholesterol diet islets assessed by transmission electron microscopy (n = 3,000 granules/genotype, mean ± SEM, n = 4, 3, 3 and 4 animals, respectively, *P = < 0.05, Student's t‐test) as an average and as a relative frequency distribution.
- I
Correction in abnormal granule shape following high cholesterol feeding (bar = 1 μm), with I’ showing magnification of the boxed region indicated.
- J
Glucose tolerance test results following intraperitoneal glucose challenge in Abca12 tm1d and cre control mice fed normal chow or HCD (mean ± SEM, n = 3 mice per genotype, *P = < 0.05, for tm1d versus tm1d+HCD, Student's t‐test).
- K
Serum insulin in Abca12 tm1d ± HCD mice after i.p glucose challenge (mean ± SEM, n = 3 mice/genotype, **P = < 0.01, Student's t‐test).
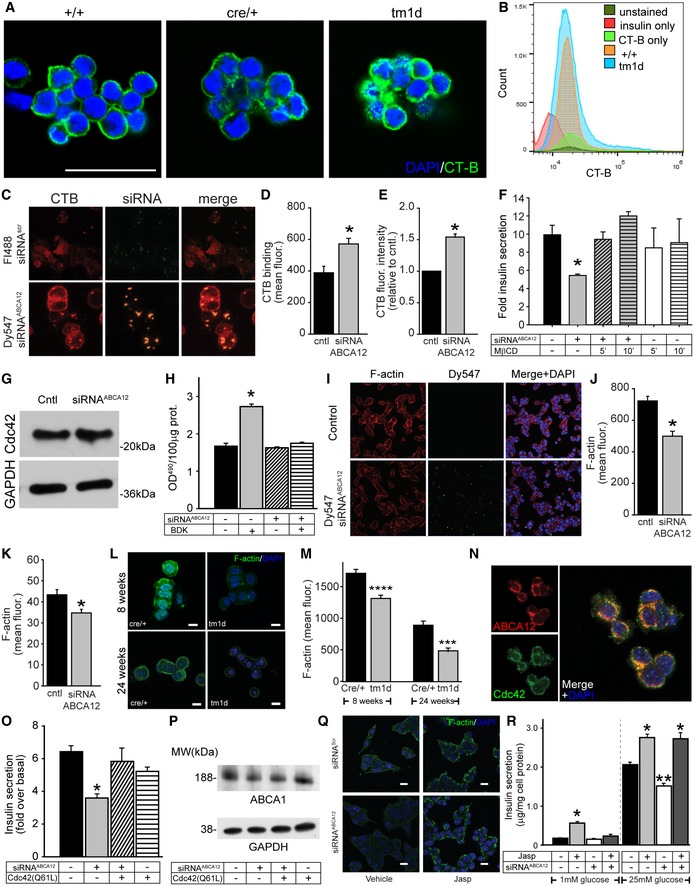
- A
Detection of lipid rafts in 8‐week‐old islets with recombinant cholera toxin subunit B (CT‐B) conjugated to Alexa Fluor 488 (green). Islets are co‐stained with DAPI (blue) (scale bar = 50 μm.).
- B
FACS profiling of dispersed islets from 12‐week‐old mice stained with insulin and CT‐B.
- C
Confocal images of rafts (using CT‐B‐Alexa Fluor 647) in MIN6 cells transfected with Fluorescein‐488‐labelled siRNAScr or Dy547‐labelled siRNAABCA12 (scale bar = 10 μm).
- D
Quantitation by confocal microscopy of the effect of ABCA12 deficiency on CT‐B binding to MIN6 cells (mean ± SEM, *P = < 0.05, Student's t‐test, n = 4 biological replicates, 50–100 cells for each).
- E
Quantitation by flow cytometry of the effect of ABCA12 deficiency on CT‐B binding to MIN6 cells (mean ± SEM, n = 3 biological replicates, *P = < 0.05, Student's t‐test).
- F
The effect 10 mM MβCD on GSIS in MIN6 cells depleted or not for ABCA12 (incubation for 5 or 10 min as indicated, mean ± SEM, n = 4 (biological replicates), *P = < 0.05, Student's t‐test).
- G
Western blot of the abundance of CDC42 in ABCA12‐deficient MIN6 cells.
- H
The effect of ABCA12 deficiency on activation of CDC42 by bradykinin in MIN6 cells (BDK, 100 ng/ml, 4 min; *P = < 0.05, Student's t‐test, significance versus ABCA12‐deficient BDK‐activated cells are indicated, n = 4 biological replicates, mean ± SEM).
- I, J
(I) Confocal images of F‐actin in ABCA12‐deficient MIN6 cells (scale bar = 20 μm) and (J) quantification of abundance showing the effect of ABCA12 deficiency (mean ± SEM, *P = < 0.05, Student's t‐test, n = 4 biological replicates, 50–100 cells for each).
- K
F‐actin levels assessed by FACS sorting of labelled MIN6 cells transfected with siRNAABCA12 (mean ± SEM, n = 3 biological replicates, *P = < 0.05, Student's t‐test).
- L, M
(L) Representative image of F‐actin using LifeAct staining of purified islets isolated from Abca12 tm1d versus control mice (scale bar = 10 μm) and (M) quantitation of fluorescent signals from these samples (n = 3 biological replicates, mean ± SEM, ***P = < 0.001, ****P = < 0.0001 Student's t‐test).
- N
Co‐localisation between ABCA12 (red) and CDC42 (green) in MIN6 cells (scale bar = 10 μm).
- O
Effects of overexpression of a constitutively active form of CDC42 on GSIS from MIN6 cells with ABCA12 deficiency (mean ± SEM, n = 4 biological replicates, *P = < 0.05, Student's t‐test).
- P
The effect of overexpression of constitutively active CDC42 on ABCA1 abundance in MIN6 cells with ABCA12 deficiency. Treatments are defined in the table below.
- Q
Effects of Jasplakinolide on F‐actin levels (green) in siRNA‐treated cells (scale bar = 10 μm).
- R
Effects of Abca12 knockdown and Jasplakinolide treatment on MIN6 cell in low and high glucose (mean ± SEM, n = 4 biological replicates, *P = < 0.05, **P = < 0.01, significance relative to untreated cells, Student's t‐test).
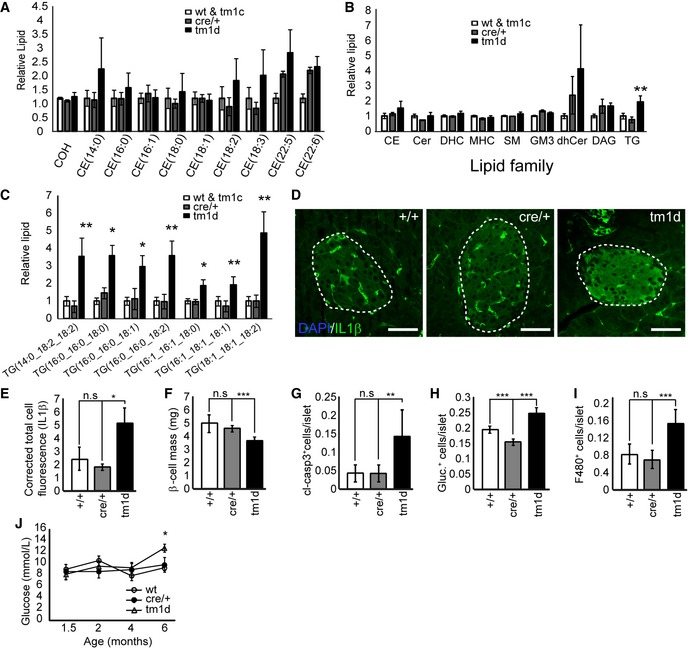
- A
Mass spectroscopy analysis of levels of cholesterol and cholesteryl esters in purified islets from Abca12 tm1d mice versus control animals at 16 weeks of age (mean ± SEM, n = 10, 4 and 5 mice per genotype, respectively; COH = cholesterol, CE = cholesteryl ester).
- B
Mass spectroscopy analysis of lipids families in purified islets from Abca12 tm1d mice versus control animals at 16 weeks of age (mean ± SEM, n = 10, 4 and 5 mice per genotype, respectively, **P = < 0.01 Student's t‐test); CE = cholesteryl ester, Cer = ceramide, DHC (Hex2Cer) = dihexosylceramide, MHC (HexCer) = monohexosylceramide, SM = sphingomyelin, GM3 = GM3 ganglioside, dhCer = dihydroceramide, DG = diacylglycerol, TG = triacylglycerol).
- C
Mass spectroscopy analysis of triglyceride species in purified islets from Abca12 tm1d mice versus control animals at 16 weeks of age (mean ± SEM, n = 10, 4 and 5 mice per genotype, respectively, *P = < 0.05, **P = < 0.01, Student's t‐test).
- D
Immunohistochemical staining of levels IL‐1β expression in sections of pancreas from Abca12 tm1d mice versus control animals at 24 weeks of age (bar = 25 μm, islets outlined).
- E
Quantification of islet‐specific IL1β staining from sections of Abca12tm1d, Cre and wild‐type mice (mean ± SEM, n = 3, 3 and 4 mice of each genotype, respectively; *P = < 0.05, Student's t‐test).
- F–J
Analysis of Abca12 tm1d pancreata from mice at 24 weeks of age compared to control mice assessing β‐cell mass (F), cleaved caspase 3 (G), glucagon (H) and F480+ macrophage populations (I) (mean ± SEM, n = 3–9 mice per genotype, **P = < 0.01, ***P = < 0.001, Student's t‐test). (J) Fasting blood glucose levels coincident with the emergence of inflammatory phenotypes (mean ± SEM, n = 3, 4 and 5 mice per genotype, respectively, *P = < 0.05, Student's t‐test).
References
-
- von Eckardstein A, Sibler RA (2011) Possible contributions of lipoproteins and cholesterol to the pathogenesis of diabetes mellitus type 2. Curr Opin Lipidol 22: 26–32 - PubMed
-
- Kruit JK, Wijesekara N, Westwell‐Roper C, Vanmierlo T, de Haan W, Bhattacharjee A, Tang R, Wellington CL, Lutjohann D, Johnson JD et al (2012) Loss of both ABCA1 and ABCG1 results in increased disturbances in islet sterol homeostasis, inflammation, and impaired β‐cell function. Diabetes 61: 659–664 - PMC - PubMed
-
- Brunham LR, Kruit JK, Pape TD, Timmins JM, Reuwer AQ, Vasanji Z, Marsh BJ, Rodrigues B, Johnson JD, Parks JS et al (2007) beta‐cell ABCA1 influences insulin secretion, glucose homeostasis and response to thiazolidinedione treatment. Nat Med 13: 340–347 - PubMed
-
- Kruit JK, Brunham LR, Verchere CB, Hayden MR (2010) HDL and LDL cholesterol significantly influence beta‐cell function in type 2 diabetes mellitus. Curr Opin Lipidol 21: 178–185 - PubMed
Publication types
MeSH terms
Substances
Associated data
- Actions
Grants and funding
- APP1123554/Department of Health | National Health and Medical Research Council (NHMRC)/International
- APP1020281/Department of Health | National Health and Medical Research Council (NHMRC)/International
- APP1036352/Department of Health | National Health and Medical Research Council (NHMRC)/International
- APP1106516/Department of Health | National Health and Medical Research Council (NHMRC)/International
- GNT1020281/Department of Health | National Health and Medical Research Council (NHMRC)/International
LinkOut - more resources
Full Text Sources
Medical
Molecular Biology Databases
Miscellaneous
