. 2020 Feb 19:9:e48705.
doi: 10.7554/eLife.48705.

Stxbp1/Munc18-1 haploinsufficiency impairs inhibition and mediates key neurological features of STXBP1 encephalopathy

Affiliations

Stxbp1/Munc18-1 haploinsufficiency impairs inhibition and mediates key neurological features of STXBP1 encephalopathy

Wu Chen et al. Elife. .

Abstract

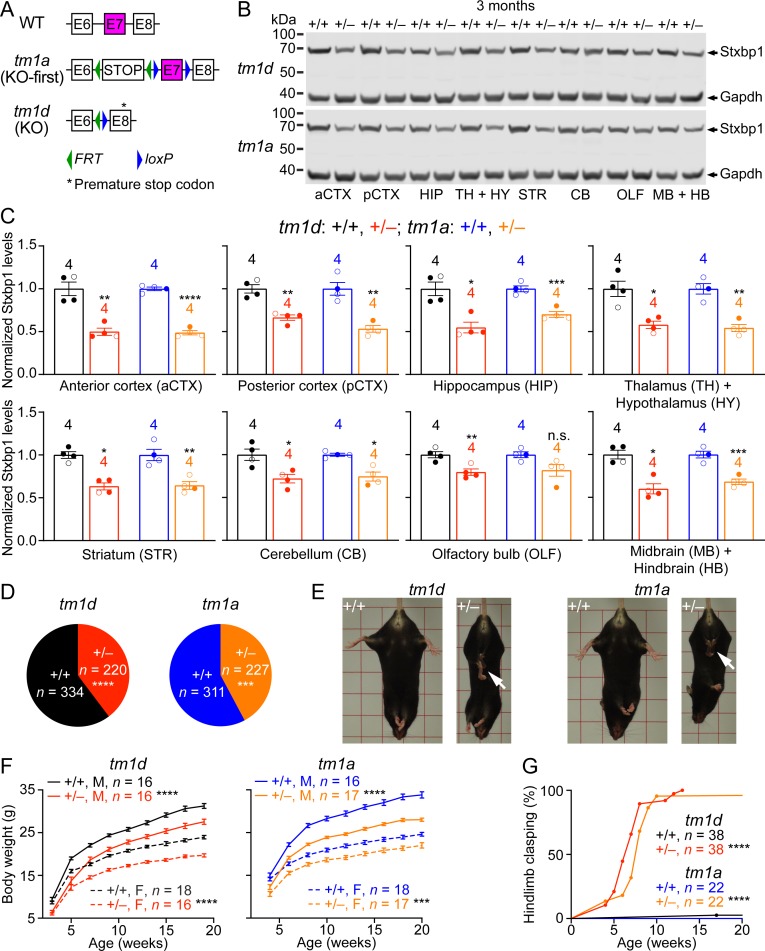
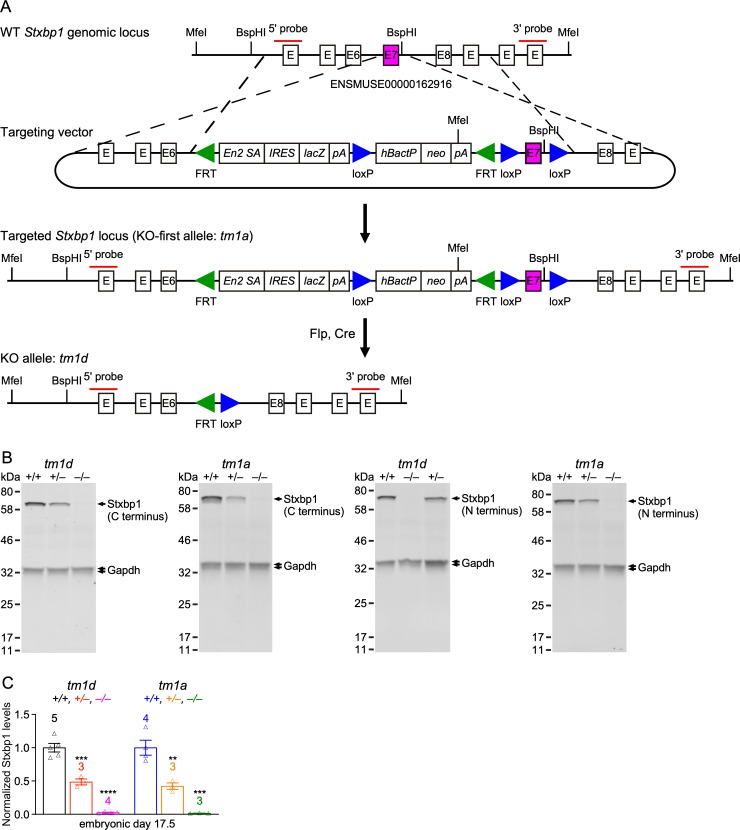
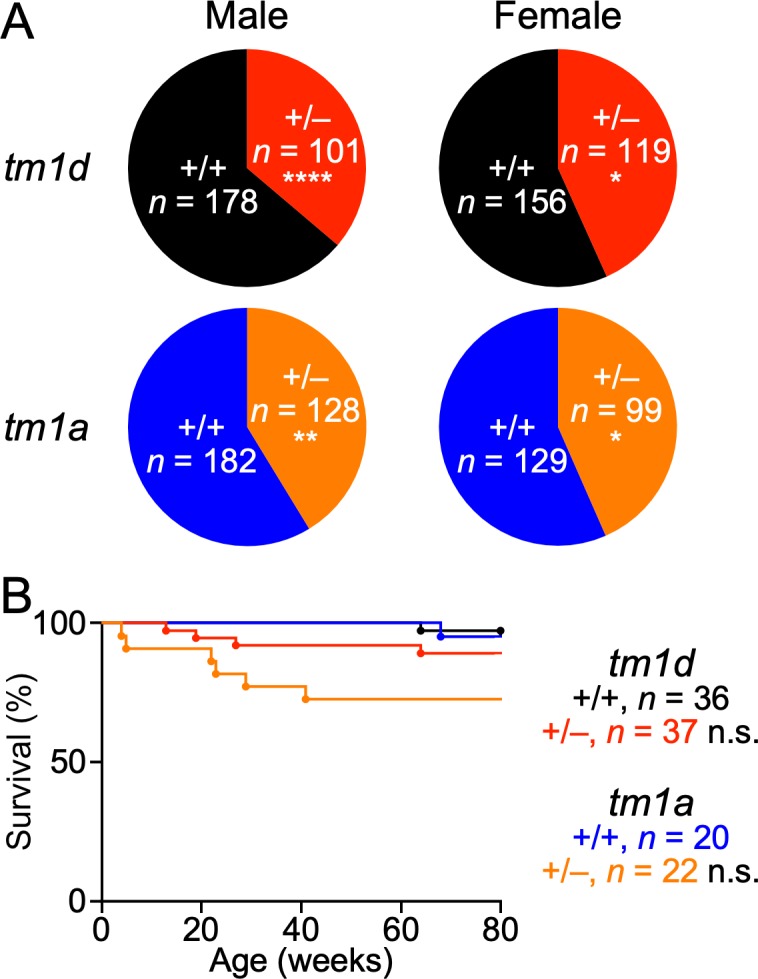
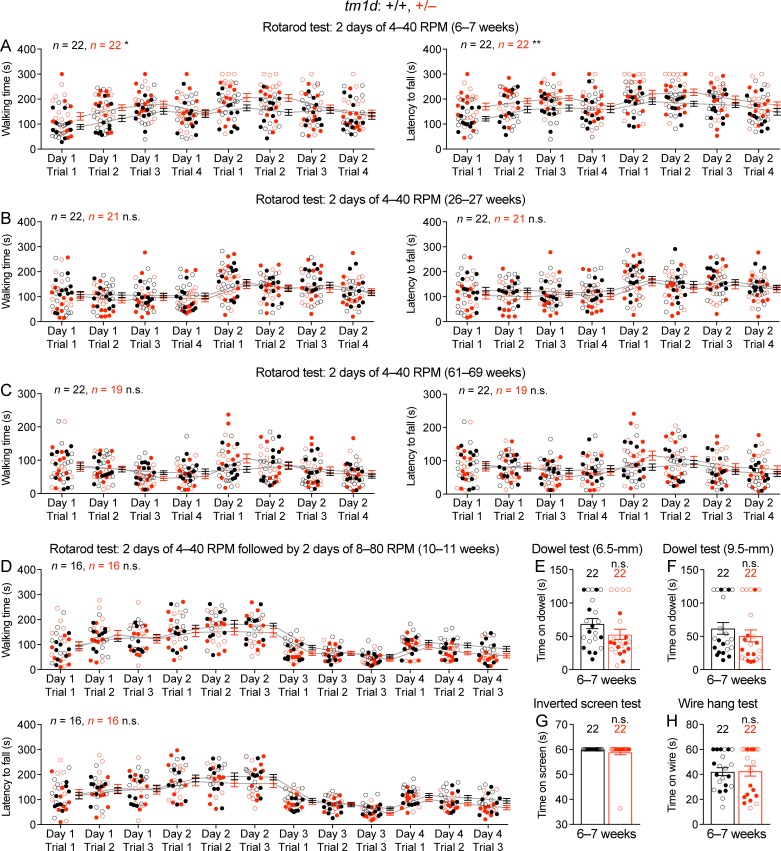
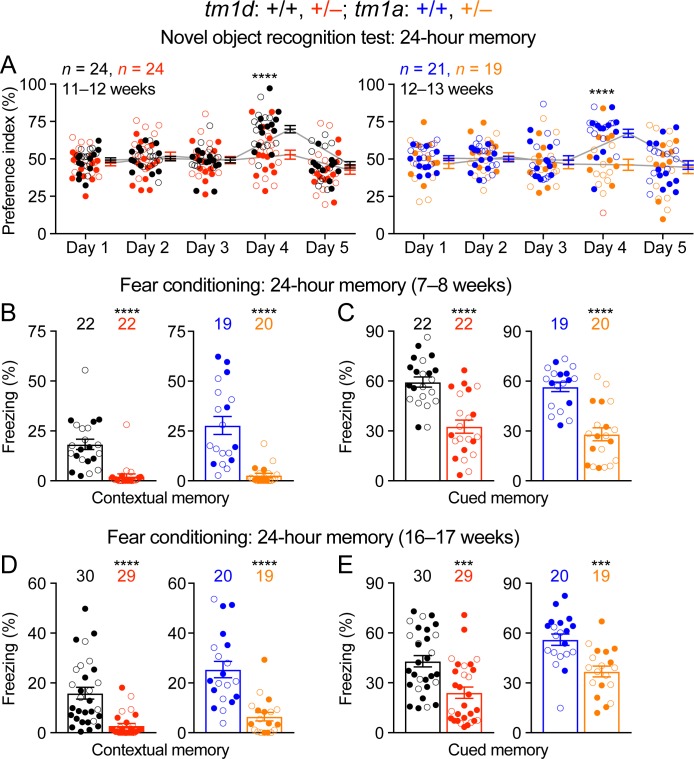
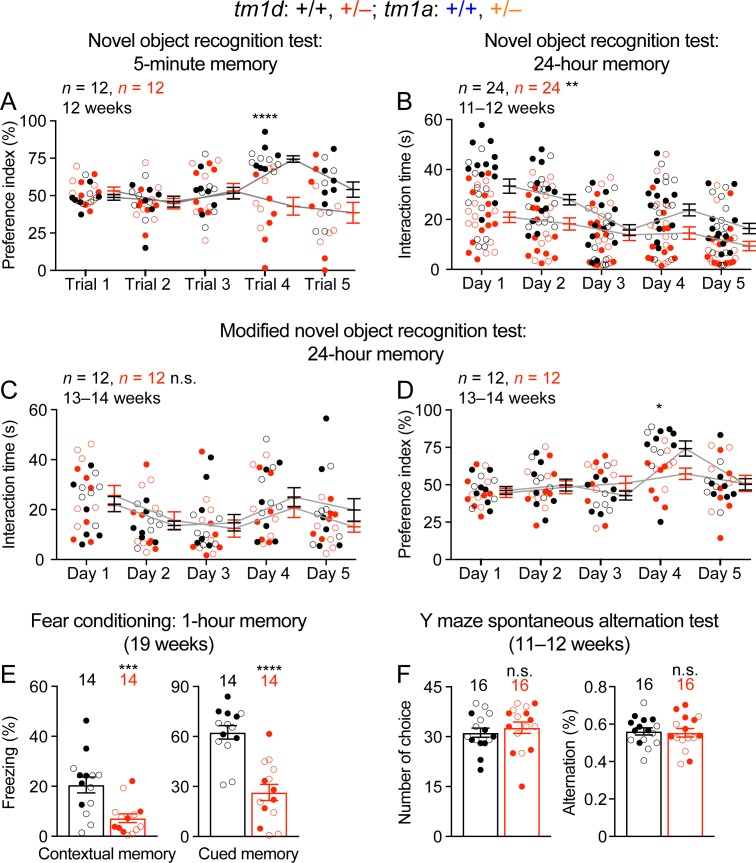
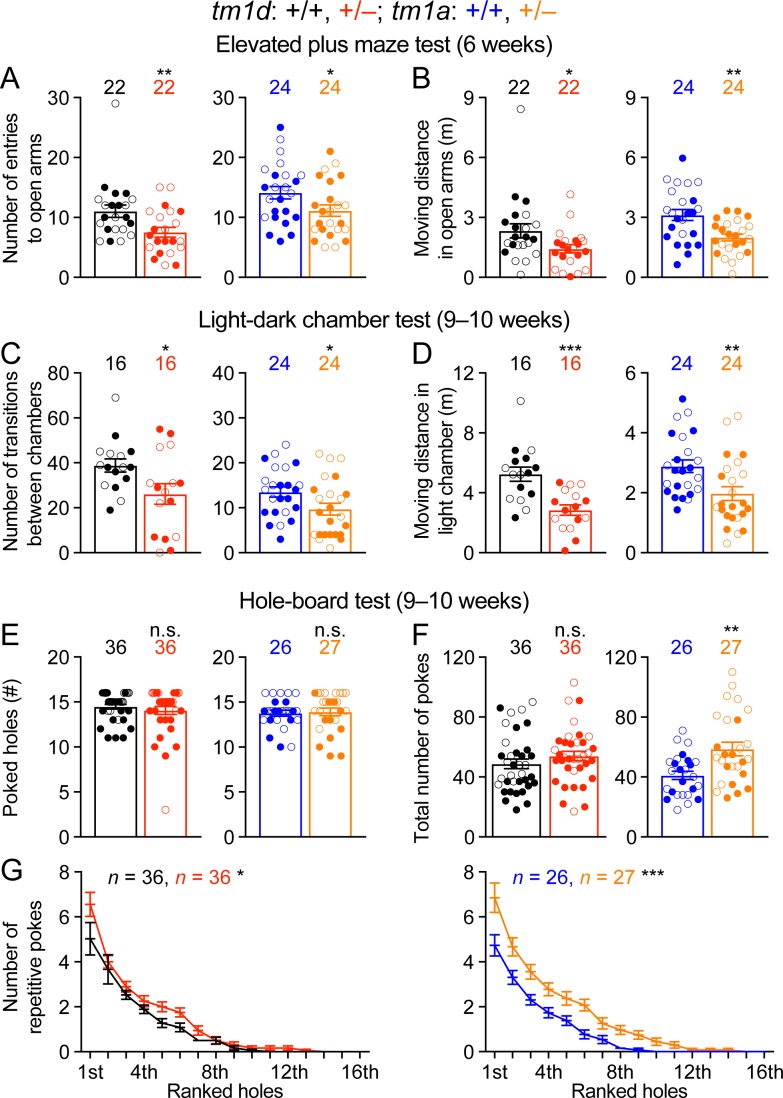
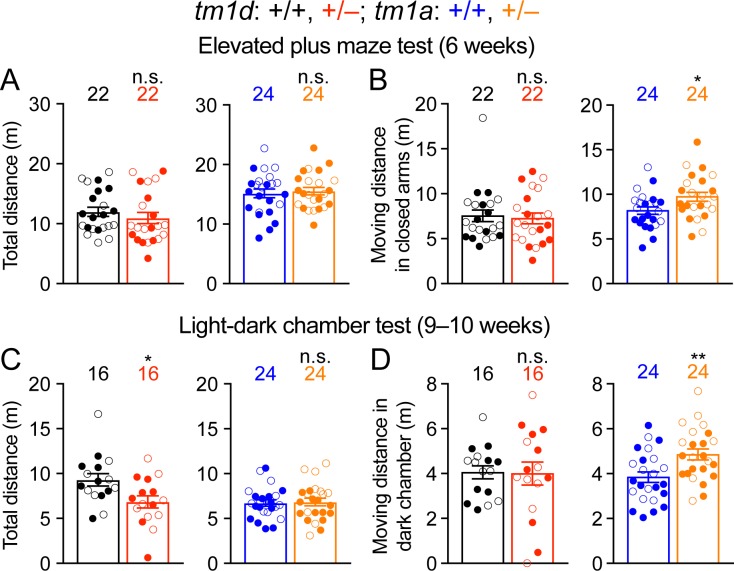
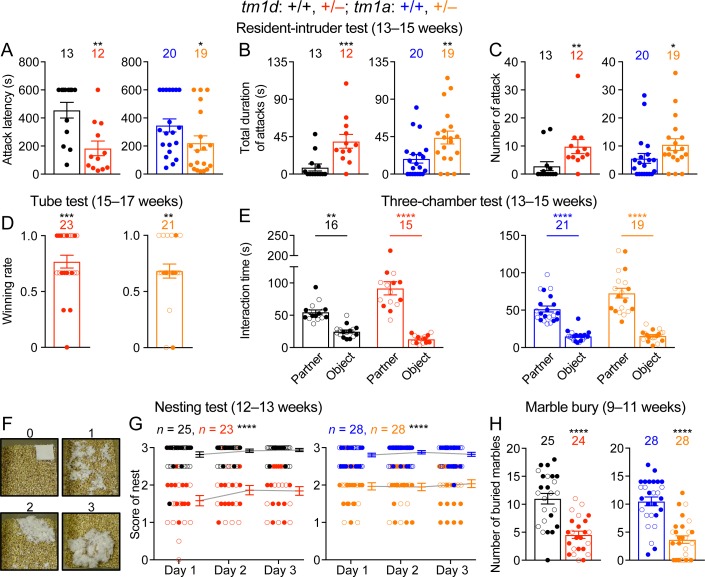
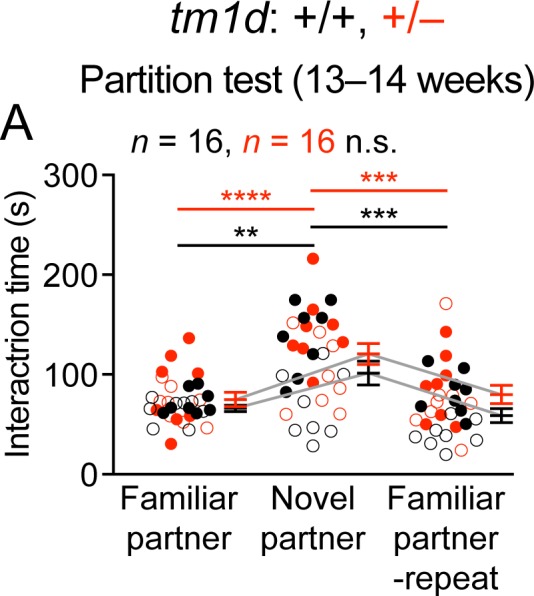
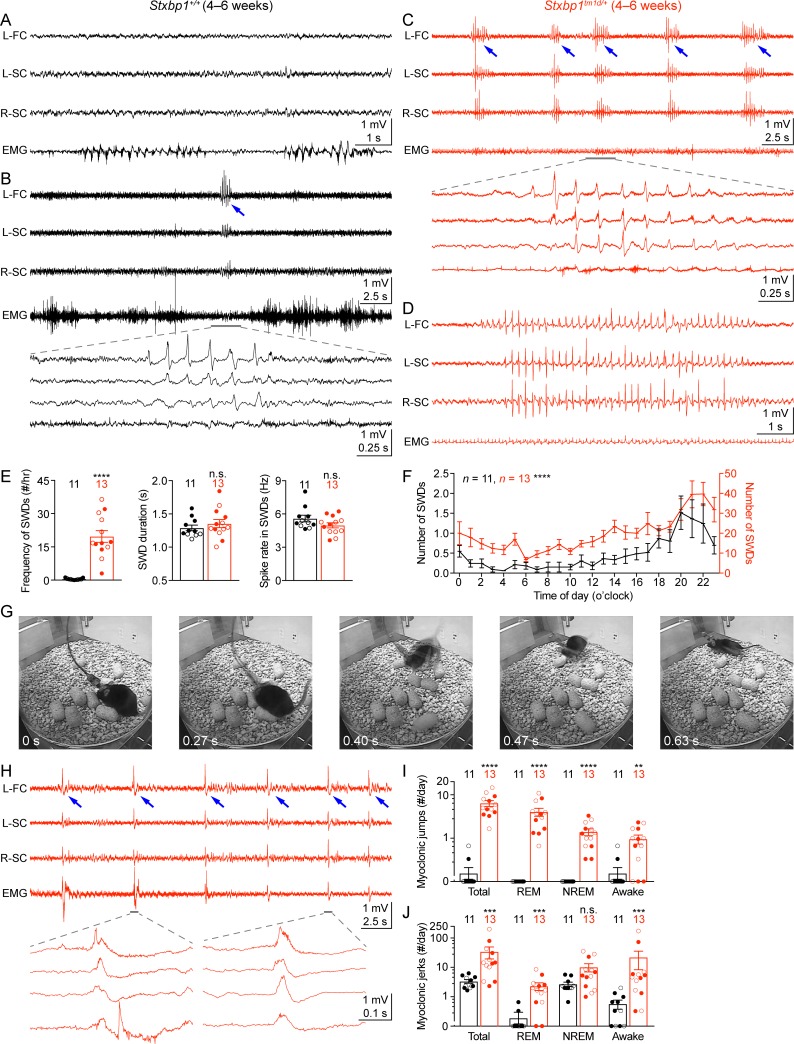
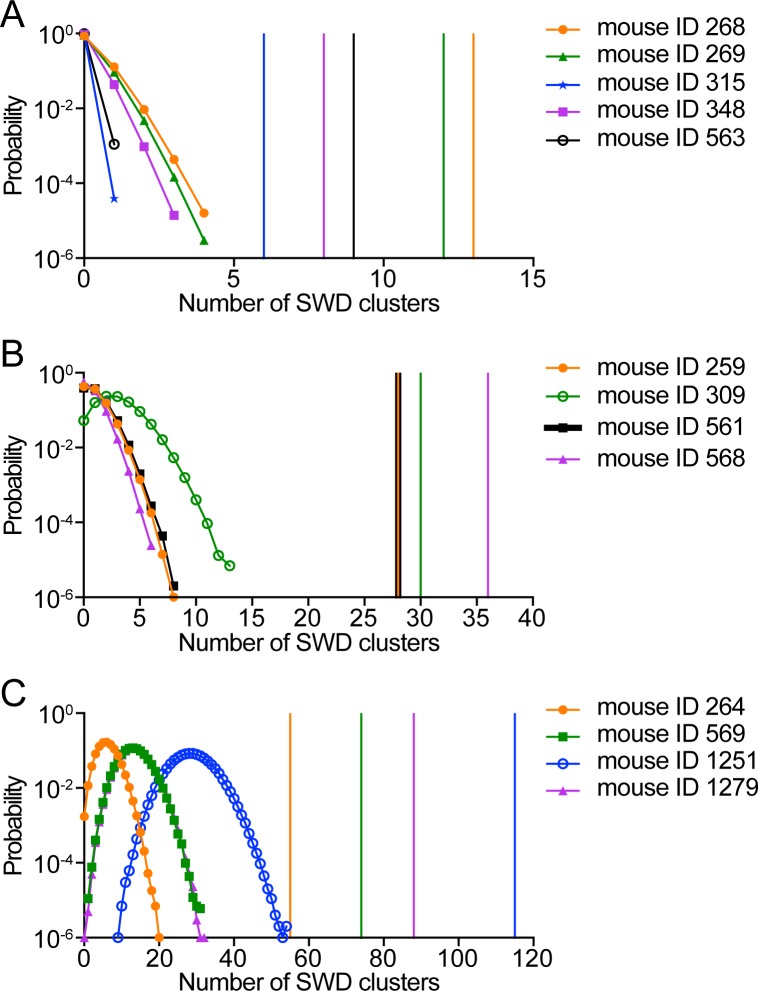
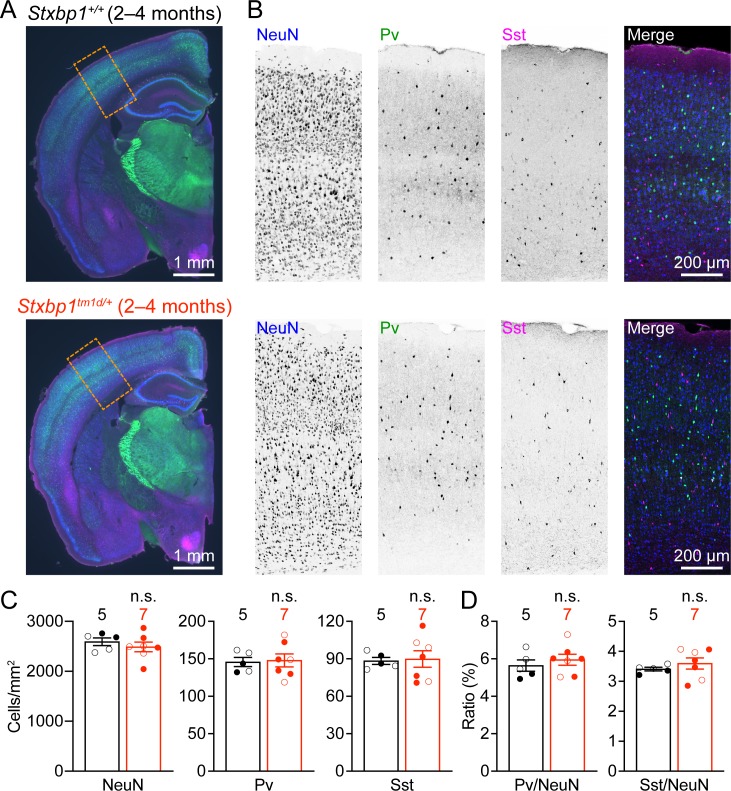
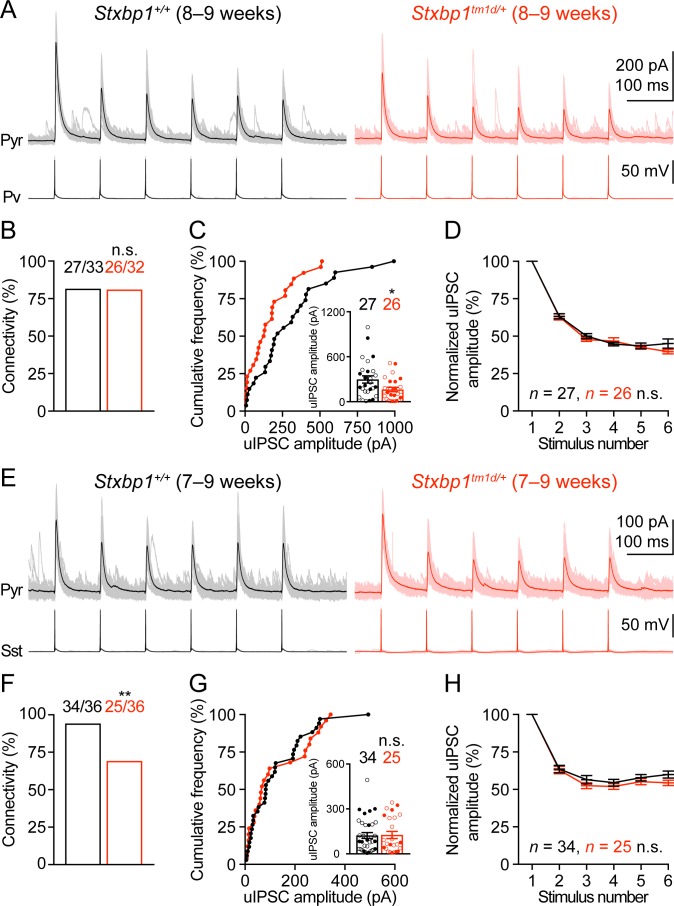
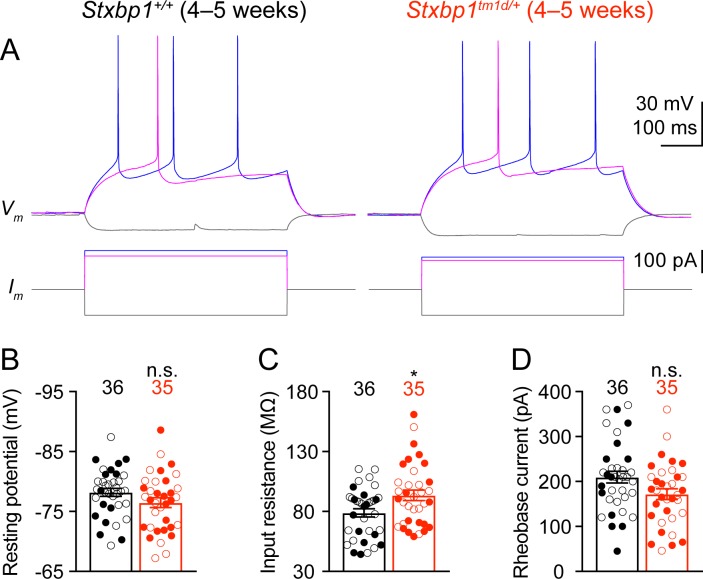
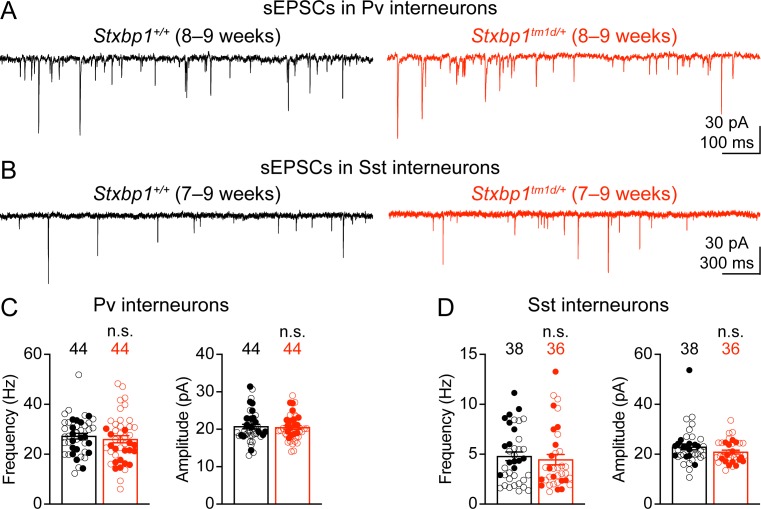
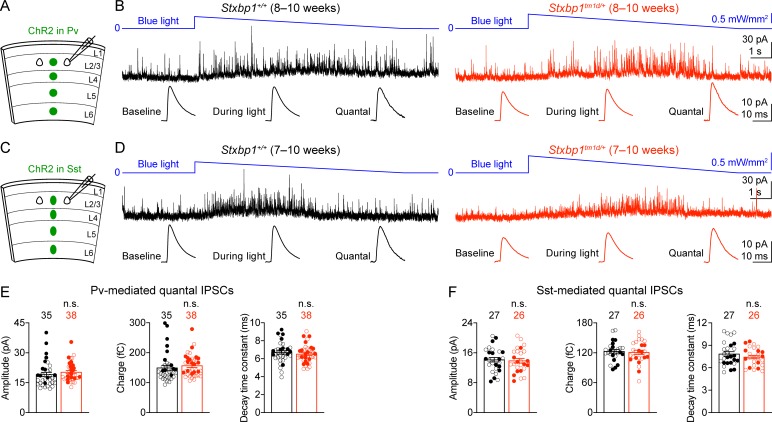
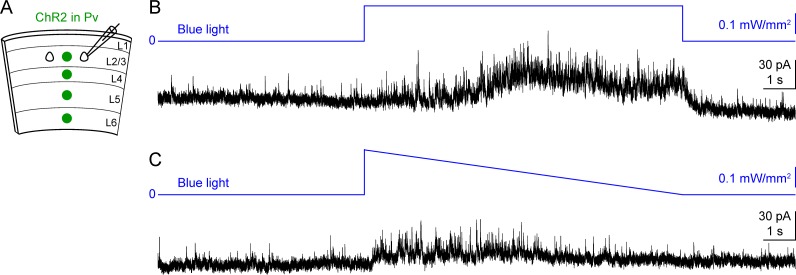
Mutations in genes encoding synaptic proteins cause many neurodevelopmental disorders, with the majority affecting postsynaptic apparatuses and much fewer in presynaptic proteins. Syntaxin-binding protein 1 (STXBP1, also known as MUNC18-1) is an essential component of the presynaptic neurotransmitter release machinery. De novo heterozygous pathogenic variants in STXBP1 are among the most frequent causes of neurodevelopmental disorders including intellectual disabilities and epilepsies. These disorders, collectively referred to as STXBP1 encephalopathy, encompass a broad spectrum of neurologic and psychiatric features, but the pathogenesis remains elusive. Here we modeled STXBP1 encephalopathy in mice and found that Stxbp1 haploinsufficiency caused cognitive, psychiatric, and motor dysfunctions, as well as cortical hyperexcitability and seizures. Furthermore, Stxbp1 haploinsufficiency reduced cortical inhibitory neurotransmission via distinct mechanisms from parvalbumin-expressing and somatostatin-expressing interneurons. These results demonstrate that Stxbp1 haploinsufficient mice recapitulate cardinal features of STXBP1 encephalopathy and indicate that GABAergic synaptic dysfunction is likely a crucial contributor to disease pathogenesis.

Keywords: cortical inhibitory interneurons; epilepsy; intellectual disability; mouse; neurobehaviors; neuropsychiatric dysfunctions; neuroscience; synaptic transmission.


Conflict of interest statement

WC, ZC, EC, HC, CL, SH, HC, JK, JM, JT, JS, MX No competing interests declared, HZ Senior Editor, eLife

Figures

Figure 1.
Figure 1.. Stxbp1 haploinsufficient mice exhibit reduced Stxbp1 levels, survival, and body weights and develop hindlimb clasping.
(A) Genomic structures of Stxbp1 WT, tm1a (KO-first), and tm1d (KO) alleles. In the tm1a allele, the STOP including the En2SA-IRES-lacZ-pA trapping cassette (see Figure 1—figure supplement 1A) truncates the Stxbp1 mRNA after exon 6. In the tm1d allele, exon 7 is deleted, resulting in a premature stop codon in exon 8. E, exon; FRT, Flp recombination site; loxP, Cre recombination site. (B) Representative Western blots of proteins from different brain regions of 3-month-old WT, Stxbp1tm1d/+, and Stxbp1tm1a/+ mice. Gapdh, a housekeeping protein as loading control. The brain regions are labeled by the same abbreviations as in (C). (C) Summary data of normalized Stxbp1 expression levels from different brain regions. Stxbp1 levels were first normalized by the Gapdh levels and then by the average Stxbp1 levels of all WT mice from the same blot. Each filled (male) or open (female) circle represents one mouse. (D) Stxbp1tm1d/+ and Stxbp1tm1a/+ male mice were crossed with WT female mice. Pie charts show the observed genotypes of the offspring at weaning (i.e., around the age of 3 weeks). Stxbp1tm1d/+ and Stxbp1tm1a/+ mice were significantly less than Mendelian expectations. (E) Stxbp1tm1d/+ and Stxbp1tm1a/+ mice were smaller and showed hindlimb clasping (arrows). (F) Body weights as a function of age. M, male; F, female. (G) The fraction of mice with hindlimb clasping as a function of age. Bar graphs are mean ± s.e.m. **, p<0.01; ***, p<0.001; ****, p<0.0001.
Figure 1—figure supplement 1.
Figure 1—figure supplement 1.. Generation of two new Stxbp1 null alleles.
(A) The Stxbp1 WT genomic region was targeted by a multipurpose cassette that contains an Engrailed two splice acceptor site (En2SA), an encephalomyocarditis virus internal ribosomal entry site (IRES), lacZ, SV40 polyadenylation element (pA), and floxed exon 7, resulting in the KO-first allele (tm1a). The restriction enzymes and probes used in the Southern blots are indicated in the diagrams. The KO-first allele was converted to the KO allele (tm1d) by crossing Stxbp1tm1a/+ mice with Rosa26-Flpo and Sox2-Cre mice sequentially. (B) Representative Western blots of Stxbp1 and Gapdh proteins extracted from the brains at embryonic day 17.5. Stxbp1 was detected by an antibody recognizing the C terminus (left two blots) or the N terminus (right two blots). The genotypes are indicated above the samples. Note that Stxbp1 was reduced in heterozygous mutants and absent in homozygous mutants. (C) Summary data of normalized Stxbp1 expression levels. Stxbp1 levels were first normalized by the Gapdh levels and then by the average Stxbp1 levels of all WT mice from the same blot. The data obtained by both Stxbp1 antibodies are combined. Each triangle represents one mouse. Bar graphs are mean ± s.e.m. **, p<0.01; ***, p<0.001; ****, p<0.0001.
Figure 1—figure supplement 2.
Figure 1—figure supplement 2.. Reduced survival of Stxbp1 haploinsufficient mice.
(A) Stxbp1tm1d/+ and Stxbp1tm1a/+ male mice were crossed with WT female mice. The observed genotypes of the offspring at weaning (i.e., around the age of 3 weeks) are shown in the pie charts. The male and female Stxbp1tm1d/+ and Stxbp1tm1a/+ mice were significantly less than Mendelian expectations. Note that the genotypes of some female mice were not determined and therefore, they were not included in this analysis. (B) Survival curves of a subset of Stxbp1tm1d/+, Stxbp1tm1a/+, and WT mice that were monitored for 80 weeks. The numbers of observed mice are indicated in the figures. n.s., p>0.05; *, p<0.05; **, p<0.01; ****, p<0.0001.
Figure 2.
Figure 2.. Motor dysfunctions of Stxbp1 haploinsufficient mice.
(A) Representative tracking plots of the mouse positions in the open-field test. Note that Stxbp1tm1d/+ and Stxbp1tm1a/+ mice traveled less in the center (dashed box) than WT mice. (B–E) Summary data showing hyperactivity and anxiety-like behaviors of Stxbp1tm1d/+ and Stxbp1tm1a/+ mice in the open-field test. Stxbp1tm1d/+ and Stxbp1tm1a/+ mice showed an increase in the total moving distance (B) and speed (C), and a decrease in the ratio of center moving distances over total moving distance (D) and vertical activity (E). (F–H) Stxbp1tm1d/+ and Stxbp1tm1a/+ mice had weaker forelimb grip strength (F), made more foot slips per travel distance on a wire grid (G), and took more time to get down from a vertical pole (H). The numbers and ages of tested mice are indicated in the figures. Each filled (male) or open (female) circle represents one mouse. Bar graphs are mean ± s.e.m. *, p<0.05; **, p<0.01; ***, p<0.001; ****, p<0.0001.
Figure 2—figure supplement 1.
Figure 2—figure supplement 1.. Normal performance of Stxbp1tm1d/+ mice in rotarod, dowel, inverted screen, and wire hang tests.
(A) In the 2 day rotarod test, 6–7 week old Stxbp1tm1d/+ mice performed better than WT mice, as they were able to walk (left panel) and stay (right panel) on the rotating rod for longer time, probably due to their lower body weights or hyperactivity. (B,C) Similar to (A), but for the ages of 26–27 weeks (B) and 61–69 weeks (C). Stxbp1tm1d/+ mice performed similar to WT mice. (D) In the 4 day rotarod test, Stxbp1tm1d/+ mice performed similar to WT mice at the age of 10–11 weeks. (E,F) Stxbp1tm1d/+ mice could stay on the dowel (6.5- or 9.5 mm diameter) for similar amount of time as WT mice. (G,H) Stxbp1tm1d/+ mice could hang on the screen (G) or wire (H) for similar amount of time as WT mice. The numbers and ages of tested mice are indicated in the figures. Each filled (male) or open (female) circle represents one mouse. Bar graphs are mean ± s.e.m. n.s., p>0.05; *, p<0.05; **, p<0.01.
Figure 2—figure supplement 2.
Figure 2—figure supplement 2.. Stxbp1 haploinsufficient mice have normal sensory functions.
(A) Stxbp1tm1d/+ and Stxbp1tm1a/+ mice showed similar acoustic startle responses as WT mice at different sound levels. (B) In the pre-pulse inhibition test, when a weak sound (74, 78, or 82 dB) preceded a loud sound (120 dB), Stxbp1tm1d/+ and Stxbp1tm1a/+ mice showed a similar reduction in the startle responses to the loud sound as WT mice. (C) In the hot plate test, Stxbp1tm1d/+ and Stxbp1tm1a/+ mice showed similar latencies in response to the high temperature as WT mice. The numbers and ages of tested mice are indicated in the figures. Each filled (male) or open (female) circle represents one mouse. Bar graphs are mean ± s.e.m. n.s., p>0.05.
Figure 3.
Figure 3.. Impaired cognition of Stxbp1 haploinsufficient mice.
(A) In the novel object recognition test with 24 hr testing intervals, the ability of a mouse to recognize the novel object was assessed by the preference index (see Materials and methods). On days 1, 2, 3, and 5, mice were presented with the same two identical objects. In contrast to WT mice, Stxbp1tm1d/+ and Stxbp1tm1a/+ mice did not show a preference for the novel object on day 4 when they were presented with the familiar object and a novel object. (B–E) In the fear conditioning test, Stxbp1tm1d/+ and Stxbp1tm1a/+ mice at two different ages showed a reduction in both context-induced (B,D) and cue-induced (C,E) freezing behaviors 24 hr after training. The numbers and ages of tested mice are indicated in the figures. Each filled (male) or open (female) circle represents one mouse. Bar graphs are mean ± s.e.m. ***, p<0.001; ****, p<0.0001.
Figure 3—figure supplement 1.
Figure 3—figure supplement 1.. Stxbp1 haploinsufficient mice show an impairment in object recognition and fear memory, but not working memory.
(A) In the novel object recognition test with 5 min testing intervals, Stxbp1tm1d/+ mice did not show a preference for the novel object on trial four when they were presented with the familiar and novel objects. (B) In the novel object recognition test with 24 hr testing intervals (same as Figure 3A), Stxbp1tm1d/+ mice spent less time interacting with the familiar and novel objects. (C,D) In the modified novel object recognition test with 24 hr testing intervals, Stxbp1tm1d/+ mice spent similar amount of time interacting with the familiar and novel objects as WT mice (C), but they still failed to show a preference for the novel object on day 4 (D). (E) Stxbp1tm1d/+ mice showed a reduction in both contextual (left panel) and cued (right panel) fear memories 1 hr after training. (F) In the Y maze spontaneous alternation test that evaluates working memory, Stxbp1tm1d/+ mice made similar numbers of choices (left panel) and alternations (right panel) as WT mice. The numbers and ages of tested mice are indicated in the figures. Each filled (male) or open (female) circle represents one mouse. Bar graphs are mean ± s.e.m. n.s., p>0.05; *, p<0.05; **, p<0.01; ***, p<0.001; ****, p<0.0001.
Figure 4.
Figure 4.. Stxbp1 haploinsufficient mice show increased anxiety-like and repetitive behaviors.
(A,B) In the elevated plus maze test, Stxbp1tm1d/+ and Stxbp1tm1a/+ mice entered the open arms less frequently (A) and traveled shorter distance in the open arms (B). (C,D) In the light-dark chamber test, Stxbp1tm1d/+ and Stxbp1tm1a/+ mice made less transitions between the light and dark chambers (C) and traveled shorter distance in the light chamber (D). (E–G) In the hole-board test, Stxbp1tm1d/+ and Stxbp1tm1a/+ mice poked similar numbers of holes as WT mice (E) and made similar or more total nose pokes (F). They made more repetitive nose pokes (i.e.,≥2 consecutive pokes) than WT mice across different holes (G). The numbers and ages of tested mice are indicated in the figures. Each filled (male) or open (female) circle represents one mouse. Bar graphs are mean ± s.e.m. n.s., p>0.05; *, p<0.05; **, p<0.01; ***, p<0.001.
Figure 4—figure supplement 1.
Figure 4—figure supplement 1.. The movements of Stxbp1 haploinsufficient mice in elevated plus maze and light-dark chamber tests.
(A,B) In the elevated plus maze test, the total travel distances (A) and travel distances in the closed arms (B) of Stxbp1tm1d/+ and Stxbp1tm1a/+ mice were similar or slightly longer than those of WT mice. (C,D) In the light-dark chamber test, the total travel distances of Stxbp1tm1d/+ mice were reduced (C) due to the reduction of their travel distances in the light chamber and normal travel distances in the dark chamber (D). The total travel distances of Stxbp1tm1a/+ mice were normal (C) and their travel distances in the dark chamber was slightly increased as compared to WT mice (D). The numbers and ages of tested mice are indicated in the figures. Each filled (male) or open (female) circle represents one mouse. Bar graphs are mean ± s.e.m. n.s., p>0.05; *, p<0.05; **, p<0.01.
Figure 5.
Figure 5.. Stxbp1 haploinsufficient mice show increased aggressive behaviors and reduced nest building and digging behaviors.
(A–C) In the resident-intruder test, male Stxbp1tm1d/+ and Stxbp1tm1a/+ mice showed a reduction in the latency to attack the male intruder mice (A). The total duration (B) and number (C) of their attacks were increased as compared to WT mice. (D) In the tube test, Stxbp1tm1d/+ and Stxbp1tm1a/+ mice won more competitions against their WT littermates. (E) In the three-chamber test, Stxbp1tm1d/+ and Stxbp1tm1a/+ mice showed a preference in interacting with the partner mouse over the object. (F,G) Stxbp1tm1d/+ and Stxbp1tm1a/+ mice built poor quality nests. The quality of the nests was scored according to the criteria in (F) for three consecutive days (G). (H) Stxbp1tm1d/+ and Stxbp1tm1a/+ mice buried fewer marbles than WT mice. The numbers and ages of tested mice are indicated in the figures. Each filled (male) or open (female) circle represents one mouse. Bar graphs are mean ± s.e.m. *, p<0.05; **, p<0.01; ***, p<0.001; ****, p<0.0001.
Figure 5—figure supplement 1.
Figure 5—figure supplement 1.. Stxbp1 haploinsufficient mice show normal social interactions.
(A) In the partition test, Stxbp1tm1d/+ and WT mice showed a similar preference for the novel partner mouse over the familiar partner mouse. The numbers and ages of tested mice are indicated in the figures. Each filled (male) or open (female) circle represents one mouse. Bar graphs are mean ± s.e.m. n.s., p>0.05; **, p<0.01; ***, p<0.001; ****, p<0.0001.
Figure 6.
Figure 6.. Stxbp1tm1d/+ mice exhibit cortical hyperexcitability and epileptic seizures.
(A–D) Representative EEG traces of the left frontal cortex (L-FC), left somatosensory cortex (L-SC), and right somatosensory cortex (R-SC), and EMG traces of the neck muscle from WT (A,B) and Stxbp1tm1d/+ mice (C,D). Spike-wave discharges (SWDs, indicated by the blue arrows) occurred frequently and often in a cluster manner in Stxbp1tm1d/+ mice (see Video 1). The gray line-highlighted SWDs from WT and Stxbp1tm1d/+ mice were expanded to show the details of the oscillations (B,C). A long SWD (i.e.,>4 s) during REM sleep from a Stxbp1tm1d/+ mouse is shown in (D) (see Video 2). (E) Summary data showing the overall SWD frequency (left panel), duration (middle panel), and average spike rate (right panel). (F) The numbers of SWDs per hour in WT (left Y axis) and Stxbp1tm1d/+ (right Y axis) mice are plotted as a function of time of day and averaged over 3 days. (G) Video frames showing a myoclonic jump from a Stxbp1tm1d/+ mouse (see Video 3). The mouse was in REM sleep before the jump. (H) Representative EEG and EMG traces showing myoclonic jerks (indicated by the blue arrows) from a Stxbp1tm1d/+ mouse (see Video 4). Two episodes of myoclonic jerks highlighted by the gray lines were expanded to show that the EEG discharges occurred prior to (the first episode) or simultaneously with (the second episode) the EMG discharges. (I,J) Summary data showing the frequencies of two types of myoclonic seizures in different behavioral states. The numbers and ages of recorded mice are indicated in the figures. Each filled (male) or open (female) circle represents one mouse. Bar graphs are mean ± s.e.m. n.s., p>0.05; **, p<0.01; ***, p<0.001; ****, p<0.0001.
Figure 6—figure supplement 1.
Figure 6—figure supplement 1.. The clustering of SWDs in Stxbp1tm1d/+ mice does not result from a random distribution of frequent SWD episodes.
(A–C) In Stxbp1tm1d/+ mice, many SWDs occurred in a cluster manner. A SWD cluster is defined as five or more episodes of SWDs that occur with an inter-episode-interval of 60 s or less. For each Stxbp1tm1d/+ mouse, simulations were performed to determine if the clustering of SWD episodes was simply due to the overall high frequencies of episodes. The recorded episodes of SWDs from a Stxbp1tm1d/+ mouse were randomly distributed in the same period of time for 106 times. The number of SWD clusters was determined from each simulated distribution, and the results of the 106 simulations are shown as the probability distribution of the number of SWD clusters for each mouse. The vertical lines with the same color as the probability distribution curves represent the numbers of the recorded SWD clusters in each mouse. The numbers of simulated SWD clusters are all smaller than that of recorded SWD clusters for each Stxbp1tm1d/+ mouse (p<10−6), demonstrating that a random distribution of the same number of SWD episodes does not result in the same clustering of SWDs in Stxbp1tm1d/+ mice.
Figure 7.
Figure 7.. Cortical neuron densities are unaltered in Stxbp1tm1d/+ mice.
(A) Representative fluorescent images of coronal sections stained by antibodies against NeuN (blue), Pv (green), and Sst (magenta). Note the similar cytoarchitecture between WT (upper panel) and Stxbp1tm1d/+ (lower panel) mice. (B) Representative fluorescent images of the somatosensory cortices within the boxed regions in (A) for WT (upper panels) and Stxbp1tm1d/+ (lower panels) mice. (C) Summary data showing similar densities of neurons (i.e., NeuN positive cells), Pv, and Sst interneurons in the somatosensory cortices of WT and Stxbp1tm1d/+ mice. (D) Summary data showing that the ratios of Pv and Sst interneurons to all somatosensory cortical neurons are similar between WT and Stxbp1tm1d/+ mice. The numbers and ages of mice are indicated in the figures. Each filled (male) or open (female) circle represents one mouse. Bar graphs are mean ± s.e.m. n.s., p>0.05.
Figure 8.
Figure 8.. Inhibitory synapses from Pv and Sst interneurons are differentially impaired in Stxbp1tm1d/+ mice.
(A) uIPSCs of a layer 2/3 pyramidal neuron (Vm = + 10 mV) in the somatosensory cortex (upper panels) evoked by a train of 10 Hz action potentials in a nearby Pv interneuron (lower panels) from WT and Stxbp1tm1d/+ mice. 50 individual traces (lighter color) and the average trace (darker color) are superimposed. Note smaller uIPSCs in the Stxbp1tm1d/+ neuron. (B) Unitary connectivity rates from Pv interneurons to pyramidal neurons were similar between WT (27 connections out of 33 pairs) and Stxbp1tm1d/+ (26 connections out of 32 pairs) mice. (C) Cumulative frequencies of uIPSC amplitudes evoked by the first action potentials in the trains (median: WT, 217.3 pA; Stxbp1tm1d/+, 127.1 pA). Inset, each filled (male) or open (female) circle represents the uIPSC amplitude of one synaptic connection. (D) uIPSC amplitudes during the trains of action potentials were normalized by the amplitudes of the first uIPSCs. Note the similar synaptic depression between WT and Stxbp1tm1d/+ neurons. (E–H) Similar to (A–D), but for Sst interneurons. Unitary connectivity rates from Sst interneurons to pyramidal neurons (F) in Stxbp1tm1d/+ mice (25 connections out of 36 pairs) were less than WT mice (34 connections out of 36 pairs). The uIPSC amplitudes evoked by the first action potentials in the trains (G, median: 83.5 pA and 68.0 pA, respectively) and synaptic depression (H) were similar between WT and Stxbp1tm1d/+ mice. The ages of mice are indicated in the figures. Bar graphs are mean ± s.e.m. n.s., p>0.05; *, p<0.05; **, p<0.01.
Figure 8—figure supplement 1.
Figure 8—figure supplement 1.. Intrinsic neuronal excitability of Stxbp1tm1d/+ mice is slightly increased.
(A) Membrane potentials (upper panels) in response to current injections (lower panels) in layer 2/3 pyramidal neurons of the somatosensory cortex from WT and Stxbp1tm1d/+ mice. (B–D) Summary data showing that Stxbp1tm1d/+ neurons had similar resting membrane potentials and rheobase currents as WT neurons, but their input resistances were 19% larger than WT neurons. The numbers and ages of recorded neurons are indicated in the figures. Each filled (male) or open (female) circle represents one neuron. Bar graphs are mean ± s.e.m. n.s., p>0.05; *, p<0.05.
Figure 8—figure supplement 2.
Figure 8—figure supplement 2.. Spontaneous excitatory inputs onto Pv and Sst interneurons are unaltered in Stxbp1tm1d/+ mice.
(A,B) sEPSCs of a Pv (A) or Sst (B) interneuron (Vm = –70 mV) in the layer 2/3 of the somatosensory cortex from WT or Stxbp1tm1d/+ mice. (C,D) Summary data showing that the frequency and amplitude of sEPSCs in Pv (C) and Sst (D) interneurons are similar between WT and Stxbp1tm1d/+ mice. The numbers and ages of recorded neurons are indicated in the figures. Each filled (male) or open (female) circle represents one neuron. Bar graphs are mean ± s.e.m. n.s., p>0.05.
Figure 9.
Figure 9.. Pv and Sst interneurons-mediated quantal IPSCs are isolated by a novel optogenetic method and are unaltered in Stxbp1tm1d/+ mice.
(A) Schematic of slice experiments in (B). ChR2 in Pv interneurons. (B) mIPSCs in a layer 2/3 pyramidal neuron (Vm = + 10 mV) from the somatosensory cortex of WT or Stxbp1tm1d/+ mice. The intensity of blue light is indicated above the mIPSC traces. Note the increase of mIPSC frequency during blue light stimulation. The quantal IPSC trace was computed by subtracting the average mIPSC trace of the baseline period from that of the light stimulation period (bottom row). (C,D) As in (A,B), but for ChR2 in Sst interneurons. (E,F) Summary data showing that the average amplitude, charge, and decay time constant of Pv (E) or Sst (F) interneuron-mediated quantal IPSCs are similar between WT and Stxbp1tm1d/+ mice. The numbers and ages of recorded neurons are indicated in the figures. Each filled (male) or open (female) circle represents one neuron. Bar graphs are mean ± s.e.m. n.s., p>0.05.
Figure 9—figure supplement 1.
Figure 9—figure supplement 1.. Ramping down blue light intensity minimizes the tonic currents during optogenetic activation of interneurons.
(A) Schematic of slice experiments in (B,C). ChR2 in Pv interneurons. (B,C) mIPSCs of the same layer 2/3 pyramidal neuron (Vm = + 10 mV) from the somatosensory cortex of a WT mouse. The intensity of blue light is indicated above the mIPSC traces. Note the increase of tonic currents (i.e., the increase of holding currents) caused by the constant blue light stimulation (B), which was reduced by gradually decreasing the blue light intensity (C).

References

    1. Allen AS, Berkovic SF, Cossette P, Delanty N, Dlugos D, Eichler EE, Epstein MP, Glauser T, Goldstein DB, Han Y, Heinzen EL, Hitomi Y, Howell KB, Johnson MR, Kuzniecky R, Lowenstein DH, Lu YF, Madou MR, Marson AG, Mefford HC, Esmaeeli Nieh S, O'Brien TJ, Ottman R, Petrovski S, Poduri A, Ruzzo EK, Scheffer IE, Sherr EH, Yuskaitis CJ, Abou-Khalil B, Alldredge BK, Bautista JF, Berkovic SF, Boro A, Cascino GD, Consalvo D, Crumrine P, Devinsky O, Dlugos D, Epstein MP, Fiol M, Fountain NB, French J, Friedman D, Geller EB, Glauser T, Glynn S, Haut SR, Hayward J, Helmers SL, Joshi S, Kanner A, Kirsch HE, Knowlton RC, Kossoff EH, Kuperman R, Kuzniecky R, Lowenstein DH, McGuire SM, Motika PV, Novotny EJ, Ottman R, Paolicchi JM, Parent JM, Park K, Poduri A, Scheffer IE, Shellhaas RA, Sherr EH, Shih JJ, Singh R, Sirven J, Smith MC, Sullivan J, Lin Thio L, Venkat A, Vining EP, Von Allmen GK, Weisenberg JL, Widdess-Walsh P, Winawer MR, Epi4K Consortium, Epilepsy Phenome/Genome Project De novo mutations in epileptic encephalopathies. Nature. 2013;501:217–221. doi: 10.1038/nature12439. - DOI - PMC - PubMed
    1. Antunes M, Biala G. The novel object recognition memory: neurobiology, test procedure, and its modifications. Cognitive Processing. 2012;13:93–110. doi: 10.1007/s10339-011-0430-z. - DOI - PMC - PubMed
    1. Arain FM, Boyd KL, Gallagher MJ. Decreased viability and absence-like epilepsy in mice lacking or deficient in the GABAA receptor α1 subunit. Epilepsia. 2012;53:e161–e165. doi: 10.1111/j.1528-1167.2012.03596.x. - DOI - PMC - PubMed
    1. Avanzini G, Shibasaki H, Rubboli G, Canafoglia L, Panzica F, Franceschetti S, Hallett M. Neurophysiology of myoclonus and progressive myoclonus epilepsies. Epileptic Disorders. 2016;18:11–27. doi: 10.1684/epd.2016.0835. - DOI - PubMed
    1. Baker K, Gordon SL, Grozeva D, van Kogelenberg M, Roberts NY, Pike M, Blair E, Hurles ME, Chong WK, Baldeweg T, Kurian MA, Boyd SG, Cousin MA, Raymond FL. Identification of a human synaptotagmin-1 mutation that perturbs synaptic vesicle cycling. Journal of Clinical Investigation. 2015;125:1670–1678. doi: 10.1172/JCI79765. - DOI - PMC - PubMed

Publication types