. 2020 Mar 1;142(3):0310061-03100613.
doi: 10.1115/1.4046393.

Head Rotational Kinematics, Tissue Deformations, and Their Relationships to the Acute Traumatic Axonal Injury

Affiliations

Head Rotational Kinematics, Tissue Deformations, and Their Relationships to the Acute Traumatic Axonal Injury

Marzieh Hajiaghamemar et al. J Biomech Eng. .

Abstract

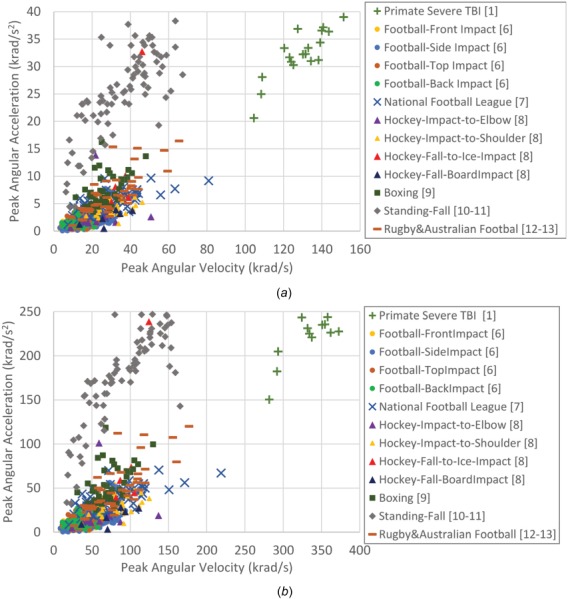
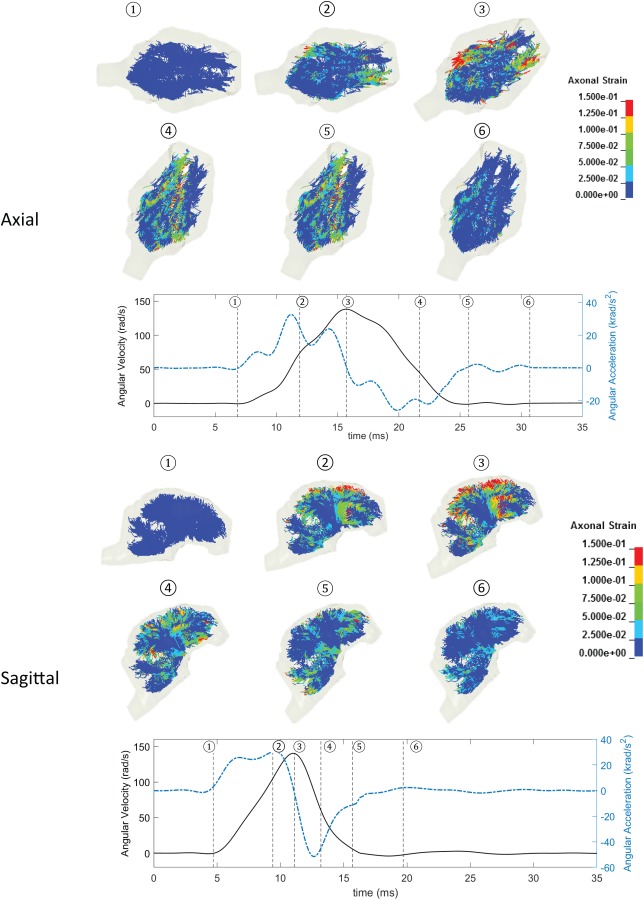
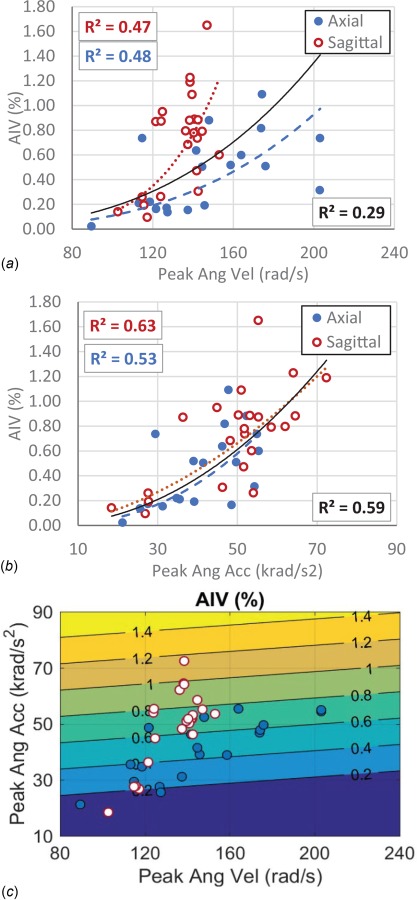
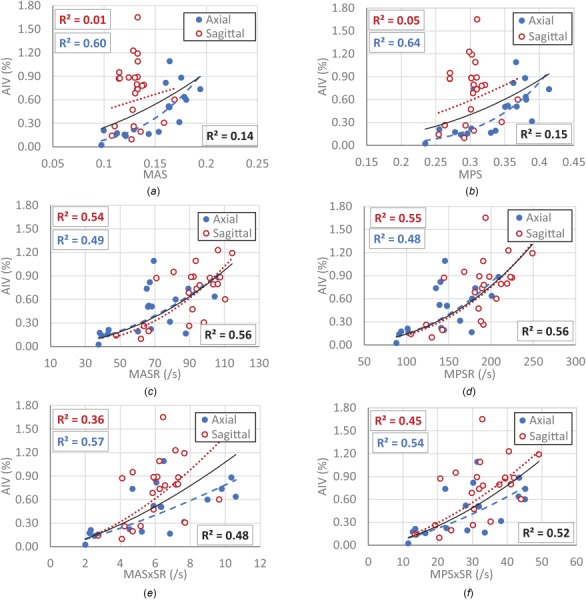
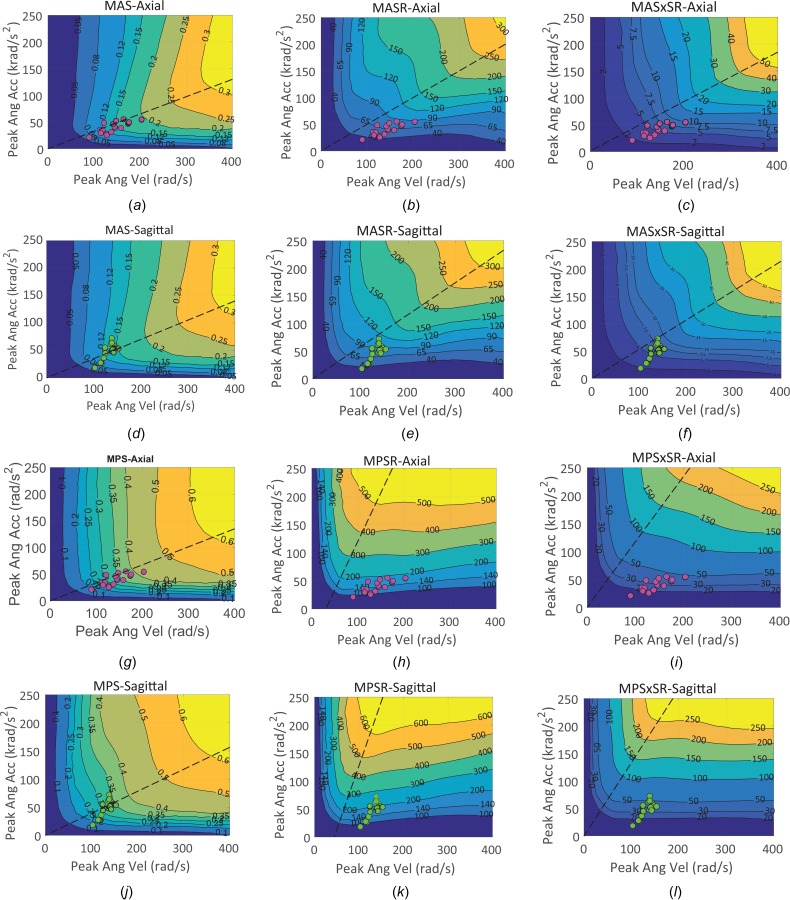
Head rotational kinematics and tissue deformation metrics obtained from finite element models (FEM) have the potential to be used as traumatic axonal injury (TAI) assessment criteria and headgear evaluation standards. These metrics have been used to predict the likelihood of TAI occurrence; however, their ability in the assessment of the extent of TAI has not been explored. In this study, a pig model of TAI was used to examine a wide range of head loading conditions in two directions. The extent of TAI was quantified through histopathology and correlated to the FEM-derived tissue deformations and the head rotational kinematics. Peak angular acceleration and maximum strain rate of axonal fiber and brain tissue showed relatively good correlation to the volume of axonal injury, with similar correlation trends for both directions separately or combined. These rotational kinematics and tissue deformations can estimate the extent of acute TAI. The relationships between the head kinematics and the tissue strain, strain rate, and strain times strain rate were determined over the experimental range examined herein, and beyond that through parametric simulations. These relationships demonstrate that peak angular velocity and acceleration affect the underlying tissue deformations and the knowledge of both help to predict TAI risk. These relationships were combined with the injury thresholds, extracted from the TAI risk curves, and the kinematic-based risk curves representing overall axonal and brain tissue strain and strain rate were determined for predicting TAI. After scaling to humans, these curves can be used for real-time TAI assessment.


Figures

Fig. 1
Fig. 1
Examples of sport- or fall-related human head impact kinematics measured on-field [6,7,9] or reconstructed in laboratory [,–13] and primate TBI experiments that were previously performed for severe diffuse axonal injury [1] in (a) human scale and (b) all mass scaled to pig
Fig. 2
Fig. 2
Peak angular velocity and peak angular acceleration values for the axial (n = 19) and sagittal (n = 23) pig TBI animal experiments selected for this study
Fig. 3
Fig. 3
Spatial distribution of axonal fiber strains for an axial (top) and a sagittal (bottom) pig experiments with similar peak angular velocity conditions at six times frame throughout the whole-time window of simulations. Angular velocity traces (black solid lines) and angular acceleration traces (blue dashed lines) along with the six-time frames (dotted straight lines) are shown for these two examples.
Fig. 4
Fig. 4
(a) An example of the angular velocity and angular acceleration time histories of the idealized loadings used for FEM parametric simulations. (b) The range and distribution of loading matrix selected for the parametric simulations in this study.
Fig. 5
Fig. 5
Correlation analysis between traumatic AIV and kinematic metrics including (a) peak angular velocity, (b) peak angular acceleration, and (c) combination of peak angular velocity and peak angular acceleration. The curves in graphs a and b represent the best power-fitting functions for the axial direction data (blue dashed curve), sagittal direction data (red dotted curve), and both directions combined (black solid curve). Coefficients of the power-fitting functions are also depicted in boxes in the graphs for whole dataset (right-bottom, in black), axial data (left-bottom, in blue), and sagittal data (left-top, in red). The function of the fitted AIV lines and the coefficient of correlation (R 2) in graph c are as follows: AIV (Peak Ang Vel, Peak Ang Acc) = -0.2265 - 0.00117* Peak Ang Vel + 0.02128* Peak Ang Acc), R 2 = 0.52.
Fig. 6
Fig. 6
Correlation between traumatic AIV and FE-derived metrics including (a) MAS, (b) MPS, (c) MASR, (d) MPSR, (e) MASxSR, (f) MPSxSR. The curves in each graph represent the best power-fitting functions for the whole data combined (black solid curve), data with axial rotation (blue dashed curve), and data with sagittal rotation (red dotted curve). The square of the correlation coefficients (R 2) showing the goodness of fit of the power-fitting functions are also depicted in boxes in the graphs for whole dataset (right-bottom, in black), axial data (left-bottom, in blue), and sagittal data (left-top, in red).
Fig. 7
Fig. 7
Correlation between FE-derived metrics including ((a) and (d)) MAS, ((b) and (e)) MASR, ((c) and (f)) MASxSR, ((g) and (j)) MPS, ((h) and (k)) MPSR, and ((i) and (l)) MPSxSR and rotational kinematic metrics including peak angular velocity and peak angular acceleration for axial (blue dashed lines) and sagittal (red dotted lines) rotational directions. The goodness of the fit (R 2) are depicted in the boxes in the graphs for axial data (left-bottom boxes, in blue) and sagittal data (left-top boxes, in red).
Fig. 8
Fig. 8
Relationships between the FE-derived tissue deformation metrics including MAS, MASR, MASxSR, MPS, MPSR, and MPSxSR and head kinematic parameters including peak angular acceleration and peak angular velocity for axial ((a)–(c) and (g)–(i)) and sagittal directions ((d)–(f), and (j)–(l)). The axial (pink markers) and sagittal (green markers) pig TBI experiments were also shown on the tissue deformation contours. An approximate partitioning line around which the concavity of the contour lines changed was drawn with black dashed line in each plot.
Fig. 9
Fig. 9
The FEM-derived tissue deformation inspired kinematic based TAI risk curves. The curves in each graph represent the 10%, 25%, 50%, 75%, and 90% likelihood of TAI based on (a) MAS, (b) MPS, (c) MASR, (d) MPSR, (e) MASxSR, and (f) MPSxSR and tissue deformation metrics for sagittal (red solid lines) and axial (blue dashed lines) rotational directions.
Fig. 10
Fig. 10
50% tissue deformation inspired kinematic-based TAI injury risk curve as a function of peak angular acceleration and peak angular velocity derived based on axonal fiber deformation metrics (left plots) including MAS (solid line), MASR (dashed), and MASxSR (dashed–dotted) and brain tissue deformation metrics including MPS (solid line), MPSR (dashed), and MPSxSR (dashed–dotted) for pig. Similar curves for human were generated by mass scaling of pig to human kinematics. In all plots, the solid gray areas illustrate the kinematic conditions that passed 50% risk of TAI using both strain and strain-rate tissue deformation metrics and patterned areas illustrate the areas that strain and strain-rate metrics predict injury differently.

References

    1. Margulies, S. S. , and Thibault, L. E. , 1992, “A Proposed Tolerance Criterion for Diffuse Axonal Injury in Man,” J. Biomech., 25(8), pp. 917–923.10.1016/0021-9290(92)90231-O - DOI - PubMed
    1. Bar-Kochba, E. , Scimone, M. T. , Estrada, J. B. , and Franck, C. , 2016, “Strain and Rate-Dependent Neuronal Injury in a 3D In Vitro Compression Model of Traumatic Brain Injury,” Sci. Rep., 6(1), p. 30550.10.1038/srep30550 - DOI - PMC - PubMed
    1. Cullen, D. K. , Simon, C. M. , and LaPlaca, M. C. , 2007, “Strain Rate-Dependent Induction of Reactive Astrogliosis and Cell Death in Three-Dimensional Neuronal–Astrocytic Co-Cultures,” Brain Res., 1158, pp. 103–115.10.1016/j.brainres.2007.04.070 - DOI - PMC - PubMed
    1. Nakadate, H. , Kurtoglu, E. , Furukawa, H. , Oikawa, S. , Aomura, S. , Kakuta, A. , and Matsui, Y. , 2017, “Strain-Rate Dependency of Axonal Tolerance for Uniaxial Stretching,” SAE Paper No. 2017-22-0003.https://www.ncbi.nlm.nih.gov/pubmed/29394435 - PubMed
    1. Singh, A. , 2017, “Extent of Impaired Axoplasmic Transport and Neurofilament Compaction in Traumatically Injured Axon at Various Strains and Strain Rates,” Brain Injury, 31(10), pp. 1387–1395.10.1080/02699052.2017.1321781 - DOI - PubMed

Publication types

LinkOut - more resources