

Dose-Response Relation between Tea Consumption and Risk of Cardiovascular Disease and All-Cause Mortality: A Systematic Review and Meta-Analysis of Population-Based Studies
- PMID: 32073596
- PMCID: PMC7360449
- DOI: 10.1093/advances/nmaa010
Dose-Response Relation between Tea Consumption and Risk of Cardiovascular Disease and All-Cause Mortality: A Systematic Review and Meta-Analysis of Population-Based Studies
Abstract
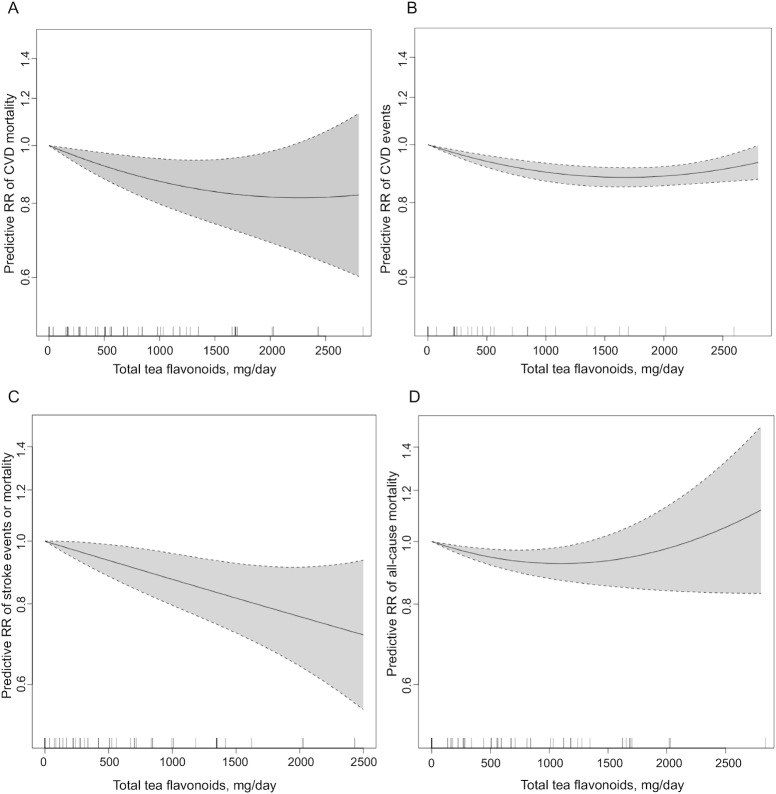
Tea flavonoids have been suggested to offer potential benefits to cardiovascular health. This review synthesized the evidence on the relation between tea consumption and risks of cardiovascular disease (CVD) and all-cause mortality among generally healthy adults. PubMed, EMBASE, Web of Science, Cochrane Central Register of Controlled Trials, Food Science and Technology Abstracts, and Ovid CAB Abstract databases were searched to identify English-language publications through 1 November 2019, including randomized trials, prospective cohort studies, and nested case-control (or case-cohort) studies with data on tea consumption and risk of incident cardiovascular events (cardiac or peripheral vascular events), stroke events (including mortality), CVD-specific mortality, or all-cause mortality. Data from 39 prospective cohort publications were synthesized. Linear meta-regression showed that each cup (236.6 mL) increase in daily tea consumption (estimated 280 mg and 338 mg total flavonoids/d for black and green tea, respectively) was associated with an average 4% lower risk of CVD mortality, a 2% lower risk of CVD events, a 4% lower risk of stroke, and a 1.5% lower risk of all-cause mortality. Subgroup meta-analysis results showed that the magnitude of association was larger in elderly individuals for both CVD mortality (n = 4; pooled adjusted RR: 0.89; 95% CI: 0.83, 0.96; P = 0.001), with large heterogeneity (I2 = 72.4%), and all-cause mortality (n = 3; pooled adjusted RR: 0.92; 95% CI: 0.90, 0.94; P < 0.0001; I2 = 0.3%). Generally, studies with higher risk of bias appeared to show larger magnitudes of associations than studies with lower risk of bias. Strength of evidence was rated as low and moderate (depending on study population age group) for CVD-specific mortality outcome and was rated as low for CVD events, stroke, and all-cause mortality outcomes. Daily tea intake as part of a healthy habitual dietary pattern may be associated with lower risks of CVD and all-cause mortality among adults.
Keywords: Camellia sinensis; all-cause mortality; cardiovascular disease; systematic review; tea.
Copyright © The Author(s) on behalf of the American Society for Nutrition 2020.
Figures


References
-
- Haufe TC, Ho KKHY, Ferruzzi MG, Neilson AP. Potential health effects of tea. Nutrition Today. 2018;53(5):213–28.
-
- McKay DL, Blumberg JB. The role of tea in human health: an update. J Am Coll Nutr. 2002;21(1):1–13. - PubMed
-
- Song WO, Chun OK. Tea is the major source of flavan-3-ol and flavonol in the U.S. diet. J Nutr. 2008;138(8):1543S–7S. - PubMed
-
- Hodgson JM, Croft KD. Tea flavonoids and cardiovascular health. Mol Aspects Med. 2010;31(6):495–502. - PubMed
-
- Wang ZM, Zhou B, Wang YS, Gong QY, Wang QM, Yan JJ, Gao W, Wang LS. Black and green tea consumption and the risk of coronary artery disease: a meta-analysis. Am J Clin Nutr. 2011;93(3):506–15. - PubMed
Publication types
MeSH terms
Substances
LinkOut - more resources
Full Text Sources
Other Literature Sources
Medical
