

doi: 10.1056/NEJMc2001737.
Epub 2020 Feb 19.
SARS-CoV-2 Viral Load in Upper Respiratory Specimens of Infected Patients
Affiliations
- PMID: 32074444
- PMCID: PMC7121626
- DOI: 10.1056/NEJMc2001737
Item in Clipboard
SARS-CoV-2 Viral Load in Upper Respiratory Specimens of Infected Patients
N Engl J Med.
.
No abstract available
Figures
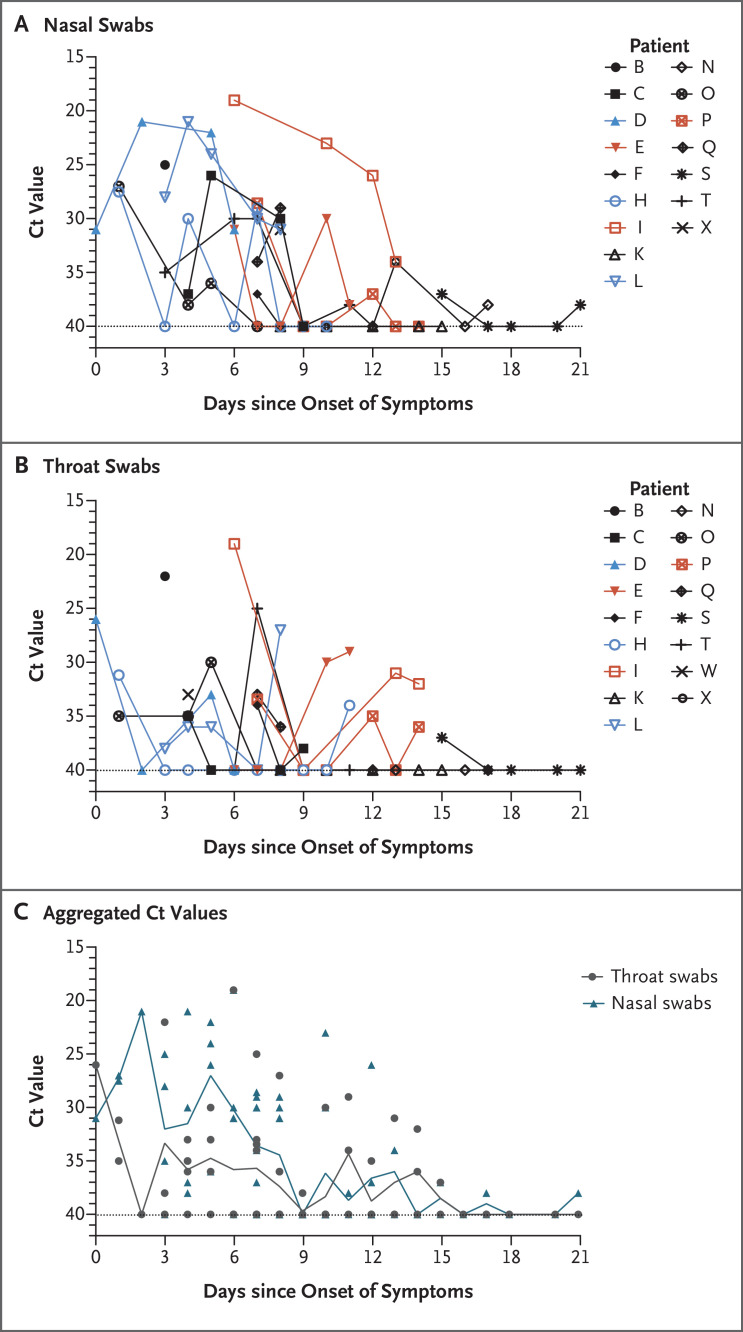
Panel A shows cycle threshold (Ct) values of Orf1b on reverse-transcriptase–polymerase-chain-reaction (RT-PCR) assay that were detected in nasal swabs obtained from 14 patients with imported cases and 3 patients with secondary cases, and Panel B shows the Ct values in throat swabs. Patient Z did not have clinical symptoms and is not included in the figure. Patients with imported cases who had severe illness (Patients E, I, and P) are labeled in red, patients with imported cases who had mild-to-moderate illness are labeled in black, and patients with secondary cases (Patients D, H, and L) are labeled in blue. A linear mixed-effects model was used to test the Ct values from nasal and throat swabs among severe as compared with mild-to-moderate imported cases, which allowed for within-patient correlation and a time trend of Ct change. The mean Ct values in nasal and throat swabs obtained from patients with severe cases were lower by 2.8 (95% confidence interval [CI], −2.4 to 8.0) and 2.5 (95% CI, −0.8 to 5.7), respectively, than the values in swabs obtained from patients with mild-to-moderate cases. Panel C shows the aggregated Ct values of Orf1b on RT-PCR assay in 14 patients with imported cases and 3 patients with secondary cases, according to day after symptom onset. Ct values are inversely related to viral RNA copy number, with Ct values of 30.76, 27.67, 24.56, and 21.48 corresponding to 1.5×10⁴, 1.5×10⁵, 1.5×10⁶, and 1.5×10⁷ copies per milliliter. Negative samples are denoted with a Ct of 40, which was the limit of detection.
Comment in
-
Profile of specific antibodies to SARS-CoV-2: The first report.J Infect. 2020 Jul;81(1):147-178. doi: 10.1016/j.jinf.2020.03.012. Epub 2020 Mar 21. J Infect. 2020. PMID: 32209385 Free PMC article. No abstract available.
-
SARS-CoV-2 Viral Load in Clinical Samples from Critically Ill Patients.Am J Respir Crit Care Med. 2020 Jun 1;201(11):1435-1438. doi: 10.1164/rccm.202003-0572LE. Am J Respir Crit Care Med. 2020. PMID: 32293905 Free PMC article. No abstract available.
-
Head and neck cancer cannot wait for this pandemic to end: Risks, challenges and perspectives of oral-maxillofacial surgeon during COVID-19.Oral Oncol. 2020 Jul;106:104758. doi: 10.1016/j.oraloncology.2020.104758. Epub 2020 May 1. Oral Oncol. 2020. PMID: 32389540 Free PMC article. No abstract available.
-
Do Disinfectant Solutions during Gargling Reach the Pharynx?Folia Phoniatr Logop. 2024;76(1):102-108. doi: 10.1159/000533135. Epub 2023 Aug 4. Folia Phoniatr Logop. 2024. PMID: 37544306
References
-
- Summary of probable SARS cases with onset of illness from 1 November 2002 to 31 July 2003. Geneva: World Health Organization, 2004 (https://www.who.int/csr/sars/country/table2004_04_21/en/).
Publication types
MeSH terms
LinkOut - more resources
Full Text Sources
Other Literature Sources
Medical
Miscellaneous