. 2020 Feb;128(2):27006.
doi: 10.1289/EHP6233. Epub 2020 Feb 13.

Evaluation of Maternal, Embryo, and Placental Effects in CD-1 Mice following Gestational Exposure to Perfluorooctanoic Acid (PFOA) or Hexafluoropropylene Oxide Dimer Acid (HFPO-DA or GenX)

Affiliations

Evaluation of Maternal, Embryo, and Placental Effects in CD-1 Mice following Gestational Exposure to Perfluorooctanoic Acid (PFOA) or Hexafluoropropylene Oxide Dimer Acid (HFPO-DA or GenX)

Bevin E Blake et al. Environ Health Perspect. 2020 Feb.

Abstract

Background: Perfluorooctanoic acid (PFOA) is a poly- and perfluoroalkyl substance (PFAS) associated with adverse pregnancy outcomes in mice and humans, but little is known regarding one of its replacements, hexafluoropropylene oxide dimer acid (HFPO-DA, referred to here as GenX), both of which have been reported as contaminants in drinking water.

Objectives: We compared the toxicity of PFOA and GenX in pregnant mice and their developing embryo-placenta units, with a specific focus on the placenta as a hypothesized target.

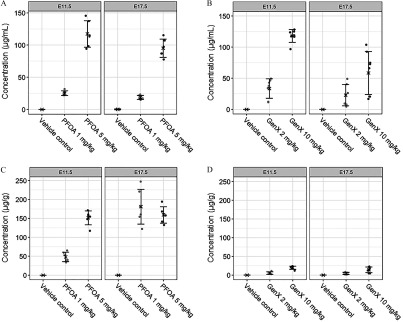
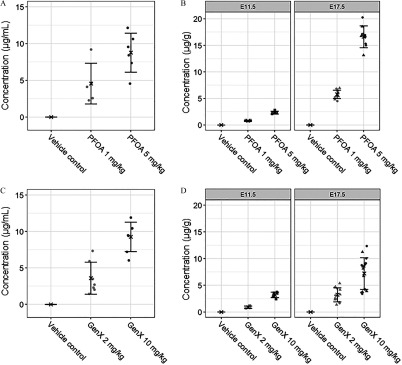
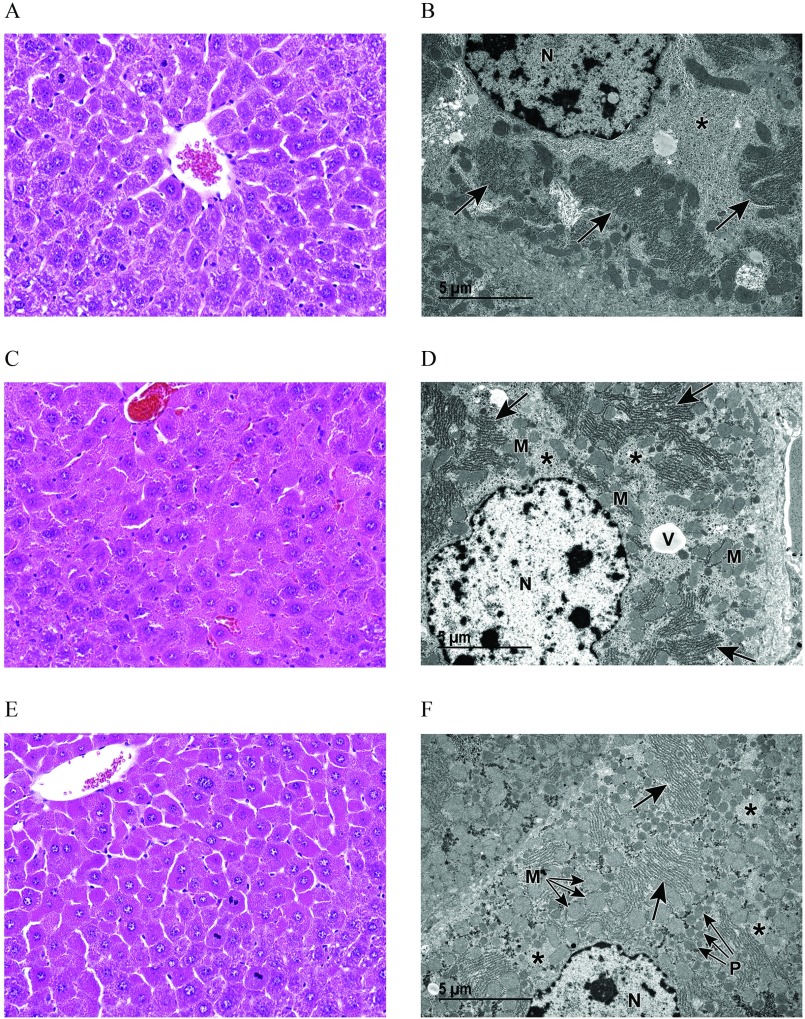
Methods: Pregnant CD-1 mice were exposed daily to PFOA (0, 1, or 5mg/kg) or GenX (0, 2, or 10mg/kg) via oral gavage from embryonic day (E) 1.5 to 11.5 or 17.5 to evaluate exposure effects on the dam and embryo-placenta unit. Gestational weight gain (GWG), maternal clinical chemistry, maternal liver histopathology, placental histopathology, embryo weight, placental weight, internal chemical dosimetry, and placental thyroid hormone levels were determined.

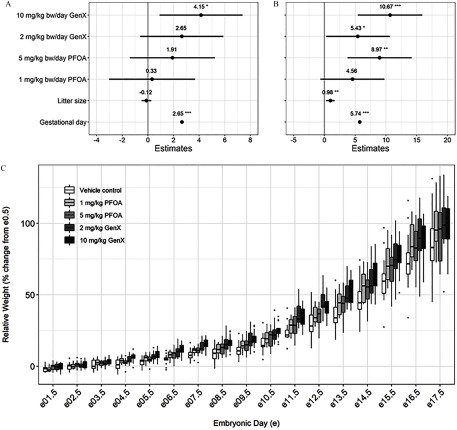
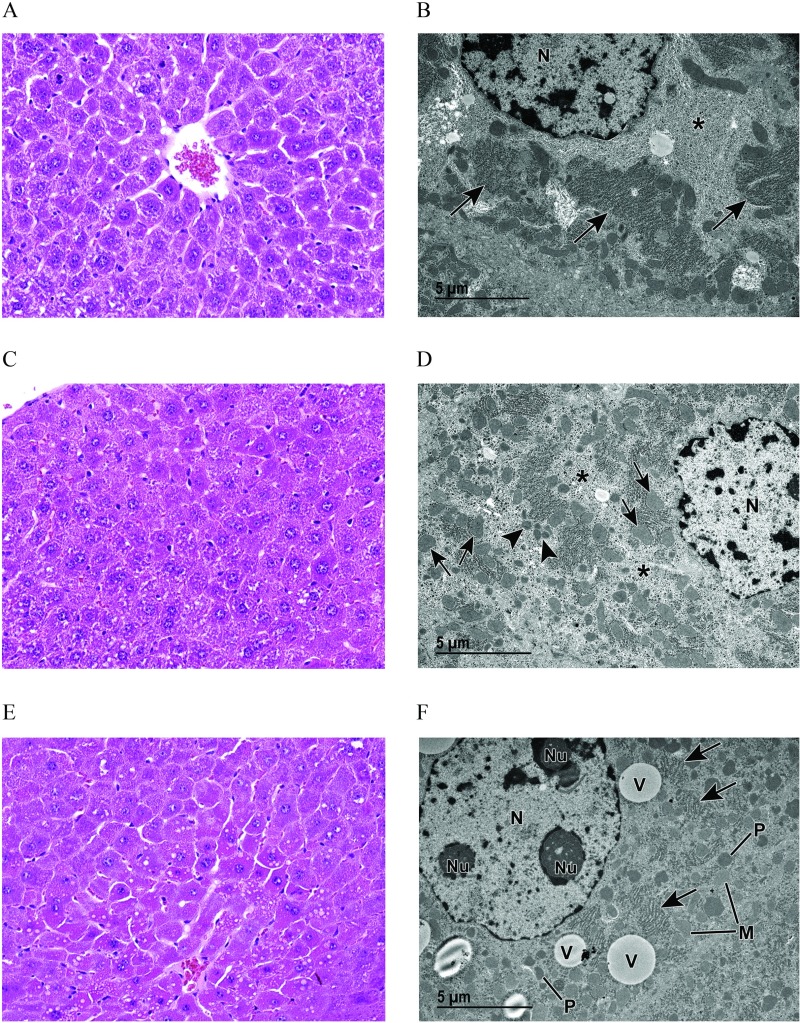
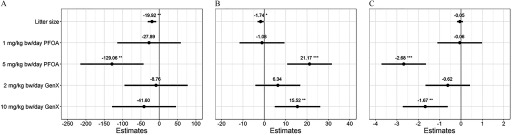
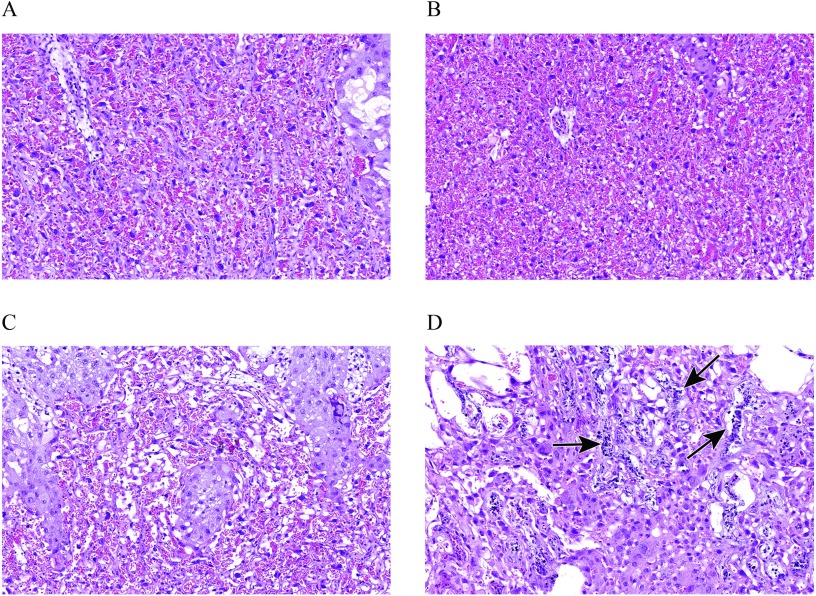
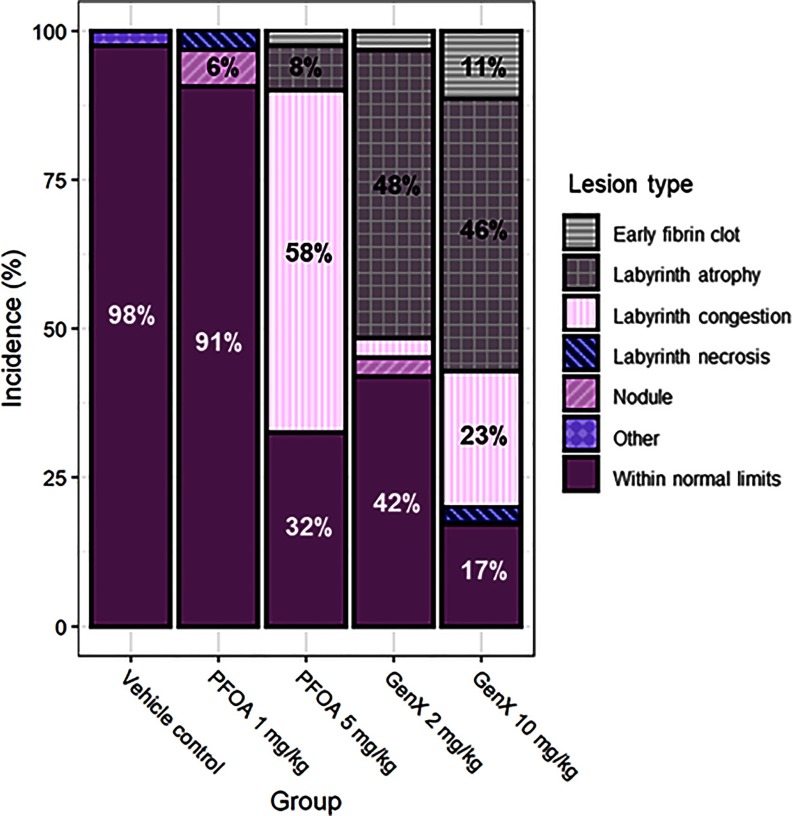
Results: Exposure to GenX or PFOA resulted in increased GWG, with increase in weight most prominent and of shortest latency with 10mg/kg/d GenX exposure. Embryo weight was significantly lower after exposure to 5mg/kg/d PFOA (9.4% decrease relative to controls). Effect sizes were similar for higher doses (5mg/kg/d PFOA and 10mg/kg/d GenX) and lower doses (1mg/kg/d PFOA and 2mg/kg/d GenX), including higher maternal liver weights, changes in liver histopathology, higher placental weights and embryo-placenta weight ratios, and greater incidence of placental abnormalities relative to controls. Histopathological features in placentas suggested that PFOA and GenX may exhibit divergent mechanisms of toxicity in the embryo-placenta unit, whereas PFOA- and GenX-exposed livers shared a similar constellation of adverse pathological features.

Conclusions: Gestational exposure to GenX recapitulated many documented effects of PFOA in CD-1 mice, regardless of its much shorter reported half-life; however, adverse effects toward the placenta appear to have compound-specific signatures. https://doi.org/10.1289/EHP6233.


Figures

Figures 1A and 1C are two-part graphs each, plotting concentration in micrograms per milliliter, ranging from 0 to 150 in increments of 50 and concentration in micrograms per grams, ranging from 0 to 250 in increments of 50, respectively, (y-axis) for E11.5 and E17.5 across vehicle control, PFOA 1 milligram per kilogram, and PFOA 5 milligrams per kilogram (x-axis). Figures 1B and 1D are two-part graphs each, plotting concentration in micrograms per milliliter, ranging from 0 to 150 in increments of 50 and concentration in micrograms per grams, ranging from 0 to 250 in increments of 50, respectively, (y-axis) for E11.5 and E17.5 across vehicle control, GenX 2 milligrams per kilogram, and GenX 10 milligrams per kilogram (x-axis).
Figure 1.
Internal dosimetry of perfluorooctanoic acid (PFOA) and GenX [hexafluoropropylene oxide dimer acid (HFPO-DA)] in maternal serum and liver at embryonic day (E) 11.5 and E17.5. (A) Maternal serum concentration (microgram PFOA per milliliter serum) at E11.5 and E17.5, (B) maternal serum concentration (microgram GenX per milliliter serum) at E11.5 and E17.5, (C) maternal liver concentration (microgram PFOA per gram liver) at E11.5 and E17.5, and (D) maternal liver concentration (microgram GenX per gram liver) at E11.5 and E17.5 were determined by high-performance liquid chromatography–tandem mass spectrometry. Treatment group mean values are denoted with an “X” flanked above and below by error bars showing standard deviation, and individual data points are shown as gray circles (n=68). Vehicle control (VC) samples were quantified for PFOA and GenX; all VC means were below the limit of detection (LOD) of 10  ng/mL for both PFOA and GenX except for maternal serum (0.211±0.55μg/mL). Statistical comparisons of internal dosimetry across all treatment groups are shown in Tables S2 and S3.
Figures 2A and 2C are graphs, plotting concentration in micrograms per milliliter, ranging from 0 to 15 in increments of 5 (y-axis) across vehicle control, PFOA 1 milligram per kilogram, PFOA 5 milligrams per kilogram and vehicle control, GenX 2 milligrams per kilogram, GenX 10 milligrams per kilogram, respectively, (x-axis). Figures 2B and 2D are two-part graphs each, plotting concentration in micrograms per grams, ranging from 0 to 20 in increments of 5 (y-axis) for E11.5 and E17.5 across vehicle control, PFOA 1 milligram per kilogram, PFOA 5 milligrams per kilogram and vehicle control, GenX 2 milligrams per kilogram, GenX 10 milligrams per kilogram, respectively, (x-axis).
Figure 2.
Internal dosimetry of perfluorooctanoic acid (PFOA) and GenX [hexafluoropropylene oxide dimer acid (HFPO-DA)] in amniotic fluid and whole embryos. (A) Amniotic fluid concentration (microgram PFOA per milliliter amniotic fluid) at embryonic day (E) 11.5, (B) whole-embryo concentration (microgram PFOA per gram embryo) at E11.5 and E17.5, (C) amniotic fluid concentration (microgram GenX per milliliter amniotic fluid) at E11.5, and (D) whole-embryo concentration (microgram GenX per gram embryo) at E11.5 and E17.5 were determined by high-performance liquid chromatography–tandem mass spectrometry. Treatment group mean values are denoted with an “X” flanked above and below by error bars showing standard deviation, and individual data points are shown as gray squares, circles, or triangles (n=68). Triangles, E17.5 male embryos; circles, E17.5 female embryos; squares, pooled E11.5 embryos (B and D). Vehicle control (VC) samples were quantified for PFOA and GenX; all VC means were below the limit of detection (LOD) of 10  ng/mL for both PFOA and GenX. Statistical comparisons of internal dosimetry across all treatment groups are shown in Tables S2 and S3.
Figures 3A and 3B are graphs, plotting estimates, ranging from negative 4 to 8 in increments of 2 and from negative 5 to 20 in increments of 5 (y-axis) across gestational day, litter size, 1 milligram per kilogram per bw per day PFOA, 5 milligrams per kilogram bw per day PFOA, 2 milligrams per kilogram bw per day GenX, 10 milligrams per kilogram bw per day GenX (x-axis). Figure 3C is a box and whisker plot, plotting relative weight percentage change from embryonic day (e) 0.5, ranging from 0 to 100 in increments of 50 (y-axis) for vehicle control, 1 milligram per kilogram PFAO, 5 milligrams per kilogram PFOA, 2 milligrams per kilogram GenX, and 10 milligrams per kilogram GenX across embryonic day, ranging from e01.5 to e17.5 (x-axis).
Figure 3.
Gestational weight gain (GWG) repeated-measure, mixed-effect model estimates for pregnant dams exposed to perfluorooctanoic acid (PFOA) and GenX [hexafluoropropylene oxide dimer acid (HFPO-DA)]. Effect estimates for pregnant dams exposed through embryonic day 11.5 (A) or 17.5 (B) are centered around the vehicle control group (y=0) and show the point estimate of the relative change in dam weight (percent change from E0.5) with 95% confidence intervals (CIs). (C) Boxplots of relative weight gain over time, with the upper and lower hinges corresponding to the first and third quartiles (25th and 75th percentiles), the middle hinge corresponding to the median, and the upper whisker extending to the highest value that is within 1.5 times the distance between the first and third quartiles [interquartile range (IQR)] of the hinge and the lower whisker extending to the lowest value within 1.5 times the IQR of the hinge. n=1113 dams per treatment group. *p<0.05. **p<0.01. ***p<0.001. Beta estimate 95% confidence intervals do not overlap zero. [Repeated-measures mixed-effect model adjusting a priori for litter size and gestational (embryonic) day as fixed effects and the dam as a random effect, vehicle control as reference group].
Figures 4A, 4C, and 4E are light microscopic representations, and 4B, 4D, and 4F are transmission microscopic representations of liver from vehicle control and PFOA-exposed pregnant dams.
Figure 4.
Light and transmission electron microscopy (TEM) of liver from vehicle control (VC) and perfluorooctanoic acid (PFOA)–exposed pregnant dams at embryonic day (E) 17.5. (A) Light microscopic image at 40× magnification of liver from a VC pregnant dam (control) showing centrilobular hepatocellular hypertrophy with karyomegaly, increased basophilic granular cytoplasm, and decreased glycogen. (B) Corresponding TEM magnification shows prominent rough endoplasmic reticulum (arrows) with abundant ribosomes and evenly dispersed, abundant glycogen (asterisk) (see Figure S2A). (C) Light microscopic image at 40× magnification of liver from a pregnant dam at E17.5 and treated with 1mg/kg/d PFOA. (D) Although this liver appears to be within normal limits when viewed with light microscopy, TEM reveals an increase in scattered vacuoles (see Figure S2B); decreased, evenly dispersed glycogen (asterisks); as well as abundant mitochondria (arrows) and peroxisomes (arrowheads). (E) Light microscopic image at 40× magnification of liver from a pregnant dam at E17.5 and treated with 5mg/kg/d PFOA. Increased cytoplasmic vacuoles are evident at this light microscopic level. (F) TEM reveals abundant cytoplasmic organelles consistent with mitochondria (M) and peroxisomes (P), extensive vacuoles (V), less prominent rough endoplasmic reticulum (arrows) with fewer ribosomes and less abundant glycogen (see Figure S2C,S2D). Note: N, nucleus; NU, nucleolus; TEM, transmission electron microscopy.
Figures 5A, 5C, and 5E are light microscopic representations, and 5B, 5D, and 5F are transmission microscopic representations of liver from vehicle control and GenX-exposed pregnant dams
Figure 5.
Light and transmission electron microscopy (TEM) of liver from vehicle control (VC) and GenX-exposed pregnant dams at embryonic day (E) 17.5. (A) Light microscopic image at 40× magnification of liver from a VC pregnant dam showing centrilobular hepatocellular hypertrophy with karyomegaly, increased basophilic granular cytoplasm, and decreased glycogen. (B) Corresponding medium TEM magnification shows prominent rough endoplasmic reticulum (arrows) with abundant ribosomes and evenly dispersed, abundant glycogen (asterisk) (see Figure S2A). (C) Light microscopy at 40× magnification, and (D) transmission electron microscopy of liver from a pregnant dam at E17.5 treated with 2mg/kg/d GenX [hexafluoropropylene oxide dimer acid (HFPO-DA)] or 10mg/kg/d GenX (E and F). Marked cytoplasmic alteration is evident in (C) and (E). TEM (D and F; see Figure S2E and S2F, respectively) reveals an abundance of cytoplasmic organelles, consistent with mitochondria (M) and peroxisomes (P) that increase with increasing dose (D compared to F). Note also the decreased glycogen (asterisks) as well as the vacuole (V) and rough endoplasmic reticulum (arrows). N, nucleus.
Figures 6A, 6B, and 6C are graphs, plotting estimates, ranging from negative 250 to 100 in increments of 50; negative 20 to 40 in increments of 10; and negative 4 to 2, respectively, (y-axis) across 10 milligrams per kilogram bw per day GenX, 2 milligrams per kilogram bw per day GenX, 5 milligrams per kilogram bw per day PFOA, 1 milligram per kilogram bw per day PFOA, and litter size (x-axis).
Figure 6.
Mixed-effect model estimates for (A) embryo weight (mg), (B) placental weight (mg), and (C) embryo:placenta weight ratios (mg:mg) after exposure in utero to perfluorooctanoic acid (PFOA) or GenX [hexafluoropropylene oxide dimer acid (HFPO-DA)] at embryonic day (E) 17.5. Effect estimates are centered around the vehicle control group (y=0) and show the point estimate of the relative change in weight (in milligrams; A and B) or weight ratio (mg:mg; C) with 95% confidence intervals (CIs). *p<0.05. **p<0.01. ***p<0.001. Beta estimate 95% confidence intervals do not overlap zero (mixed-effect model adjusting a priori for litter size as a fixed effect and the dam as a random effect, vehicle control as reference group). Adjusted estimates and 95% CIs are shown in Table S8.
Figures 7A, 7B, 7C, and 7D are microscopic representations of histopathological features of the placenta.
Figure 7.
Representative examples of histopathological placenta findings observed in dams at embryonic day (E) 11.5 and E17.5, treated with perfluorooctanoic acid (PFOA) or GenX [hexafluoropropylene oxide dimer acid (HFPO-DA)]. (A) Normal labyrinth from a vehicle control dam at E17.5. (B) Labyrinth congestion in a dam at E17.5 that was treated with 10mg/kg/d GenX (C) Moderate labyrinth atrophy of the trilaminar trophoblast layer at E17.5 in a dam treated with 10mg/kg/d GenX. (D) Labyrinth necrosis (arrows) in an E17.5 dam that was treated with 10mg/kg/d GenX. All images at 20× magnification.
Figure 8 is a bar graph, plotting incidence, ranging from 0 to 100 percent in increments of 25 (y-axis) for lesion types early fibrin clot, labyrinth atrophy, labyrinth congestion, labyrinth necrosis, nodule, other, and within normal limits across group, including vehicle control, PFOA 1 milligram per kilogram, PFOA 5 milligrams per kilogram, GenX 2 milligrams per kilogram, and GenX 10 milligrams per kilogram (x-axis).
Figure 8.
Incidence of placenta lesions across treatment groups at embryonic day 17.5. n=56  litters with 31–41 placentas evaluated per treatment group (an average of 6–8 placentas per litter). Incidence values <4% are not numerically indicated, but all values and statistical comparisons of placenta lesion incidences across treatment groups at E17.5 are shown in Table S10.

References

    1. Alexander EK, Pearce EN, Brent GA, Brown RS, Chen H, Dosiou C, et al. . 2017. 2017 Guidelines of the American Thyroid Association for the diagnosis and management of thyroid disease during pregnancy and the postpartum. Thyroid 27(3):315–389, PMID: 28056690, 10.1089/thy.2016.0457. - DOI - PubMed
    1. Apelberg BJ, Witter FR, Herbstman JB, Calafat AM, Halden RU, Needham LL, et al. . 2007. Cord serum concentrations of perfluorooctane sulfonate (PFOS) and perfluorooctanoate (PFOA) in relation to weight and size at birth. Environ Health Perspect 115(11):1670–1676, PMID: 18008002, 10.1289/ehp.10334. - DOI - PMC - PubMed
    1. Ashley-Martin J, Dodds L, Arbuckle TE, Morisset AS, Fisher M, Bouchard MF, et al. . 2016. Maternal and neonatal levels of perfluoroalkyl substances in relation to gestational weight gain. Int J Environ Res Public Health 13(1):E146, PMID: 26805861, 10.3390/ijerph13010146. - DOI - PMC - PubMed
    1. ATSDR (Agency for Toxic Substances and Disease Registry). 2019. PFAS exposure assessments. https://www.atsdr.cdc.gov/pfas/PFAS-Exposure-Assessments.html [accessed July 7, 2019].
    1. Ballesteros V, Costa O, Iñiguez C, Fletcher T, Ballester F, Lopez-Espinosa MJ. 2017. Exposure to perfluoroalkyl substances and thyroid function in pregnant women and children: a systematic review of epidemiologic studies. Environ Int 99:15–28, PMID: 27884404, 10.1016/j.envint.2016.10.015. - DOI - PubMed

Publication types

LinkOut - more resources