. 2020 Feb;128(2):27002.
doi: 10.1289/EHP5580. Epub 2020 Feb 7.

CoMPARA: Collaborative Modeling Project for Androgen Receptor Activity

Kamel Mansouri  1   2   3 Nicole Kleinstreuer  4 Ahmed M Abdelaziz  5 Domenico Alberga  6 Vinicius M Alves  7   8 Patrik L Andersson  9 Carolina H Andrade  7 Fang Bai  10 Ilya Balabin  11 Davide Ballabio  12 Emilio Benfenati  13 Barun Bhhatarai  14 Scott Boyer  15 Jingwen Chen  16 Viviana Consonni  12 Sherif Farag  8 Denis Fourches  17 Alfonso T García-Sosa  18 Paola Gramatica  14 Francesca Grisoni  12 Chris M Grulke  1 Huixiao Hong  19 Dragos Horvath  20 Xin Hu  21 Ruili Huang  21 Nina Jeliazkova  22 Jiazhong Li  10 Xuehua Li  16 Huanxiang Liu  10 Serena Manganelli  13 Giuseppe F Mangiatordi  6 Uko Maran  18 Gilles Marcou  20 Todd Martin  23 Eugene Muratov  8 Dac-Trung Nguyen  21 Orazio Nicolotti  6 Nikolai G Nikolov  24 Ulf Norinder  15 Ester Papa  14 Michel Petitjean  25 Geven Piir  18 Pavel Pogodin  26 Vladimir Poroikov  26 Xianliang Qiao  16 Ann M Richard  1 Alessandra Roncaglioni  13 Patricia Ruiz  27 Chetan Rupakheti  23   28 Sugunadevi Sakkiah  19 Alessandro Sangion  14 Karl-Werner Schramm  5 Chandrabose Selvaraj  19 Imran Shah  1 Sulev Sild  18 Lixia Sun  29 Olivier Taboureau  25 Yun Tang  29 Igor V Tetko  30   31 Roberto Todeschini  12 Weida Tong  19 Daniela Trisciuzzi  6 Alexander Tropsha  8 George Van Den Driessche  17 Alexandre Varnek  20 Zhongyu Wang  16 Eva B Wedebye  24 Antony J Williams  1 Hongbin Xie  16 Alexey V Zakharov  21 Ziye Zheng  9 Richard S Judson  1
Affiliations

CoMPARA: Collaborative Modeling Project for Androgen Receptor Activity

Kamel Mansouri et al. Environ Health Perspect. 2020 Feb.

Abstract

Background: Endocrine disrupting chemicals (EDCs) are xenobiotics that mimic the interaction of natural hormones and alter synthesis, transport, or metabolic pathways. The prospect of EDCs causing adverse health effects in humans and wildlife has led to the development of scientific and regulatory approaches for evaluating bioactivity. This need is being addressed using high-throughput screening (HTS) in vitro approaches and computational modeling.

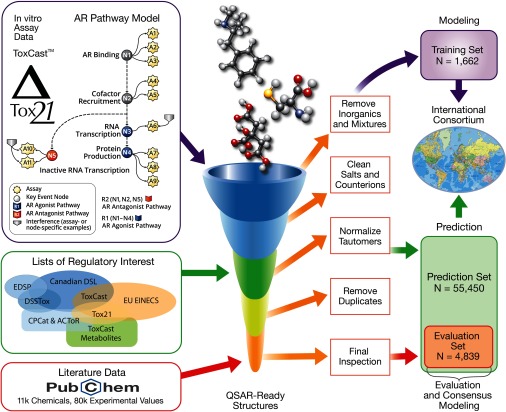
Objectives: In support of the Endocrine Disruptor Screening Program, the U.S. Environmental Protection Agency (EPA) led two worldwide consortiums to virtually screen chemicals for their potential estrogenic and androgenic activities. Here, we describe the Collaborative Modeling Project for Androgen Receptor Activity (CoMPARA) efforts, which follows the steps of the Collaborative Estrogen Receptor Activity Prediction Project (CERAPP).

Methods: The CoMPARA list of screened chemicals built on CERAPP's list of 32,464 chemicals to include additional chemicals of interest, as well as simulated ToxCast™ metabolites, totaling 55,450 chemical structures. Computational toxicology scientists from 25 international groups contributed 91 predictive models for binding, agonist, and antagonist activity predictions. Models were underpinned by a common training set of 1,746 chemicals compiled from a combined data set of 11 ToxCast™/Tox21 HTS in vitro assays.

Results: The resulting models were evaluated using curated literature data extracted from different sources. To overcome the limitations of single-model approaches, CoMPARA predictions were combined into consensus models that provided averaged predictive accuracy of approximately 80% for the evaluation set.

Discussion: The strengths and limitations of the consensus predictions were discussed with example chemicals; then, the models were implemented into the free and open-source OPERA application to enable screening of new chemicals with a defined applicability domain and accuracy assessment. This implementation was used to screen the entire EPA DSSTox database of 875,000 chemicals, and their predicted AR activities have been made available on the EPA CompTox Chemicals dashboard and National Toxicology Program's Integrated Chemical Environment. https://doi.org/10.1289/EHP5580.


Figures

Figure 1 is a workflow of data sets. There is a funnel in the center with five segments. Near the mouth of the funnel are structures of chemical compounds. In vitro assay data Tox Cast super TM and A R pathway model have an arrow leading to the top-most segment of the funnel. An overlapping list of regulatory interests, including EDSP, Canadian DSL, ToxCast, EU EINECS, Tox21, ToxCast Metabolites, CPCat and ACToR, DSSTox, and EDSP has an arrow pointing toward the third segment of the funnel. Literature data Pub C Hem 11k Chemicals, 80k Experimental values has an arrow pointing toward the last segment of the funnel. A text at the bottom of the funnel reads QSAR-ready structures. The roles of the first, second, third, fourth, and fifth segments are to remove inorganics and mixtures; clean salts and counterions; normalize tautomers; remove duplicates; and final inspection, respectively. Modeling, including training set n equals 1662 goes through the process of the first segment. Modeling leads to International Consortium. Prediction, including prediction set n equals 55450 goes through the process of the third segment, and prediction also leads to International Consortium. Evaluation and consensus modeling, including evaluation set n equals 4839 goes through the process of the fifth segment.
Figure 1.
Workflow of the project defining the major steps and the different data sets used for training, evaluation, and prediction.
Figure 2 is a bar graph, plotting calculated scores, ranging from 0.00 to 1.00, with increments of 0.10 (y-axis) for binding, agonist, and antagonist across group acronyms ATSDR_IRFMN_1; ATSDR_IRFMN_2; ATSDR_IRFMN_3; DTU; ECUST; EPA_NCCT_1; EPA_NCCT_2; EPA_NCCT_3; EPA_NRMRL_1; EPA_NRMRL_2; FDA_HHS; IMC_1; IMC_2; IDEA; INS_LA; CMPLI; LM; IRFMN; NCATS_1; NCATS_2; NCSTATE; SWETOX_1; SWETOX_2; TARTU_1; TARTU_2; TUM; UFG; UMEA; UNC; UNIBARI; UNIMIB_1; UNIMIB_2; UNISTRA; and VCCLAB (x-axis).
Figure 2.
Scores of the categorical binding (black), agonist (white) and antagonist (gray) models based on the evaluation set and the scoring Equation 1.
Figure 3 plots calculated scores, ranging from 0 to 0.8, with increments of 0.1, (y-axis) for binding, agonist, and antagonist across CMPLI, LM, TUM, UNISTRA, VCCLAB (x-axis).
Figure 3.
Scores of the continuous binding (black), agonist (white) and antagonist models based on the evaluation set and the scoring Equation 1 (See Supplemental Material 1 for groups’ abbreviations).
Figure 4 is a histogram, plotting number of predicted chemical structures, ranging from 0 to 3, in increments of 0.5 (y-axis) for binding, agonist, and antagonist across number of models, ranging from 10 to 35, in increments of 5 (x-axis). Across the x-axis, the top-left portion of the graph mentions times 10 super 4.
Figure 4.
Histogram showing the distribution of the number of binding (black), agonist (white) and antagonist (gray) models covering the prediction set (minimum of 11 models for agonist and antagonist and 20 for binding).
Figure 5 is a histogram, plotting number of predicted chemical structures, ranging from 0 to 3.5, in increments of 0.5 (y-axis) for binding, agonist, and antagonist across concordance, ranging from 0.5 to 1, in increments of 0.5 (x-axis). Across the x-axis, the top-left portion of the graph mentions times 10 super 4.
Figure 5.
Histogram showing the distribution of the concordance of the binding (black), agonist (white) and antagonist (gray) single models.
Figure 6 is a histogram, plotting number of predicted chemical structures, ranging from 0 to 3 (y-axis) across prediction concordance for actives, ranging from 0 to 1 in increments of 0.1 (x-axis). Across the x-axis, the top-left portion of the graph mentions times 10 super 4.
Figure 6.
Histogram showing the distribution of the concordance between the binding models over the active predictions.
Figure 7 is a histogram, plotting chemicals, ranging from 0 to 55000, in increments of 5000 (left y-axis) and score, ranging from 0 to 1, in increments of 0.1 (right y-axis) for coverage and group across group acronyms ATSDR_IRFMN_1; ATSDR_IRFMN_3; ECUST; EPA_NCCT_2; EPA_NRMRL_1; FDA_HHS; IBMC_2; INS_LA; LM; NCATS_1; NCSTATE; SWETOX_2; TARTU_2; UFG; UNC; UNIMIB_1; and UNISTRA (x-axis).
Figure 7.
Histogram showing the coverage and S-score of the single binding models in comparison with the consensus binding predictions for the full CoMPARA set.
Figure 8 is a box plot, plotting concordance in prediction, ranging from 0.5 to 1, in increments of 0.5 (y-axis) across accuracy in classification prediction, including accurate and inaccurate (x-axis).
Figure 8.
Box plot showing the correlation between concordance and accuracy of prediction for the evaluation set chemicals. The box represents the interquartile range. The lower and upper box boundaries represent the 25th and 75th percentiles, respectively. The horizontal line splitting the box represents the median value. The upper and lower whiskers represent the minimum and maximum values, respectively. Outliers are represented by the + symbol.
Figure 9 is a box plot, plotting concordance in prediction, ranging from 0.5 to 1, in increments of 0.5 (y-axis) across potency of active binders, including very weak, weak, moderate, and strong (x-axis).
Figure 9.
Box plot showing the correlation between concordance and potency for the active binders of the evaluation set chemicals. The box represents the interquartile range. The lower and upper box boundaries represent the 25th and 75th percentiles, respectively. The horizontal line splitting the box represents the median value. The upper and lower whiskers represent the minimum and maximum values, respectively. Outliers are represented by the + symbol.
Figure 10 is a graph, plotting balanced accuracy in 5-fold CV, ranging from 0.5 to 0.95, in increments of 0.5 (y-axis) across ranked descriptors for A R activity, ranging from 0 to 70, in increments of 10 (x-axis) for binding (x: 23; y: 0.9399), antagonist (x: 15; y: 0.9434), and agonist (x: 10; y: 0.9579).
Figure 10.
Selected descriptors for the binding (. symbol), agonist (* symbol), and antagonist (x symbol) models and corresponding balanced accuracy (BA) calculated in five-fold cross-validation in forward selection based on the genetic algorithm (GA) ranking. The ranked descriptors are not overlapping for the three modalities.

References

    1. Ball N, Cronin MTD, Shen J, Blackburn K, Booth ED, Bouhifd M, et al. 2016. Toward Good Read-Across Practice (GRAP) guidance. ALTEX 33(2):149–166, PMID: 26863606, 10.14573/altex.1601251. - DOI - PMC - PubMed
    1. Ballabio D, Grisoni F, Todeschini R. 2018. Multivariate comparison of classification performance measures. Chemometr Intell Lab Syst 174:33–44, 10.1016/j.chemolab.2017.12.004. - DOI
    1. Ballabio D, Vasighi M, Consonni V, Kompany-Zareh M. 2011. Genetic algorithms for architecture optimisation of counter-propagation artificial neural networks. Chemometr Intell Lab Syst 105(1):56–64, 10.1016/j.chemolab.2010.10.010. - DOI
    1. Benigni R. 2003. Quantitative Structure-Activity Relationship (QSAR) Models of Mutagens and Carcinogens. Boca Raton, FL: CRC Press. - PubMed
    1. Berk RA. 2008. Statistical Learning from a Regression Perspective. New York, NY: Springer-Verlag.

Publication types