

The Spatial Distribution of Water Components with Similar T2 May Provide Insight into Pathways for Large Molecule Transportation in the Brain
- PMID: 32074590
- PMCID: PMC7952201
- DOI: 10.2463/mrms.mp.2019-0138
The Spatial Distribution of Water Components with Similar T2 May Provide Insight into Pathways for Large Molecule Transportation in the Brain
Abstract
Purpose: Although there is no lymphatic system in the central nervous system (CNS), there seems to be a mechanism to remove macro molecules from the brain. Cerebrospinal fluid (CSF) and interstitial fluid (ISF) are thought to be parts of this pathway, but the details are not known. In this study, MR signal of the extracellular water was decomposed into components with distinct T2's, to obtain some information about distribution of waste material in the brain.
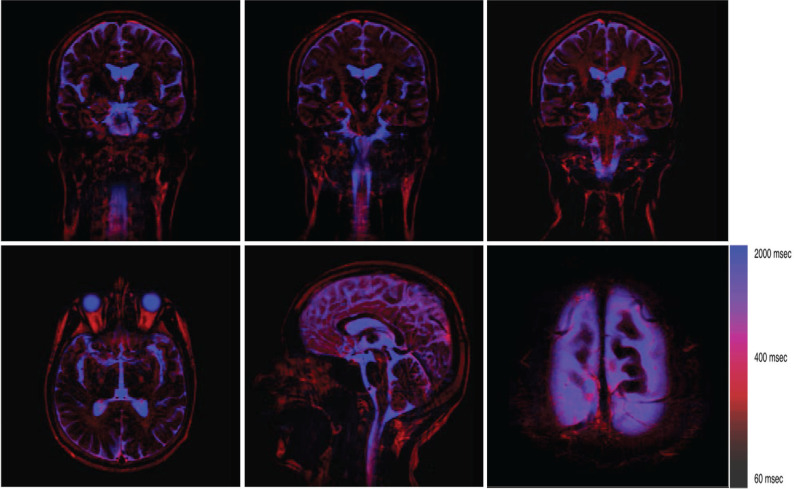
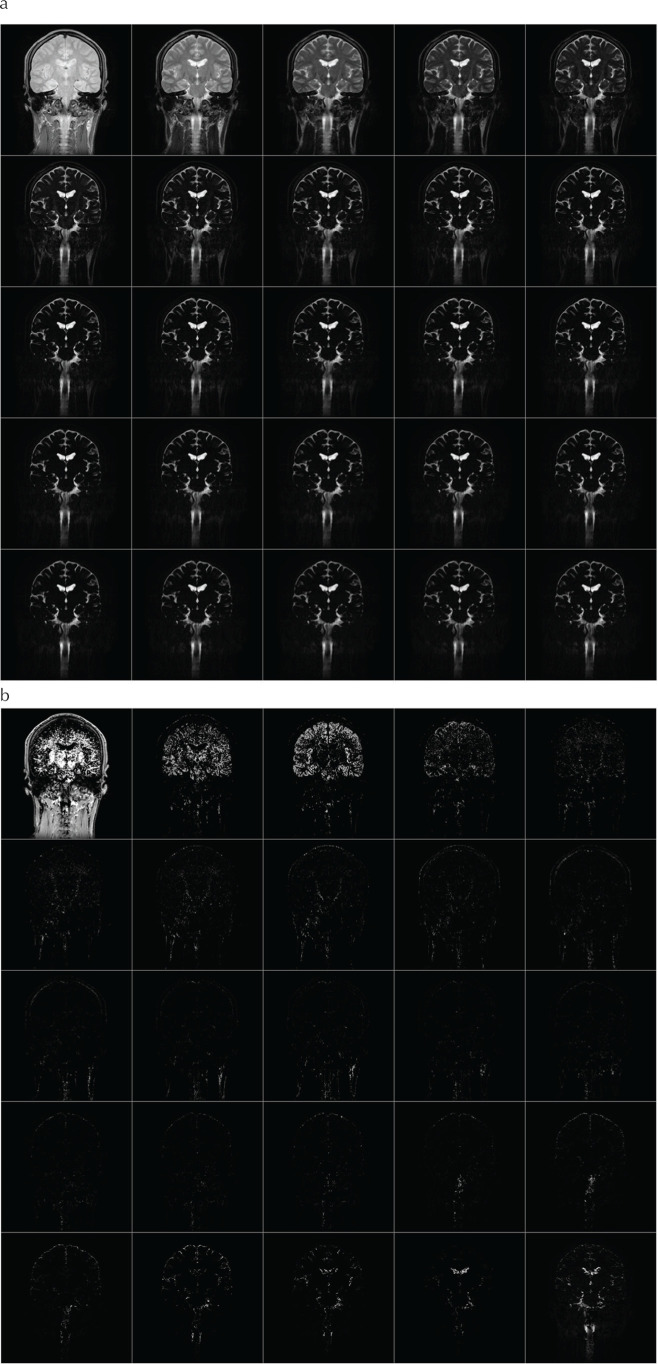
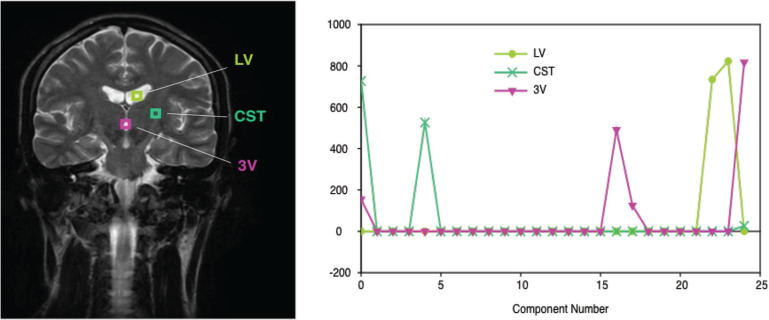
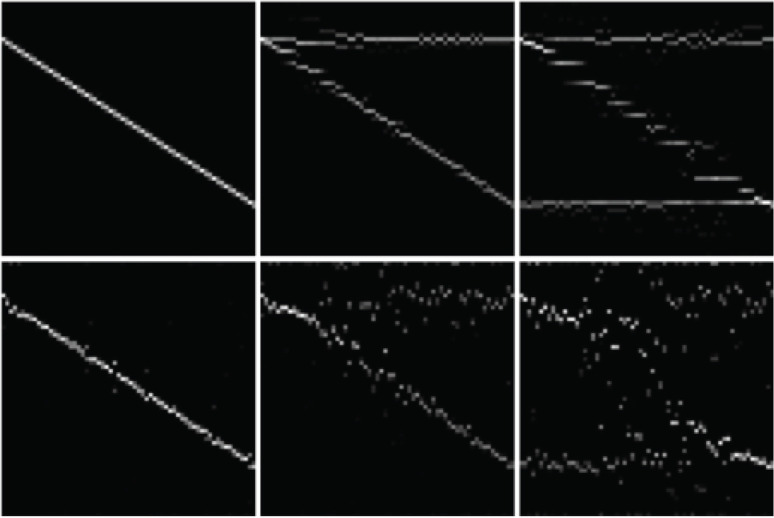
Methods: Images were acquired using a Curr, Purcell, Meiboom, Gill (CPMG) imaging sequence. In order to reduce T1 contamination and the signal oscillation, hard pulses were used as refocusing pulses. The signal was then decomposed into many T2 components using non-negative least squares (NNLS) in pixel-by-pixel basis. Finally, a color map was generated by assigning different color for each T2 component, then adding them together.
Results: From the multi-echo images, it was possible to decompose the decaying signal into separate T2 components. By adjusting the color table to create the color map, it is possible to visualize the extracellular water distribution, as well as their T2 values. Several observation points include: (1) CSF inside ventricles has very long T2 (~2 s), and seems to be relatively homogeneous, (2) subarachnoid CSF also have long T2, but there are short T2 component at the brain surface, at the surface of dura, at the blood vessels in the subarachnoid space, etc., (3) in the brain parenchyma, short T2 components (longer than intracellular component but shorter than CSF) exists along the white matter, in the choroid plexus, etc. These can be considered as distribution of macromolecules (waste materials) in the brain.
Conclusion: From T2 component analysis it is possible to obtain some insight into pathways for the transport of large molecules in the CNS, where no lymphatic system is present.
Keywords: cerebrospinal fluid; glymphatic; interstitial fluid; lymphatic; neurofluid.
Conflict of interest statement
Koichi Oshio and Shinya Yamada have no conflicts of interest; Masao Yui and Seiko Shimuzu are employees of Canon Medical Systems.
Figures
References
-
- Yamada S, DePasquale M, Patlak CS, Cserr HF. Albumin outflow into deep cervical lymph from different regions of rabbit brain. Am J Physiol 1991; 261:H1197–H1204. - PubMed
-
- MacKay A, Laule C, Vavasour I, Bjarnason T, Kolind S, Mädler B. Insights into brain microstructure from the T2 distribution. Magn Reson Imaging 2006; 24:515–525. - PubMed
-
- Bro R, de Jong S. A fast non-negativity-constrained least squares algorithm. J Chemometrics 1997; 11:393–401.
-
- Hassin GB, Oldberg E, Tinsley M. Changes in the brain in plexectomized dogs with comments on the cerebrospinal fluid. Arch Neurol Psychiatry 1937; 38:1224–1239.
MeSH terms
LinkOut - more resources
Full Text Sources
Other Literature Sources
Medical