. 2020 Feb 14;9(2):443.
doi: 10.3390/cells9020443.

Cytochrome c Oxidase Subunit 4 Isoform Exchange Results in Modulation of Oxygen Affinity

Affiliations

Cytochrome c Oxidase Subunit 4 Isoform Exchange Results in Modulation of Oxygen Affinity

David Pajuelo Reguera et al. Cells. .

Abstract

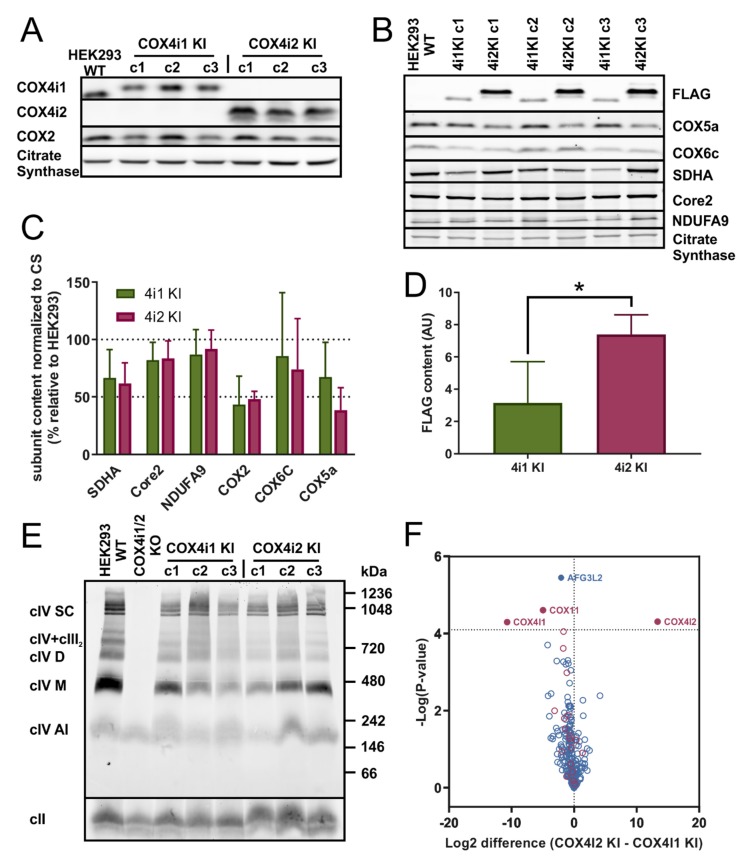
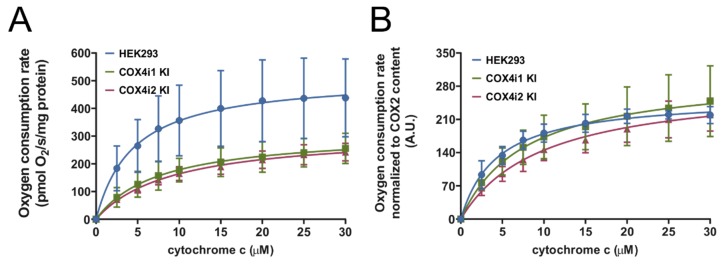
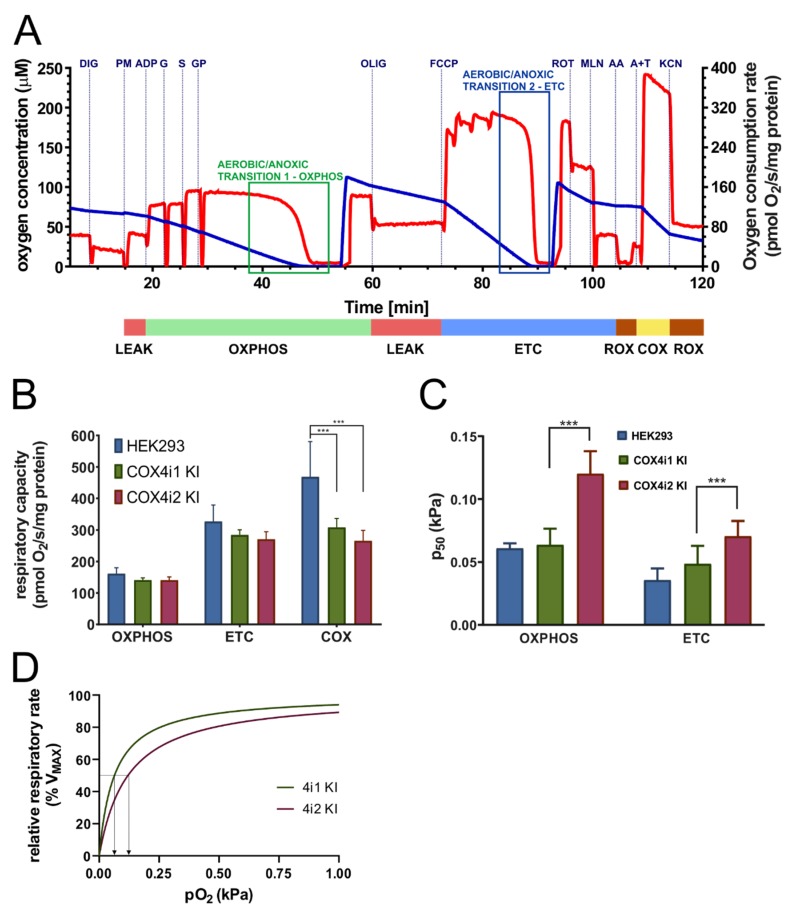
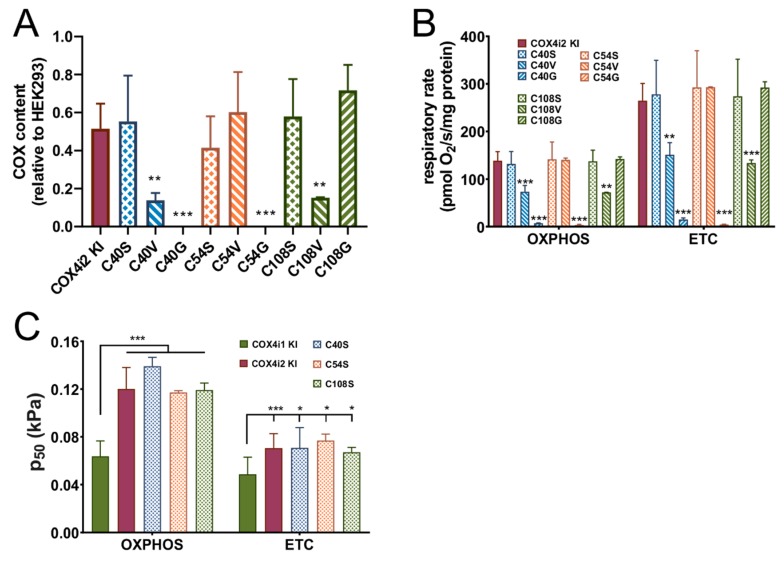
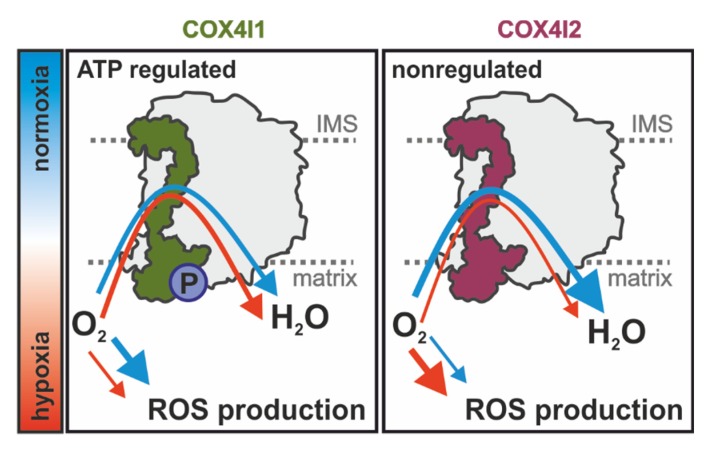
Cytochrome c oxidase (COX) is regulated through tissue-, development- or environment-controlled expression of subunit isoforms. The COX4 subunit is thought to optimize respiratory chain function according to oxygen-controlled expression of its isoforms COX4i1 and COX4i2. However, biochemical mechanisms of regulation by the two variants are only partly understood. We created an HEK293-based knock-out cellular model devoid of both isoforms (COX4i1/2 KO). Subsequent knock-in of COX4i1 or COX4i2 generated cells with exclusive expression of respective isoform. Both isoforms complemented the respiratory defect of COX4i1/2 KO. The content, composition, and incorporation of COX into supercomplexes were comparable in COX4i1- and COX4i2-expressing cells. Also, COX activity, cytochrome c affinity, and respiratory rates were undistinguishable in cells expressing either isoform. Analysis of energy metabolism and the redox state in intact cells uncovered modestly increased preference for mitochondrial ATP production, consistent with the increased NADH pool oxidation and lower ROS in COX4i2-expressing cells in normoxia. Most remarkable changes were uncovered in COX oxygen kinetics. The p50 (partial pressure of oxygen at half-maximal respiration) was increased twofold in COX4i2 versus COX4i1 cells, indicating decreased oxygen affinity of the COX4i2-containing enzyme. Our finding supports the key role of the COX4i2-containing enzyme in hypoxia-sensing pathways of energy metabolism.

Keywords: mitochondria, OXPHOS, respiratory chain, cytochrome c oxidase, COX, COX4 isoforms, COX4i2, oxygen affinity, p50, oxygen sensing.


Conflict of interest statement

The authors declare no conflict of interest.

Figures

Figure 1
Figure 1
(A) Western blot analysis of COX4 isoforms in knock-in cell lines. Whole cell lysates (30 µg of protein) of control HEK293 and three clones of each COX4i1 KI and COX4i2 KI were subjected to SDS-PAGE and Western blotting. COX4i1 and COX4i2 isoforms were detected with specific antibodies (see details in Methods), along with the COX2 subunit. Citrate synthase was used as a loading control. (B) Western blot analysis of COX subunits and OXPHOS proteins. Whole cell lysates (30 µg of protein) of control HEK293 and three clones of each COX4i1 KI and COX4i2 KI were subjected to SDS-PAGE and Western blotting. Representative image of one of three sets of samples of the HEK293 control and three clones of each KI cells are shown. (C) Quantity of OXPHOS proteins. Antibody signals from WB images were quantified densitometricaly using Image Lab software (Bio Rad). Data are plotted as the mean ± S.D. of COX4i1 and COX4i2 KI values expressed in percent relative to control HEK293 cells (n = 9, three independent samples of three clones of each KI cell line). (D) Quantity of FLAG-tagged COX4 isoforms. Relative content of FLAG-tagged COX4i1 and COX4i2 in respective KI cell lines determined by densitometry quantification of the FLAG antibody signal. Data are plotted as the mean ± S.D. of COX4i1 and COX4i2 KI cells (n = 9, three independent samples of three clones of each KI cell line). (E) BN-PAGE analysis of native forms of COX. Isolated mitochondria from HEK293, COX4i1/2 KO, and KI cells were solubilized with digitonin (6 g/g protein); sample aliquots of 30 µg protein were separated on 5%–16% native gel. WB analysis with the COX1 antibody revealed multiple forms of the COX complex as indicated on the left of the image: COX1-containing assembly intermediate (cIV AI), monomer (cIV M), dimer (cIV D), assemblies with complex III (cIV + cIII), and respiratory supercomplexes (cIV SC). Molecular weight marker migration is indicated on the right. Complex II (cII) detected by the SDHA antibody was used as a loading control. * p > 0.05. (F) Mass spectrometry analysis of immunoprecipitated COX. Volcano plot depicting differential contents of Mitocarta-annotated proteins immunoprecipitated with the anti-FLAG antibody (blue circles) from 4i1 or 4i2 KI cells. Red circles mark COX subunits and assembly factors. Relative quantities (4i2 KI/4i1 KI) plotted on the X-axis are expressed in log2 scale. Significantly different hits are shown above the probability cut off (dashed horizontal line) with protein names annotated.
Figure 2
Figure 2
COX activities normalized to the protein concentration (A) or COX2 subunit content (B). COX activities in Tween-20 extracts of isolated mitochondria measured as oxygen consumption using Oxygraph-2k (Oroboros) at increasing concentrations of cytochrome c (0–30 µM) are plotted as the mean ± S.D. value of three (HEK293, blue) and nine (three replicates of three clones each) COX4i1 (green) and COX4i2 KI (magenta) cells each. Hyperbolic fit of the Michaelis-Menten function is shown as full lines in respective colors.
Figure 3
Figure 3
Mitochondrial respiration in permeabilised cells. (A) Representative trace of respirometric measurement. Experimental trace recorded by Oxygraph-2k (Oroboros) with 0.3 mg protein/mL of HEK293 cells from acquisition software DatLab5 showing the actual O2 concentration (blue, left Y axis in µM) and rate of oxygen consumption (red, right Y axis in pmol O2/s/mg protein). Additions of substrates and inhibitors are marked by vertical dashed lines and abbreviations above the trace (digitonin 0.05 g/g protein—DIG, pyruvate 10 mM + malate 2 mM—PM, ADP 1 mM—ADP, glutamate 10 mM—G, succinate 10 mM – S, glycerol-3 phosphate 10 mM—GP, oligomycin 0.5 µM—OLIG, FCCP 100—300 nM—FCCP, rotenone 0.5 µM—ROT, malonate 10 mM—MLN, antimycin A 0.25 µM—AA, ascorbate 2 mM + TMPD 1 mM—A+T, and KCN 0.5 mM—KCN). The diagram below is time-aligned with the experimental trace and denotes the actual respiratory state (driven by proton leak—LEAK, red; coupled to ATP synthesis—OXPHOS, green; uncoupled by protonophore FCCP—ETC, blue; residual oxygen consumption after inhibitor addition—ROX, brown; respiration with artificial substrates ascorbate and TMPD—COX, yellow). (B) Respiratory capacities in OXPHOS, ETC, and COX states are plotted as the mean ± S.D. value of seven (HEK293, blue) and twelve (four replicates of three clones each) COX4i1 (green) and COX4i2 KI (magenta) cells. *** p < 0.001. (C) Oxygen affinity expressed as p50—partial pressure of oxygen at half-maximal respiration (kPa) in OXPHOS and ETC states—is plotted as the mean ± S.D. value of seven (HEK293, blue) and twelve (four replicates of three clones each) COX4i1 (green) and COX4i2 KI (magenta) cells. *** p < 0.001. (D) Simulated hyperbolic response of relative respiratory rates (as % of maximal rates) to oxygen partial pressure (0–1 kPa) was calculated using the Michaelis-Menten function, feeding mean values of experimentally analyzed p50 values for COX4i1 (green) and COX4i2 (magenta) KI cells. Arrows projecting from respective traces towards the X-axis mark p50 values of COX4i1 and COX4i2 KI.
Figure 4
Figure 4
The COX content and respiration of COX4i2 cysteine substitution mutant KI cell lines. (A) The COX content calculated as the COX2 subunit quantified in the WB immunodetection experiment, normalized to citrate synthase, and expressed in % relative to the COX2 content in parental HEK293 cells, is plotted as the mean ± S.D. value of two measurements in each COX4i2 cysteine-substitution mutant KI cell line as indicated below the graph compared to wild-type COX4i2 KI (magenta, n = 9). ** p < 0.01, and *** p < 0.001 mark significant differences between individual mutant cysteine KIs and wild-type COX4i2 KI. Respiratory rates (B) and p50 (C) in OXPHOS and ETC states are plotted as the mean ± S.D. value of two measurements in each COX4i2 cysteine-substitution mutant KI cell line as indicated below the graph compared to wild-type COX4i2 KI (magenta, n = 12). * p < 0.05, ** p < 0.02, *** p < 0.001 mark significant differences between individual mutant cysteine KIs and wild-type COX4i2 KI in (B) or between COX4i1 KI and wild-type or mutant variants of COX4i2 KI cells (C).
Figure 5
Figure 5
Energy metabolism in intact KI cells. (A) Cellular oxygen consumption rate (OCR) and (B) extracellular acidification rate (ECAR) were recorded by an XFe Bioenergetics Analyzer (Seahorse) with endogenous substrates (basal) and after subsequent additions of 10 mM glucose (Glu), 1 µM oligomycin (Oligo), 1 µM FCCP (FCCP) in HEK293 cells (blue, n = 5), COX4i1 KI (green, n = 7, at least two replicates of each of three clones), and COX4i2 KI cells (magenta, n = 8, at least two replicates of each of three clones), plotted as mean values ± S.D. Glycolytic reserve capacity displayed in B was calculated as the difference between the ECAR values in Oligo and Glu states. (C) OCR/ECAR ratio (mean ± S.D.) was calculated from recorded rates in the coupled state in the presence of 10 mM glucose (Glu). * p < 0.05 marks a significant difference between COX4i1 and COX4i2 KI cells.
Figure 6
Figure 6
ROS production and redox status in intact KI cells. (A) Mitochondrial ROS production was monitored as oxidation of the fluorescent H2-DCFDA probe in intact HEK293 (blue, n = 3), COX4i1/2 KO (orange, n = 3), COX4i1 KI (green, n = 9, three replicates of three clones each), and COX4i2 KI cells (magenta, n = 9, three replicates of three clones each). Data are plotted the mean ± S.D. (B) The NAD+/NADH ratio was calculated from parallel measurements of NAD+ and NADH contents in intact cells using NAD/NADH-Glo™ Assay (Promega). Data are plotted as the mean ± S.D. of HEK293 (blue, n = 3), COX4i1/2 KO (orange, n = 3), COX4i1 KI (green, n = 9, three replicates of three clones each), and COX4i2 KI cells (magenta, n = 9, three replicates of three clones each). * p < 0.05 marks a significant difference between COX4i1 and COX4i2 KI cells.
Figure 7
Figure 7
Model of COX functional alterations mediated by COX4 isoform exchange: Rates of oxygen consumption of COX4i1- (left) or COX4i2-containing COX (right) are depicted by variable arrow thickness in normoxia (blue arrow) and hypoxia (red arrow). P, serine58 phosphorylation site.

References

    1. Timon-Gomez A., Nyvltova E., Abriata L.A., Vila A.J., Hosler J., Barrientos A. Mitochondrial cytochrome c oxidase biogenesis: Recent developments. Semin Cell Dev. Biol. 2018;76:163–178. doi: 10.1016/j.semcdb.2017.08.055. - DOI - PMC - PubMed
    1. Villani G., Attardi G. In vivo control of respiration by cytochrome c oxidase in human cells. Free Radic. Biol. Med. 2000;29:202–210. doi: 10.1016/S0891-5849(00)00303-8. - DOI - PubMed
    1. Pierron D., Wildman D.E., Huttemann M., Markondapatnaikuni G.C., Aras S., Grossman L.I. Cytochrome c oxidase: Evolution of control via nuclear subunit addition. Biochim. Biophys. Acta. 2012;1817:590–597. doi: 10.1016/j.bbabio.2011.07.007. - DOI - PMC - PubMed
    1. Huttemann M., Helling S., Sanderson T.H., Sinkler C., Samavati L., Mahapatra G., Varughese A., Lu G., Liu J., Ramzan R., et al. Regulation of mitochondrial respiration and apoptosis through cell signaling: Cytochrome c oxidase and cytochrome c in ischemia/reperfusion injury and inflammation. Biochim. Biophys. Acta. 2012;1817:598–609. doi: 10.1016/j.bbabio.2011.07.001. - DOI - PMC - PubMed
    1. Kadenbach B., Huttemann M., Arnold S., Lee I., Bender E. Mitochondrial energy metabolism is regulated via nuclear-coded subunits of cytochrome c oxidase. Free Radic. Biol. Med. 2000;29:211–221. doi: 10.1016/S0891-5849(00)00305-1. - DOI - PubMed

Publication types

MeSH terms