. 2020 Feb 14;21(4):1297.
doi: 10.3390/ijms21041297.

Inhibition of Bromodomain and Extraterminal Domain (BET) Proteins by JQ1 Unravels a Novel Epigenetic Modulation to Control Lipid Homeostasis

Affiliations

Inhibition of Bromodomain and Extraterminal Domain (BET) Proteins by JQ1 Unravels a Novel Epigenetic Modulation to Control Lipid Homeostasis

Claudia Tonini et al. Int J Mol Sci. .

Abstract

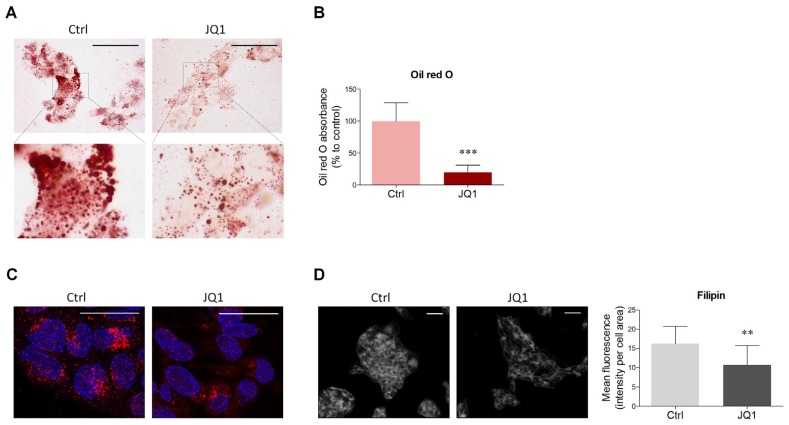
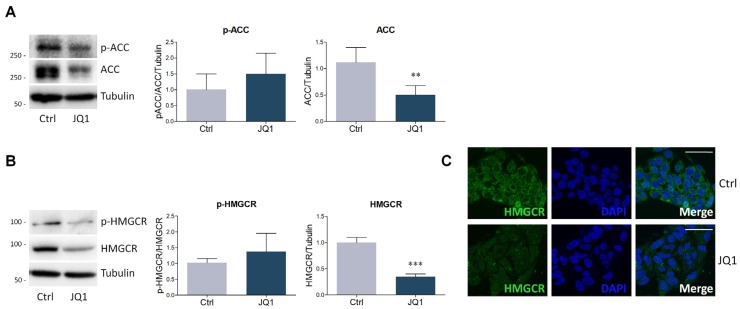
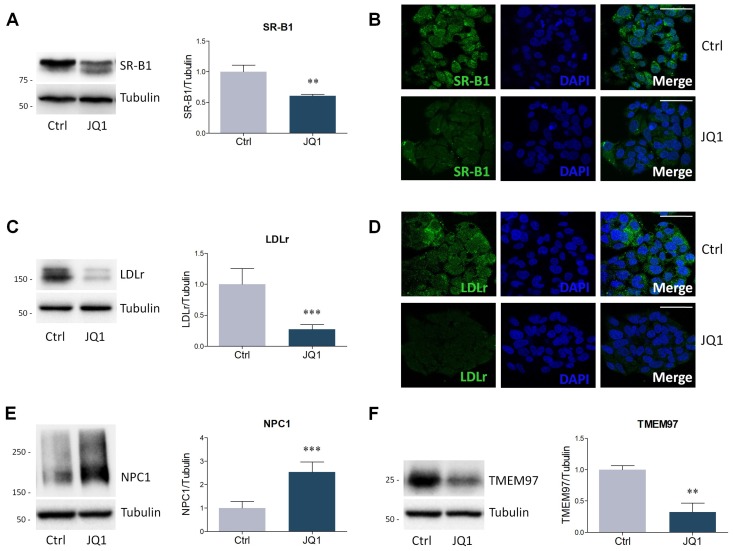
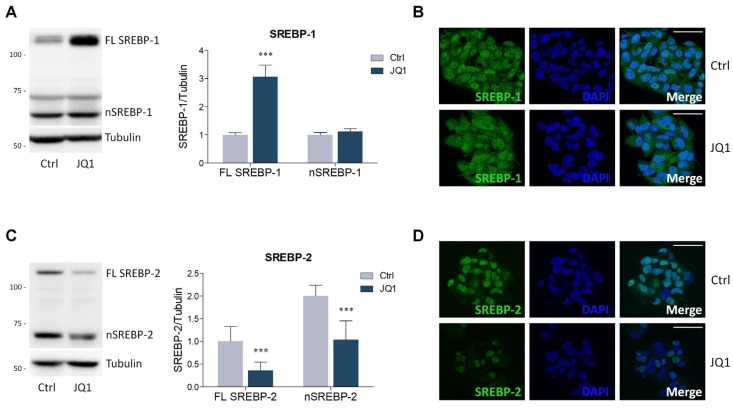
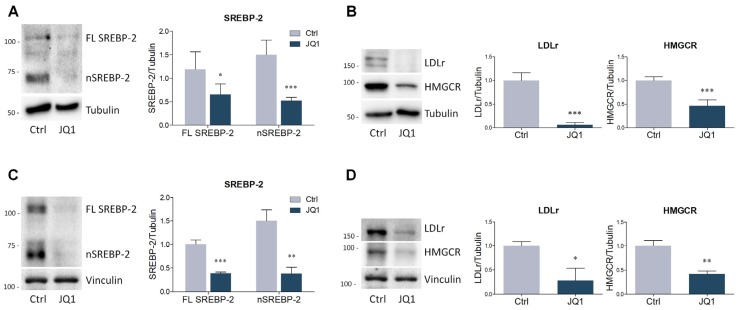
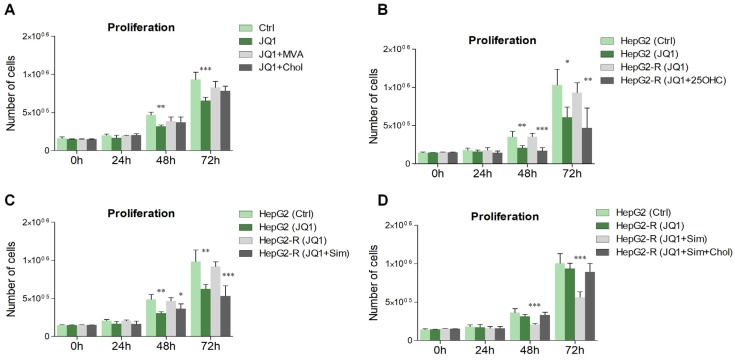
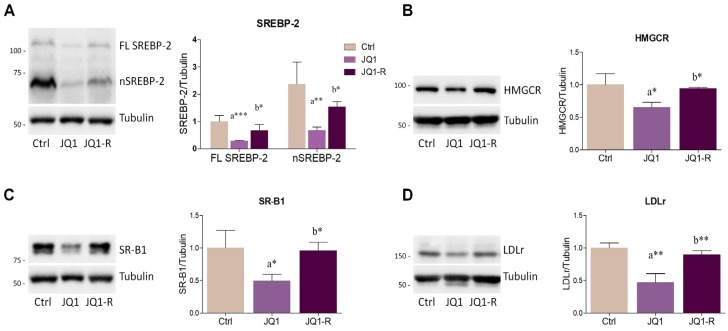
The homeostatic control of lipid metabolism is essential for many fundamental physiological processes. A deep understanding of its regulatory mechanisms is pivotal to unravel prospective physiopathological factors and to identify novel molecular targets that could be employed to design promising therapies in the management of lipid disorders. Here, we investigated the role of bromodomain and extraterminal domain (BET) proteins in the regulation of lipid metabolism. To reach this aim, we used a loss-of-function approach by treating HepG2 cells with JQ1, a powerful and selective BET inhibitor. The main results demonstrated that BET inhibition by JQ1 efficiently decreases intracellular lipid content, determining a significant modulation of proteins involved in lipid biosynthesis, uptake and intracellular trafficking. Importantly, the capability of BET inhibition to slow down cell proliferation is dependent on the modulation of cholesterol metabolism. Taken together, these data highlight a novel epigenetic mechanism involved in the regulation of lipid homeostasis.

Keywords: BET proteins; HMGCR; JQ1; LDLr; SREBP; TMEM97; cell proliferation; cholesterol; epigenetics; lipid metabolism.


Conflict of interest statement

The authors declare no conflict of interest.

Figures

Figure 1
Figure 1
Effects of bromodomain and extraterminal domain (BET) inhibition by JQ1 on intracellular lipids in HepG2 cells. (A) HepG2 cells were treated with vehicle (Ctrl) or JQ1 (0.4 µM), and after 48 hours they were stained with Oil Red O as described in the Materials and Methods Section to visualize the intracellular content of neutral lipids. n = 6 different experiments. Scale bar: 50 µm (B) HepG2 cells were treated as in (A), and Oil Red O was extracted with isopropanol. The eluted dye was then quantified by spectrophotometry to evaluate the amount of neutral lipids. n = 6 different experiments. (C) Vehicle- and JQ1-treated HepG2 cells were fixed and stained with antibody against Plin2 (red). DAPI was used as a nuclear counterstain. Scale bar: 25 µm (D) Representative image (left panel) and quantification of the mean fluorescence intensity (right panel) of filipin staining performed on HepG2 cells treated with vehicle and JQ1 for 48 hours. n = 5 different experiments. Scale bar: 50 µm. Data represent means ± SD. Statistical analysis was performed by using unpaired Student’s t test. ** p < 0.01; *** p < 0.001.
Figure 2
Figure 2
Evaluation of BET inhibition on lipid biosynthesis enzymes. (A) Representative Western blot (left panel) and densitometric analysis of phosphorylated Acyl Coenzyme A carboxylase (ACC) (P-ACC, ser79) and total ACC in HepG2 cells treated with vehicle (Ctrl) or JQ1 (0.4 µM) for 48 hours. n = 6 independent experiments. Tubulin was employed as a housekeeping protein to normalize protein loading. (B) Representative Western blot (left panel) and densitometric analysis (right panel) of phosphorylated 3-hydroxy-3-methylglutaryl Coenzyme A reductase (HMGCR) (p-HMGCR, ser872) and total HMGCR in HepG2 cells treated with vehicle (Ctrl) or JQ1 (0.4 µM) for 48 hours. n = 7 independent experiments. Tubulin served as a housekeeping protein to normalize protein loading. (C) Immunofluorescence staining of HMGCR (green) of HepG2 cells treated as in (B). Nuclei were counterstained with DAPI. n = 3 different experiments. Scale bar: 50 µm. Data are expressed as means ± SD. Statistical analysis was carried out by using unpaired Student’s t test. ** p < 0.01; *** p < 0.001.
Figure 3
Figure 3
Expression of proteins involved in extracellular lipid uptake and intracellular cholesterol trafficking following JQ1 (0.4 µM) administration to HepG2 cells for 48 hours. (A) Representative Western blot (left panel) and densitometric analysis (right panel) of SR-B1. n = 6 independent experiments. (B) Immunofluorescence analysis of SR-B1 (green). Nuclei were counterstained with DAPI. n = 3 different experiments. Scale bar: 50 µm. (C) Representative Western blot (left panel) and densitometric analysis (right panel) of LDLr. n = 5 independent experiments. (D) LDLr immunofluorescence (green). Nuclei were counterstained with DAPI. n = 3 different experiments. (E–F) Representative Western blots and densitometric analysis of NPC1 and TMEM97. Tubulin was chosen as loading control. n = 6 independent experiments. Data represent means ± SD. Statistical analysis was performed by using unpaired Student’s t test. ** p < 0.01; *** p < 0.001.
Figure 4
Figure 4
BET inhibition alters sterol regulatory element binding proteins (SREBPs) expression in HepG2 cells treated with JQ1 (0.4 µM) for 48 hours. (A) Representative Western blot (left panel) and densitometric analysis (right panel) of SREBP-1. FL SREBP-1 (Full-length SREBP-1); nSREBP-1 (nuclear SREBP-1). n = 6 independent experiments. Tubulin was employed for control loading. (B) SREBP-1 immunofluorescence staining (green) in HepG2 cells. Nuclei were counterstained with DAPI. n = 3 different experiments. Scale bar: 50 µm. (C) Representative Western blot (left panel) and densitometric analysis (right panel) of SREBP-2. FL SREBP-2 (Full-length SREBP-2); nSREBP-2 (nuclear SREBP-2). n = 6 independent experiments. Tubulin was used as a housekeeping protein. (D) Immunofluorescence analysis of SREBP-2 (green). Nuclei were counterstained with DAPI. n = 3 different experiments. Scale bar: 50 µm. Data represent means ± SD. Statistical analysis was assessed by using unpaired Student’s t test. *** p < 0.001.
Figure 5
Figure 5
BET inhibition modulates the expression of SREBP-2, HMGCR and LDLr in different cell lines. (A–B) Representative Western blot and densitometric analysis of SREBP-2, HMGCR and LDLr in differentiated N1E-115 treated with JQ1 (0.1 µM) for 48 hours. (C–D) Representative Western blot and densitometric analysis of SREBP-2, HMGCR and LDLr in primary human fibroblasts treated with JQ1 (0.4 µM) for 48 hours. n = 3 different experiments. Tubulin and vinculin were used as loading control. Data represent means ± SD. Statistical analysis was assessed by using unpaired Student’s t test. * p < 0.05, ** p < 0.01, *** p < 0.001.
Figure 6
Figure 6
BET inhibition influences cell proliferation through cholesterol metabolism. (A) HepG2 cells were seeded in 6-well plates (150,000 cells for each well) and were treated with JQ1 (0.4 µM), mevalonate (MVA, 100 µM) and cholesterol (chol, 50 µM) for 72 hours. Cell counts were conducted over time with a hemocytometer. (B–C) Cell proliferation was evaluated in JQ1-sensitive (HepG2) and JQ1-resistant (HepG2-R) cells. JQ1-resistant and -sensitive HepG2 cells were treated with the BET inhibitor for 72 hours, and additional groups of HepG2-R cells were co-stimulated with JQ1+25-hydroxycholesterol (25OHC, 20 µM) or JQ1+simvastatin (Sim, 1 µM). Other cells were treated with vehicle and served as control (Ctrl). (D) Cell proliferation was evaluated in JQ1-sensitive (HepG2) and JQ1-resistant (HepG2-R) cells. JQ1-resistant cells were constantly stimulated with the BET inhibitor. Additional groups of HepG2-R cells were co-stimulated with JQ1+simvastatin (Sim, 1 µM) or JQ1+Sim+cholesterol (Chol, 50 µM). n = 4 independent experiments. Data represent means ± SD. Statistical analysis was assessed by using one-way ANOVA, followed by Dunnett’s post hoc. * p < 0.05; ** p < 0.01; *** p < 0.001.
Figure 7
Figure 7
JQ1 resistance is accompanied by the upregulation of proteins controlling cholesterol metabolism. (A–D) Representative Western blots and densitometric analysis of SREBP-2, HMGCR, SR-B1and LDLr in JQ1-sensitive cells treated with vehicle (Ctrl) or JQ1 (0.4 µM), and in HepG2-resistant (JQ1-R) cells constantly stimulated with JQ1 (0.4 µM). Experiments were performed after 48 hours. n = 4 independent experiments. Tubulin served as loading control. Data represent means ± SD. Statistical analysis was assessed by using one-way ANOVA followed by Tukey’s post-hoc. * p < 0.05; ** p < 0.01; *** p < 0.001. “a” indicates statistical significance versus control group (Ctrl); “b” indicates statistical significance compared to JQ1 group.

Similar articles

Cited by

References

    1. Wakil S.J., Abu-Elheiga L.A. Fatty acid metabolism: target for metabolic syndrome. J. Lipid Res. 2009;50:S138–S143. doi: 10.1194/jlr.R800079-JLR200. - DOI - PMC - PubMed
    1. Papackova Z., Cahová M. Fatty Acid Signaling: The New Function of Intracellular Lipases. Int. J. Mol. Sci. 2015;16:3831–3855. doi: 10.3390/ijms16023831. - DOI - PMC - PubMed
    1. Trapani L., Segatto M., Pallottini V. Regulation and deregulation of cholesterol homeostasis: The liver as a metabolic “power station”. World J. Hepatol. 2012;4:184–190. doi: 10.4254/wjh.v4.i6.184. - DOI - PMC - PubMed
    1. Chen H.W. Role of cholesterol metabolism in cell growth. Fed. Proc. 1984;43:126–130. - PubMed
    1. Yao C.H., Fowle-Grider R., Mahieu N.G., Liu G.Y., Chen Y.J., Wang R., Singh M., Potter G.S., Gross R.W., Schaefer J., et al. Exogenous Fatty Acids Are the Preferred Source of Membrane Lipids in Proliferating Fibroblasts. Cell Chem. Biol. 2016;23:483–493. doi: 10.1016/j.chembiol.2016.03.007. - DOI - PMC - PubMed

MeSH terms