. 2020 Mar 3;9(5):e014142.
doi: 10.1161/JAHA.119.014142. Epub 2020 Feb 20.

Stim1 Polymorphism Disrupts Immune Signaling and Creates Renal Injury in Hypertension

Affiliations

Stim1 Polymorphism Disrupts Immune Signaling and Creates Renal Injury in Hypertension

Isha S Dhande et al. J Am Heart Assoc. .

Abstract

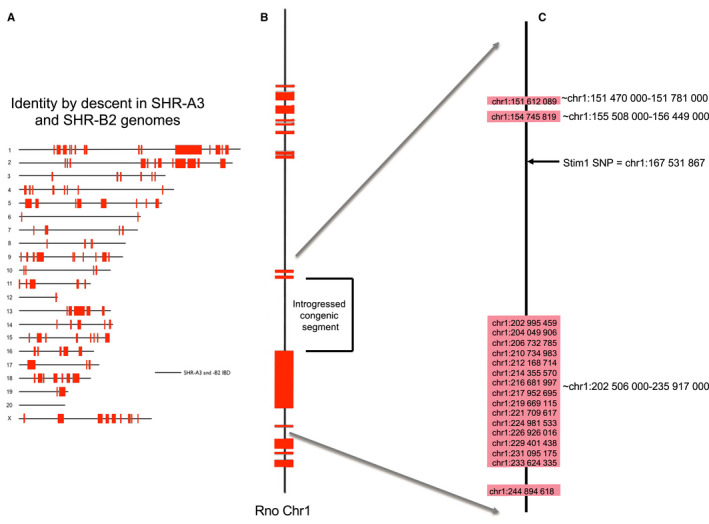
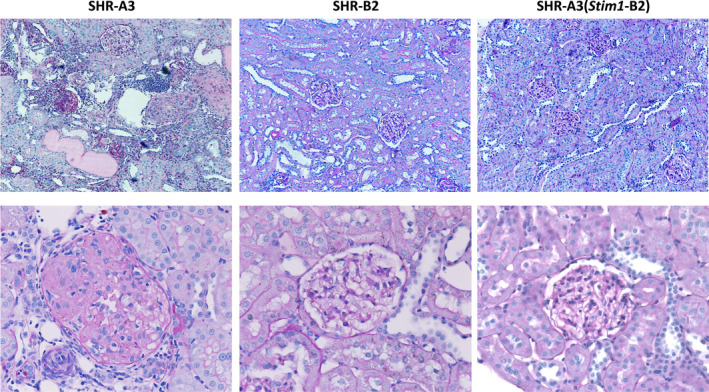
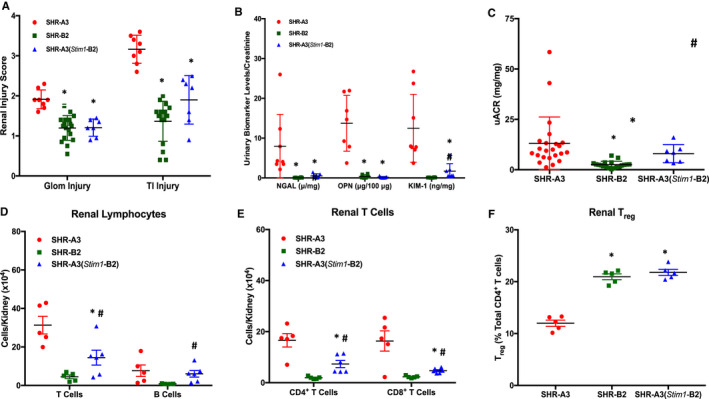
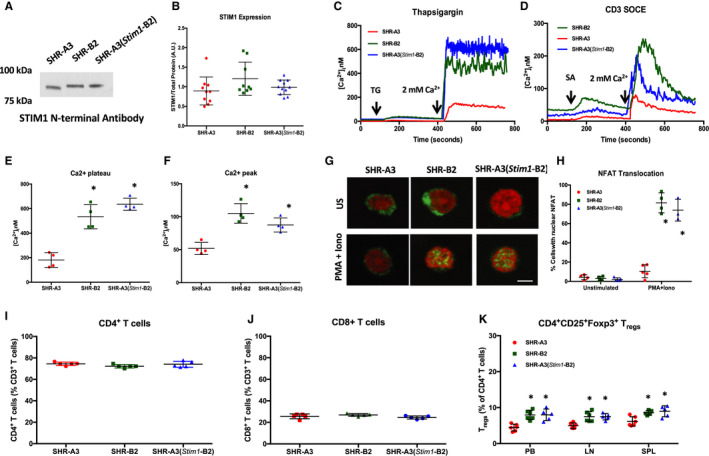
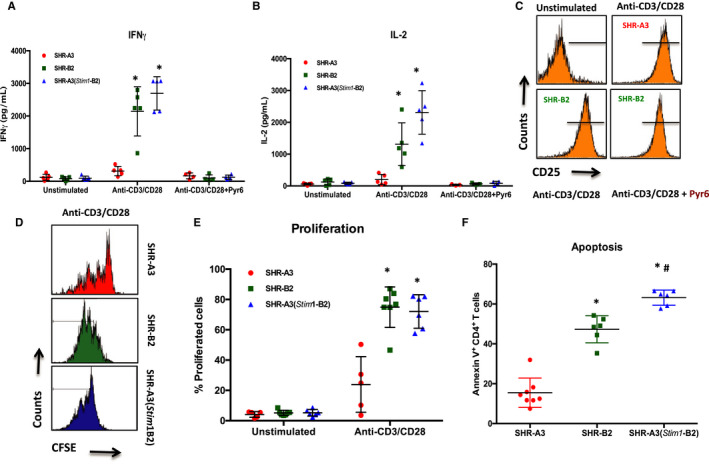
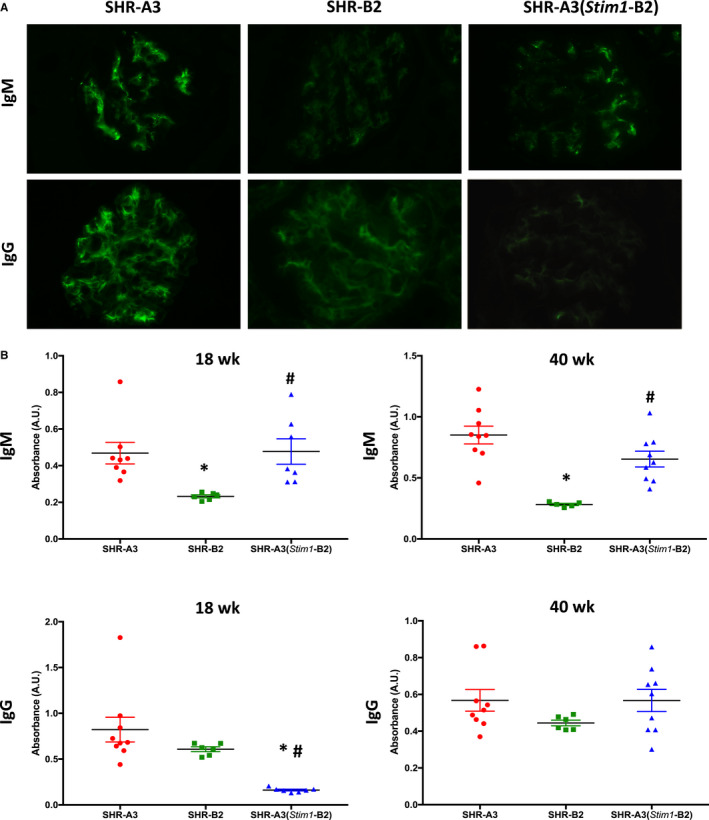
Background Spontaneously hypertensive rats of the stroke-prone line (SHR-A3) develop hypertensive renal disease as a result of naturally occurring genetic variation. Our prior work identified a single-nucleotide polymorphism unique to SHR-A3 that results in truncation of the carboxy terminus of STIM1. The SHR-B2 line, which is also hypertensive but resists hypertensive renal injury, expresses the wild-type STIM1. STIM1 plays a central role in lymphocyte calcium signaling that directs immune effector responses. Here we show that major defects in lymphocyte function affecting calcium signaling, nuclear factor of activated T cells activation, cytokine production, proliferation, apoptosis, and regulatory T-cell development are present in SHR-A3 and attributable to STIM1. Methods and Results To assess the role of Stim1 variation in susceptibility to hypertensive renal injury, we created a Stim1 congenic line, SHR-A3(Stim1-B2), and STIM1 function was rescued in SHR-A3. We found that Stim1 gene rescue restores disturbed lymphocyte function in SHR-A3. Hypertensive renal injury was compared in SHR-A3 and the SHR-A3(Stim1-B2) congenic line. Histologically assessed renal injury was markedly reduced in SHR-A3(Stim1-B2), as were renal injury biomarker levels measured in urine. Stim1 deficiency has been linked to the emergence of antibody-mediated autoimmunity. Renal glomerular immunoglobulin deposition was greater in SHR-A3 than SHR-B2 and was reduced by Stim1 congenic substitution. Serum anti-double-stranded DNA antibody titers in SHR-A3 were elevated compared with SHR-B2 and were reduced in SHR-A3(Stim1-B2). Conclusions Stim1 deficiency in lymphocyte function originating from Stim1 truncation in SHR-A3 combines with hypertension to create end organ disease and may do so as a result of antibody formation.

Keywords: autoimmunity; hypertension; immunoglobulin; renal disease; spontaneously hypertensive rat.


Figures

Figure 1
Figure 1
Chromosome scale view of congenic transfer of an identical‐by‐descent (IBD) haploblock containing wild‐type Stim1 from SHR‐B2 in the SHR‐A3 genetic background. A, Regions of genetic IBD sequences are shown for the SHR‐A3 and SHR‐B2 genomes (20 autosomes and X chromosome. This block was initially identified by genotyping ≈10 000 genome‐wide SNPs. It has been confirmed, and its boundaries precisely defined, by whole‐genome sequencing. All SHR lines are the progeny of a single progenitor male and therefore lack ancestral Y chromosome variation). Red blocks indicate regions of the genome at which the 2 rat lines are descended from different ancestors. Solid black lines represent the remaining 87% of the genome that is IBD. B, Enlarged view of the rat chromosome 1 (Rno chr1) indicating the target haplotype block transferred from SHR‐B2 into the SHR‐A3 background. C, Detailed view of the approximate beginning and end points of the haplotype blocks surrounding the transferred segment (indicated to the right of the blocks and determined by examination of whole‐genome sequence alignments of SHR‐A3 and SHR‐B2). The genomic position of single‐nucleotide polymorphisms in this region that were genotyped in speed congenic construction are indicated above the colored blocks. Inheritance of the Stim1 wild‐type allele was determined by PCR amplification of the sequence including the polymorphic site. Stim1 genotype was determined by restriction digestion of the PCR products with AluI, which digests the SHR‐A3 mutated sequence but not the wild‐type SHR‐B2 sequence. PCR indicates polymerase chain reaction; SHR, spontaneously hypertensive rat; SNP, single‐nucleotide polymorphism.
Figure 2
Figure 2
Effect of the Stim1 mutation on renal injury. Representative PAS‐stained kidney sections (upper panels, ×20; lower panels, ×40 magnification) from 40‐week‐old SHR‐A3, SHR‐B2, and SHR‐A3(Stim1‐B2) rats. PAS indicates periodic acid Schiff stain.
Figure 3
Figure 3
Renal injury and T‐cell infiltration in SHR‐A3, SHR‐B2 and SHR‐A3(Stim1‐B2). A, Glomerular (Glom) and tubulointerstitial (TI) injury scores, n=8 (SHR‐A3), 18 (SHR‐B2), 10 (SHR‐A3[Stim1‐B2]). B, Urinary renal injury biomarker levels for neutrophil gelatinase‐associated lipocalin (NGAL), osteopontin (OPN), and kidney injury molecule‐1 (KIM‐1) normalized to creatinine excretion in urine collected from 30‐week‐old SHR‐A3, SHR‐B2, and SHR‐A3(Stim1‐B2) rats, n=8. C, Urinary albumin excretion normalized to urinary creatinine in 40‐week‐old SHR‐A3, SHR‐B2, and SHR‐A3(Stim1‐B2) rats; n=23 (SHR‐A3), 19 (SHR‐B2), 14 (SHR‐A3[Stim1‐B2]). *P<0.05 vs SHR‐A3 and # P<0.05 vs SHR‐B2. Flow cytometric analysis of (D) T and B cells, (E) CD4+ and CD8+ T‐cell subsets, and (F) Tregs in kidneys from 40‐week‐old SHR‐A3, SHR‐B2, and SHR‐A3(Stim1‐B2) rats; n=5 rats. *P<0.05 vs SHR‐A3 and # P<0.05 vs SHR‐B2. Treg indicates regulatory T cells; uACR, urinary albumin/creatinine ratio.
Figure 4
Figure 4
Effect of the Stim1 mutation on SOCE and NFAT activation in CD4+ T cells. A, Representative Western blot using N‐terminal–directed antibodies demonstrates the presence of STIM1 protein in SHR‐A3, SHR‐B2, and SHR‐A3(Stim1‐B2) T lymphocytes. B, Summary graph showing the results from densitometric analyses of STIM1 bands normalized to the intensities of total protein bands; n=5 per group. C, Average time course for [Ca2+]i influx in response to store depletion by thapsigargin (TG, 2 μmol/L) followed by Ca2+ readdition to induce SOCE. D, Average time course for [Ca2+]i influx in response to anti‐CD3 followed by CD3 cross‐linking with streptavidin (SA) and Ca2+ readdition to induce SOCE. E, Summary graph of sustained phases of TG‐induced Ca2+ influx. F, Summary graph showing peak [Ca2+]i levels in response to CD3 cross‐linking in SHR‐A3, SHR‐B2, and SHR‐A3(Stim1‐B2) CD4+ T cells. G, Confocal microscopy of NFATc1 nuclear translocation in SHR‐A3, SHR‐B2, and SHR‐A3(Stim1‐B2) lymphocytes stimulated for 60 minutes with PMA (10 nmol/L) and ionomycin (2 μmol/L). Green indicates NFATc1 staining, and red indicates nuclear stain using Draq5. H, Summary graph of 3 independent experiments showing the percentage of lymphocytes with NFAT nuclear translocation. Scale bar=1 μm. *P<0.05 vs SHR‐A3 with n=5 per group. Summary graphs of circulating (I) CD4+ and (J) CD8+ T‐cell frequencies as a percentage of total CD3+ T cells in SHR‐A3, SHR‐B2, and SHR‐A3(Stim1‐B2) rats. K, CD4+ CD25+Foxp3+ Treg cell frequencies as a percentage of total CD3+ T cells in peripheral blood (PB), aortic lymph nodes (LN) and spleens (SPL) from SHR‐A3, SHR‐B2, and SHR‐A3(Stim1‐B2) rats. *P<0.05 vs SHR‐A3 with n=5 to 7 per group. Iono indicates ionomycin; NFAT, nuclear factor of activated T cells; PMA, phorbol myristate acetate; SOCE, store‐operated calcium entry; US, unstimulated.
Figure 5
Figure 5
Effect of the Stim1 mutation on CD4+ T‐cell function. Quantification of (A) IFNγ and (B) IL‐2 production by CD4+ T cells from SHR‐A3, SHR‐B2, and SHR‐A3(Stim1‐B2) rats in response to anti‐CD3/anti‐CD28 costimulation for 24 hours under nonpolarizing conditions. A subset of cells was pretreated with the ORAI1 channel blocker Pyr6 (5 μmol/L) for 15 minutes before the addition of CD28. C, Upregulation of the activation marker CD25 on CD4+ T cells after 18 hours of TCR stimulation with anti‐CD3/anti‐CD28. Pretreatment of T cells with Pyr6 did not prevent CD25 expression. Data are representative of 3 independent experiments. D, Histograms showing the intensity peaks of CFSE as an indicator of CD4+ T‐cell proliferation in response to TCR stimulation using anti‐CD3/anti‐CD28 for 72 hours in (upper panels) SHR‐A3, and (lower panels) SHR‐B2 and SHR‐A3(Stim1‐B2) cells. Each peak represents 1 cell division in stimulated cells. E, Summary graph of total percentage of CD4+ T cells undergoing at least 1 cell division. F, Summary graph of Annexin V+ CD4+ T cells from SHR‐A3, SHR‐B2, and SHR‐A3(Stim1‐B2) rats in response to 24‐hour restimulation with anti‐CD3/anti‐CD28 after the initial 72‐hour TCR stimulation with anti‐CD3 and anti‐CD28. *P<0.05 vs SHR‐A3 and # P<0.05 vs SHR‐B2 with n=6 per group. CFSE indicates carboxyfluorescein succinimidyl ester; IFNγ, interferon‐γ; IL‐2, interleukin‐2; TCR, T‐cell receptor.
Figure 6
Figure 6
Renal IgM and IgG in SHR‐A3, SHR‐B2, and SHR‐A3(Stim1‐B2). A, Representative images of immunofluorescent detection of IgM (upper panels) and IgG (lower panels) in kidneys from 40‐week‐old SHR‐A3, SHR‐B2, and SHR‐A3(Stim1‐B2) rats; n=5 to 6 rats. Original magnification ×400 and with an exposure time of 500 ms for all images. B, Serum ELISAs of anti–ds‐DNA for IgM (upper panels) and IgG (lower panels) in 18‐ and 40‐week‐old SHR‐A3, SHR‐B2, and SHR‐A3(Stim1‐B2) rats; n=9 (SHR‐A3), 6 (SHR‐B2), 9 (SHR‐A3[Stim1‐B2]). *P<0.05 vs SHR‐A3 and # P<0.05 vs SHR‐B2.

References

    1. Freedman BI, Soucie JM, McClellan WM. Family history of end‐stage renal disease among incident dialysis patients. J Am Soc Nephrol. 1997;8:1942–1945. - PubMed
    1. Satko SG, Sedor JR, Iyengar SK, Freedman BI. Familial clustering of chronic kidney disease. Semin Dial. 2007;20:229–236. - PubMed
    1. Skrunes R, Svarstad E, Reisaeter AV, Vikse BE. Familial clustering of ESRD in the Norwegian population. Clin J Am Soc Nephrol. 2014;9:1692–1700. - PMC - PubMed
    1. Freedman BI, Spray BJ, Tuttle AB, Buckalew VM Jr. The familial risk of end‐stage renal disease in African Americans. Am J Kidney Dis. 1993;21:387–393. - PubMed
    1. Braun MC, Herring SM, Gokul N, Monita M, Bell R, Zhu Y, Gonzalez‐Garay ML, Wenderfer SE, Doris PA. Hypertensive renal injury is associated with gene variation affecting immune signaling. Circ Cardiovasc Genet. 2014;7:903–910. - PMC - PubMed

Publication types

MeSH terms