. 2020 Mar 30;375(1795):20190333.
doi: 10.1098/rstb.2019.0333. Epub 2020 Feb 10.

Widespread correlation of KRAB zinc finger protein binding with brain-developmental gene expression patterns

Affiliations

Widespread correlation of KRAB zinc finger protein binding with brain-developmental gene expression patterns

Grace Farmiloe et al. Philos Trans R Soc Lond B Biol Sci. .

Abstract

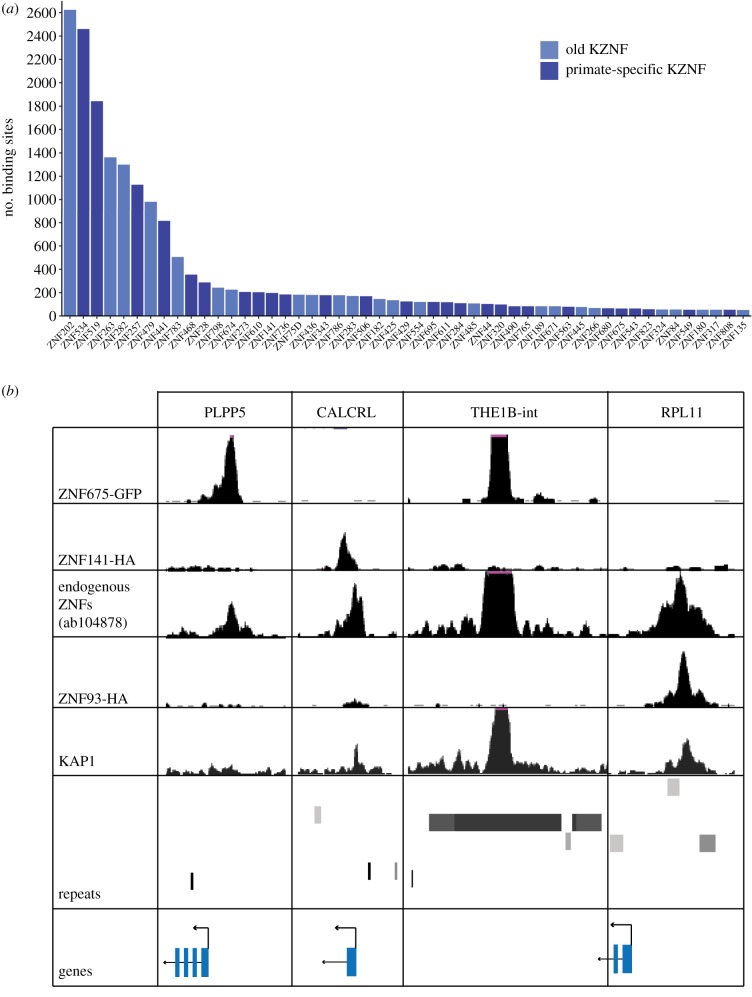
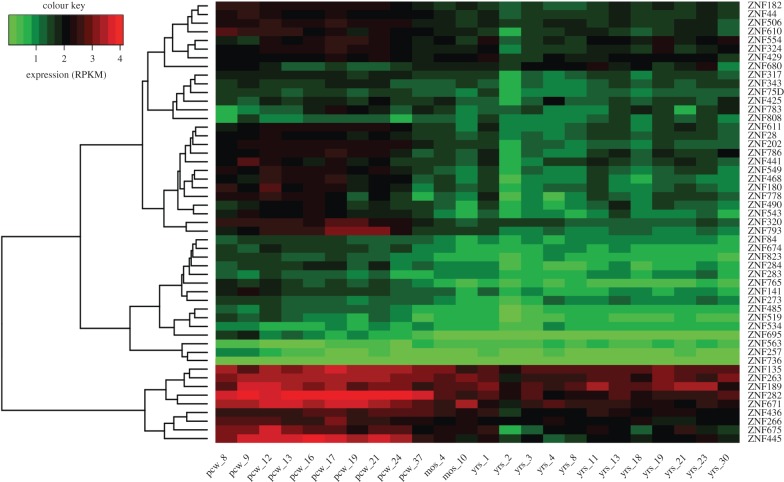
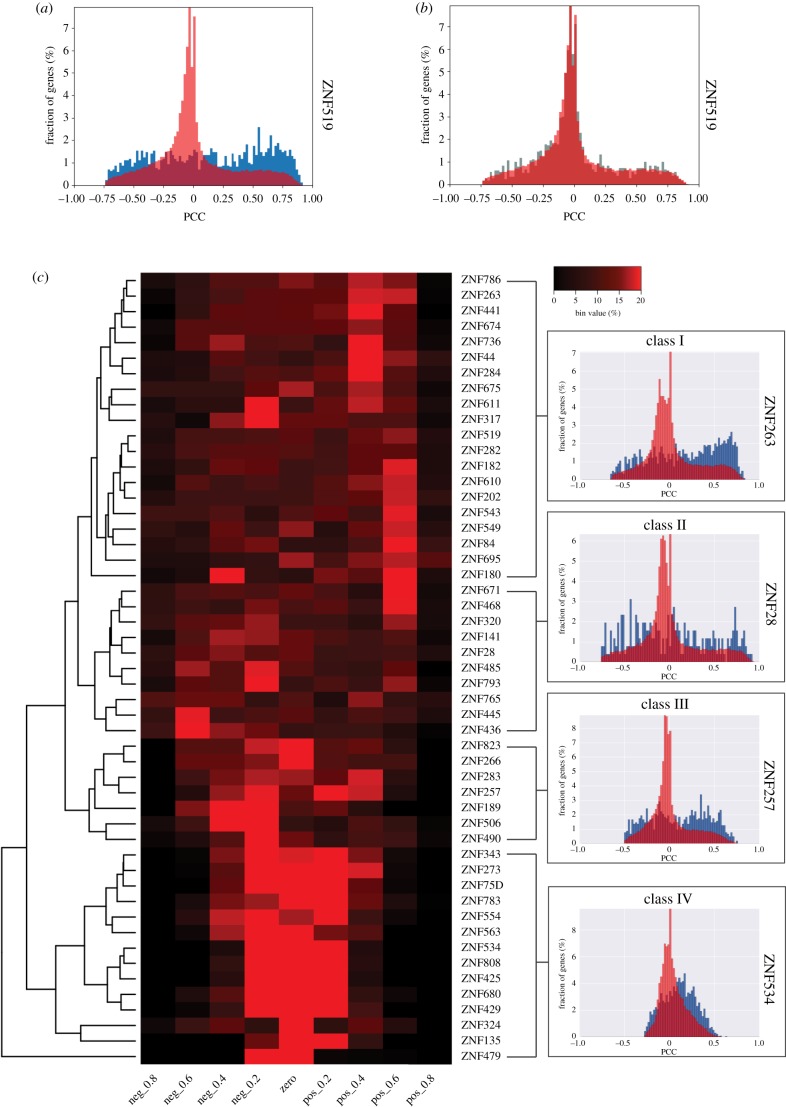
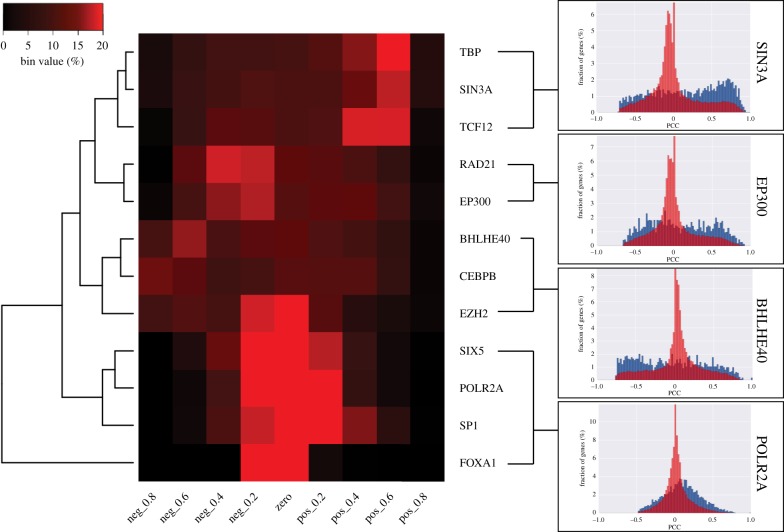
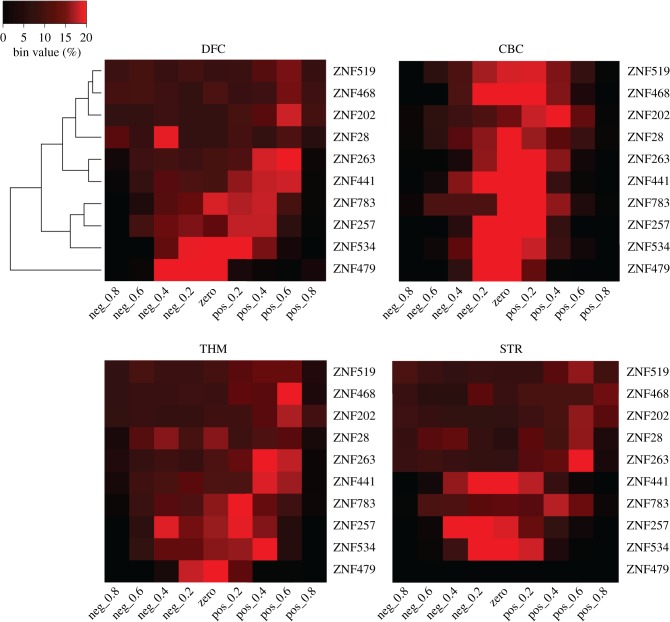
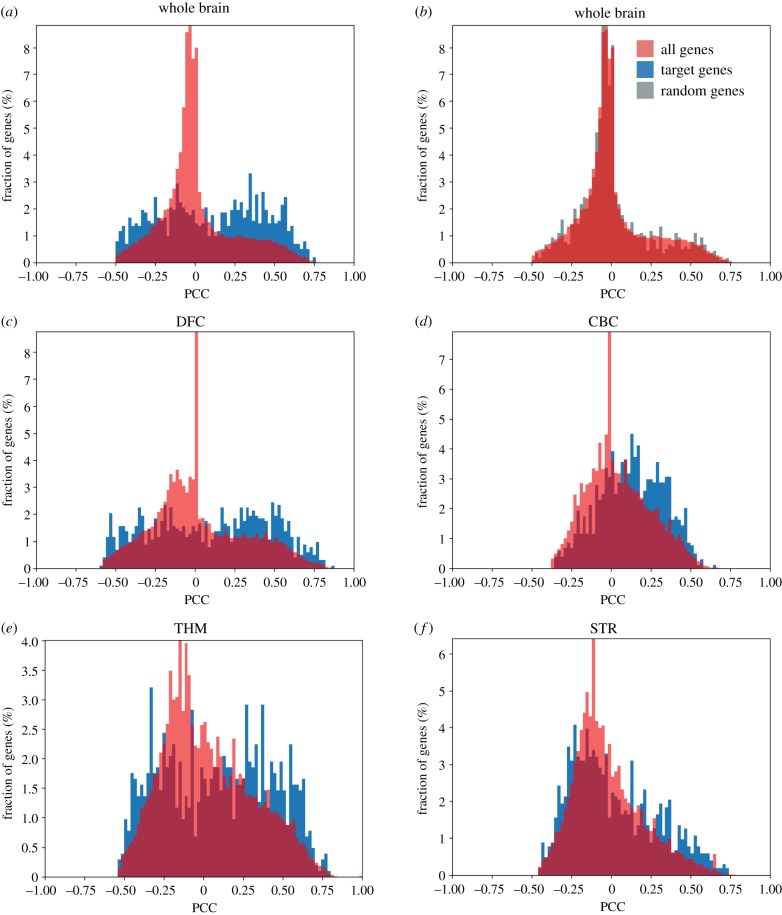
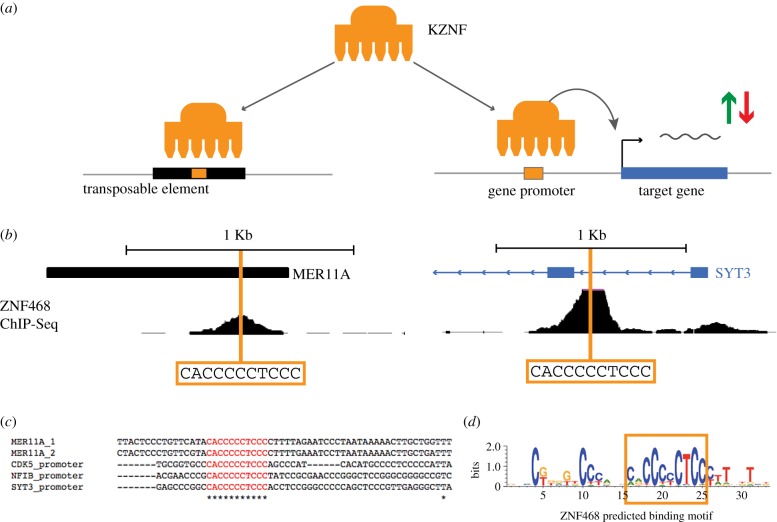
The large family of KRAB zinc finger (KZNF) genes are transcription factors implicated in recognizing and repressing repetitive sequences such as transposable elements (TEs) in our genome. Through successive waves of retrotransposition-mediated insertions, various classes of TEs have invaded mammalian genomes at multiple timepoints throughout evolution. Even though most of the TE classes in our genome lost the capability to retrotranspose millions of years ago, it remains elusive why the KZNFs that evolved to repress them are still retained in our genome. One hypothesis is that KZNFs become repurposed for other regulatory roles. Here, we find evidence that evolutionary changes in KZNFs provide them not only with the ability to repress TEs, but also to bind to gene promoters independent of TEs. Using KZNF binding site data in conjunction with gene expression values from the Allen Brain Atlas, we show that KZNFs have the ability to regulate gene expression in the human brain in a region-specific manner. Our analysis shows that the expression of KZNFs shows correlation with the expression of their target genes, suggesting that KZNFs have a direct influence on gene expression in the developing human brain. The extent of this regulation and the impact it has on primate brain evolution are still to be determined, but our results imply that KZNFs have become widely integrated into neuronal gene regulatory networks. Our analysis predicts that gene expression networks have been repeatedly innovated throughout primate evolution, continuously gaining new layers of gene regulation mediated by both TEs and KZNFs in our genome. This article is part of a discussion meeting issue 'Crossroads between transposons and gene regulation'.

Keywords: KRAB zinc finger proteins; co-option; evolutionary arms race; transposable elements.


Conflict of interest statement

We declare we have no competing interests.

Figures

Figure 1.
Figure 1.
Analysis of KZNF ChIP-seq data at gene promoters. (a) The number of gene promoters bound by KZNFs. Only KZNFs with more than 50 promoter targets are shown. Dark blue bars denote primate-specific KZNFs. Light blue bars indicate evolutionarily older, mammalian KZNFs. (b) ChIP-seq data for experiments using antibodies for KZNF-GFP and KZNF-HA fusion proteins and endogenous KZNFs showing peaks at gene promoters. All windows on the UCSC browser scaled to 50 except for the endogenous KZNF window, which was set to 20.
Figure 2.
Figure 2.
Heatmap showing whole-brain expression over time of all KZNFs that bind greater than 50 gene promoters. Brainspan expression values in reads per kilobase of transcript (RPKM), low expression in green, high expression denoted by red. Ages: postconceptional weeks (pcw), months (mos), years (yrs).
Figure 3.
Figure 3.
Overview of KZNF target gene correlation. (a) Distribution of ZNF519 gene correlation values. Blue histogram indicates ZNF519 correlation with target genes. Red histogram indicates ZNF519 correlation with all genes. PCC, Pearson's correlation coefficient. (b) Distribution of ZNF519 gene correlation values using a random set of target genes (in grey) instead. (c) Heatmap showing the distribution of expression correlation values of genes bound by the ZNFs. Each square represents the percentage of target genes that fall within the range of correlation values covered by each bin. KZNFs clustered using the heatmap.2 dendrogram function; classes were defined using this unbiased clustering. On the right, representative histograms for each cluster showing in blue the distribution of target gene expression correlation values and in red the values of all genes relative to the zinc finger. Black–red gradient indicates the increasing percentage of genes per bin. Max value 20% (red), lowest value 0% (black).
Figure 4.
Figure 4.
Heatmap showing the distribution of expression correlation values of genes bound by 12 documented TFs. Generated with the same method as figure 3. To the right, representative histograms for each of the clusters. Black–red gradient indicates the increasing percentage of genes per bin. Max value 20% (red), lowest value 0% (black).
Figure 5.
Figure 5.
Heatmaps showing the distribution of expression correlation values for each of the top 10 promoter-binding KZNFs across different brain regions. Data from the dorsolateral frontal cortex (DFC), CBC, thalamus (THM) and striatum (STR). ZNF479 showed no expression or correlation values in the striatum and is depicted as a black line here. The order of ZNFs denoted by the clustering in the DFC. Black–red gradient indicates the increasing percentage of genes per bin. Max value 20% (red), lowest value 0% (black).
Figure 6.
Figure 6.
Gene correlation histograms for ZNF257. (a,b) Distributions of expression correlation values of target genes (a) and a set of random genes (b) in the whole brain compared to all genes. All genes are shown in red, target genes in blue and random genes in grey. (cf) Distribution of expression correlation values of target genes versus all genes in the different brain areas (c) DFC, (d) cerebellar cortex (CBC), (e) thalamus (THM) and (f) striatum (STR). For these regions, correlation values of 0.000 were removed owing to the large number of unexpressed genes in specific brain regions.
Figure 7.
Figure 7.
(a) Model showing a mechanism by which gene promoters may have become bound by KZNFs. (b) ChIP-seq data for ZNF468 at a MER11A element and the SYT3 promoter showing a shared binding motif in the core of the ZNF468 binding site. (c) Clustal-O multiple sequence alignment of ZNF468 binding at gene promoters and MER11A elements, the shared core binding site shown in red. (d) The predicted binding motif of ZNF468 based on protein sequence from http://zf.princeton.edu/ [19].

References

    1. Jacobs FMJ, Greenberg D, Nguyen N, Haeussler M, Ewing AD, Katzman S, Paten B, Salama SR, Haussler D. 2014. An evolutionary arms race between KRAB zinc-finger genes ZNF91/93 and SVA/L1 retrotransposons. Nature 516, 242–245. ( 10.1038/nature13760) - DOI - PMC - PubMed
    1. Imbeault M, Helleboid P-Y, Trono D. 2017. KRAB zinc-finger proteins contribute to the evolution of gene regulatory networks. Nature 543, 550–554. ( 10.1038/nature21683) - DOI - PubMed
    1. Pontis J. Planet E, Offner S, Turelli P, Duc J, Coudray A, Theunissen TW, Jaenisch R, Trono D. 2019. Hominoid-specific transposable elements and KZFPs facilitate human embryonic genome activation and control transcription in naive human ESCs. Cell Stem Cell 24, 724–735.e5. ( 10.1016/j.stem.2019.03.012) - DOI - PMC - PubMed
    1. Najafabadi HS, et al. 2015. C2H2 zinc finger proteins greatly expand the human regulatory lexicon. Nat. Biotechnol. 33, 555–562. ( 10.1038/nbt.3128) - DOI - PubMed
    1. Schmitges FW, et al. 2016. Multiparameter functional diversity of human C2H2 zinc finger proteins. Genome Res. 26, 1742–1752. ( 10.1101/gr.209643.116) - DOI - PMC - PubMed

Publication types

Substances