

Effect of polymorphisms in porcine guanylate-binding proteins on host resistance to PRRSV infection in experimentally challenged pigs
- PMID: 32075688
- PMCID: PMC7031929
- DOI: 10.1186/s13567-020-00745-5
Effect of polymorphisms in porcine guanylate-binding proteins on host resistance to PRRSV infection in experimentally challenged pigs
Abstract
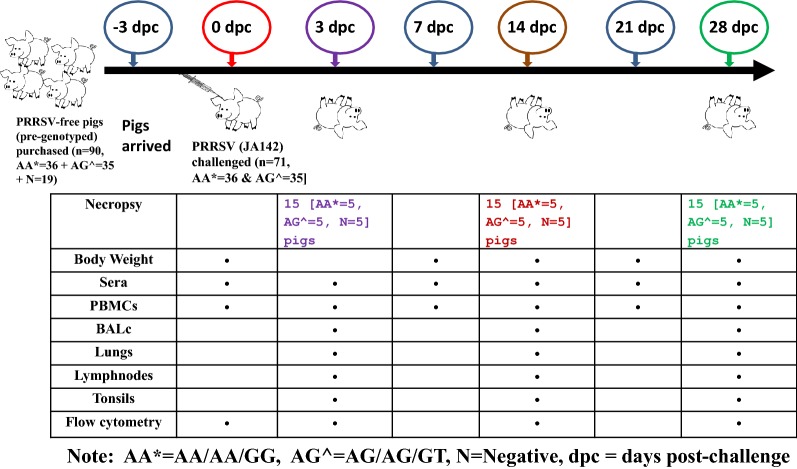
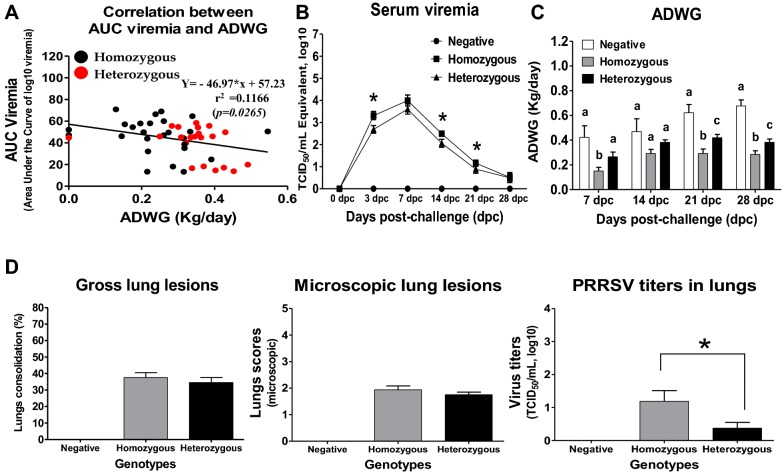
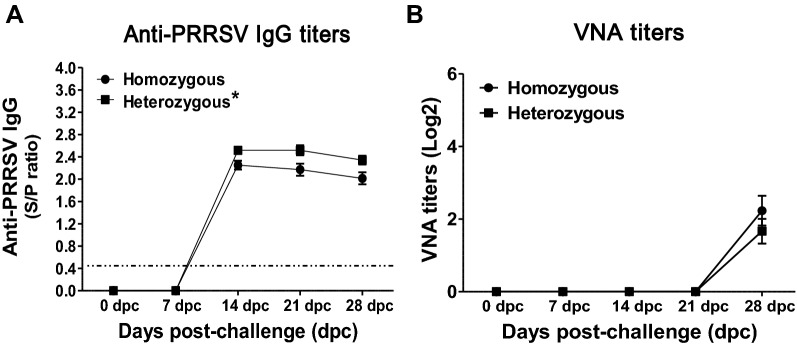
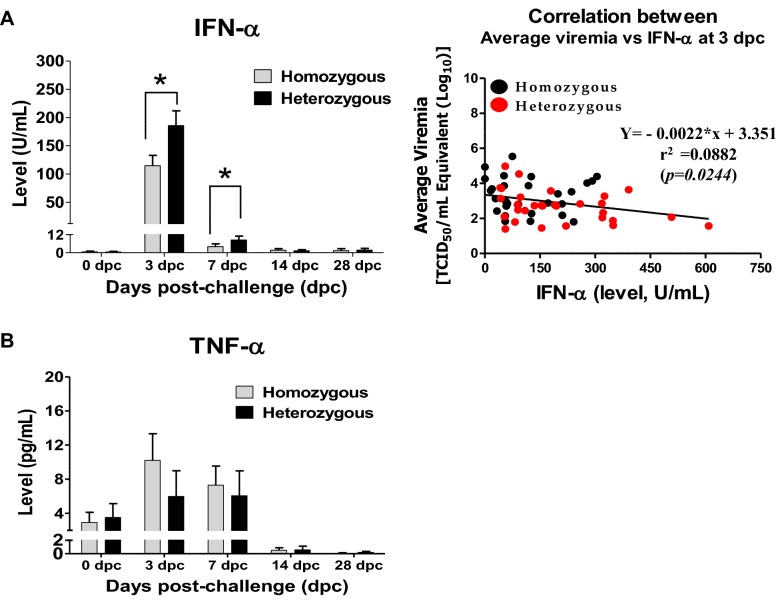
Guanylate-binding proteins (GBP1 and GBP5) are known to be important for host resistance against porcine reproductive and respiratory syndrome virus (PRRSV) infection. In this study, the effects of polymorphisms in GBP1 (GBP1E2 and WUR) and GBP5 on host immune responses against PRRSV were investigated to elucidate the mechanisms governing increased resistance to this disease. Seventy-one pigs [pre-genotyped based on three SNP markers (GBP1E2, WUR, and GBP5)] were assigned to homozygous (n = 36) and heterozygous (n = 35) groups and challenged with the JA142 PRRSV strain. Another group of nineteen pigs was kept separately as a negative control group. Serum and peripheral blood mononuclear cells (PBMCs) were collected at 0, 3, 7, 14, 21 and 28 days post-challenge (dpc). Viremia and weight gain were measured in all pigs at each time point, and a flow cytometry analysis of PBMCs was performed to evaluate T cell activation. In addition, 15 pigs (5 pigs per homozygous, heterozygous and negative groups) were sacrificed at 3, 14 and 28 dpc, and the local T cell responses were evaluated in the lungs, bronchoalveolar lavage cells (BALc), lymph nodes and tonsils. The heterozygous pigs showed lower viral loads in the serum and lungs and higher weight gains than the homozygous pigs based on the area under the curve calculation. Consistently, compared with the homozygous pigs, the heterozygous pigs exhibited significantly higher levels of IFN-α in the serum, proliferation of various T cells (γδT, Th1, and Th17) in PBMCs and tissues, and cytotoxic T cells in the lungs and BALc. These results indicate that the higher resistance in the pigs heterozygous for the GBP1E2, WUR and GBP5 markers could be mediated by increased antiviral cytokine (IFN-α) production and T cell activation.
Conflict of interest statement
The authors declare that they have no competing interests.
Figures


Similar articles
-
A WUR SNP is associated with European Porcine Reproductive and Respiratory Virus Syndrome resistance and growth performance in pigs.Res Vet Sci. 2016 Feb;104:117-22. doi: 10.1016/j.rvsc.2015.12.014. Epub 2015 Dec 23. Res Vet Sci. 2016. PMID: 26850549
-
Effect of polymorphisms in the GBP1, Mx1 and CD163 genes on host responses to PRRSV infection in pigs.Vet Microbiol. 2016 Jan 15;182:187-95. doi: 10.1016/j.vetmic.2015.11.010. Epub 2015 Nov 17. Vet Microbiol. 2016. PMID: 26711047
-
Bioinformatic analyses in early host response to Porcine Reproductive and Respiratory Syndrome virus (PRRSV) reveals pathway differences between pigs with alternate genotypes for a major host response QTL.BMC Genomics. 2016 Mar 8;17:196. doi: 10.1186/s12864-016-2547-z. BMC Genomics. 2016. PMID: 26951612 Free PMC article.
-
Evaluation of local and systemic immune responses in pigs experimentally challenged with porcine reproductive and respiratory syndrome virus.Vet Res. 2020 May 13;51(1):66. doi: 10.1186/s13567-020-00789-7. Vet Res. 2020. PMID: 32404209 Free PMC article.
-
Effect of a major quantitative trait locus for porcine reproductive and respiratory syndrome (PRRS) resistance on response to coinfection with PRRS virus and porcine circovirus type 2b (PCV2b) in commercial pigs, with or without prior vaccination for PRRS.J Anim Sci. 2017 Feb;95(2):584-598. doi: 10.2527/jas.2016.1071. J Anim Sci. 2017. PMID: 28380604
Cited by
-
Role of genetic factors in different swine breeds exhibiting varying levels of resistance/susceptibility to PRRSV.Virus Res. 2023 Mar;326:199057. doi: 10.1016/j.virusres.2023.199057. Epub 2023 Feb 3. Virus Res. 2023. PMID: 36731630 Free PMC article. Review.
-
Candidate markers for enhanced host response to PRRS have scarce adverse effects on pigs' growth and production.Porcine Health Manag. 2024 Aug 21;10(1):29. doi: 10.1186/s40813-024-00379-5. Porcine Health Manag. 2024. PMID: 39169441 Free PMC article.
-
When human guanylate-binding proteins meet viral infections.J Biomed Sci. 2021 Mar 5;28(1):17. doi: 10.1186/s12929-021-00716-8. J Biomed Sci. 2021. PMID: 33673837 Free PMC article. Review.
-
Cell deconvolution-based integrated time-series network of whole blood transcriptome reveals systemic antiviral activities and cell-specific immunological changes against PRRSV infection.Vet Res. 2025 Jan 22;56(1):19. doi: 10.1186/s13567-025-01451-w. Vet Res. 2025. PMID: 39844283 Free PMC article.
-
Selection for Resilience in Livestock Production Systems.Int J Mol Sci. 2024 Dec 6;25(23):13109. doi: 10.3390/ijms252313109. Int J Mol Sci. 2024. PMID: 39684818 Free PMC article. Review.
References
-
- Cavanagh D. Nidovirales: a new order comprising Coronaviridae and Arteriviridae. Arch Virol. 1997;142:629–633. - PubMed
-
- International Committee on Taxonomy of Viruses (ICTV) (2018). https://talk.ictvonline.org//taxonomy/p/taxonomy-history?taxnode_id=2018.... Accessed 18 July 2018
-
- Holtkamp DJ, Kliebenstein JB, Neumann E, Zimmerman JJ, Rotto H, Yoder TK, Wang C, Yeske P, Mowrer CL, Haley CA. Assessment of the economic impact of porcine reproductive and respiratory syndrome virus on United States pork producers. J Swine Health Prod. 2013;21:72.
MeSH terms
Substances
Grants and funding
LinkOut - more resources
Full Text Sources
