. 2020 Mar 11;27(3):467-475.e6.
doi: 10.1016/j.chom.2020.01.016. Epub 2020 Feb 18.

Fecal IgA Levels Are Determined by Strain-Level Differences in Bacteroides ovatus and Are Modifiable by Gut Microbiota Manipulation

Affiliations

Fecal IgA Levels Are Determined by Strain-Level Differences in Bacteroides ovatus and Are Modifiable by Gut Microbiota Manipulation

Chao Yang et al. Cell Host Microbe. .

Abstract

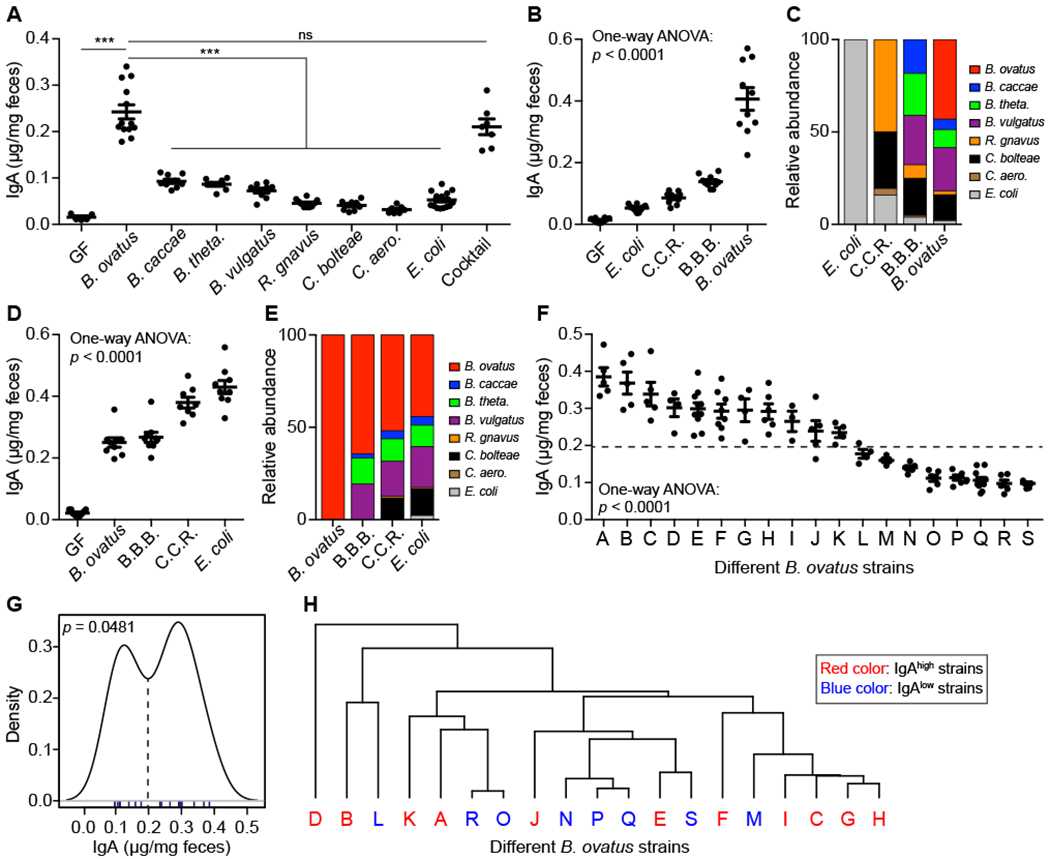
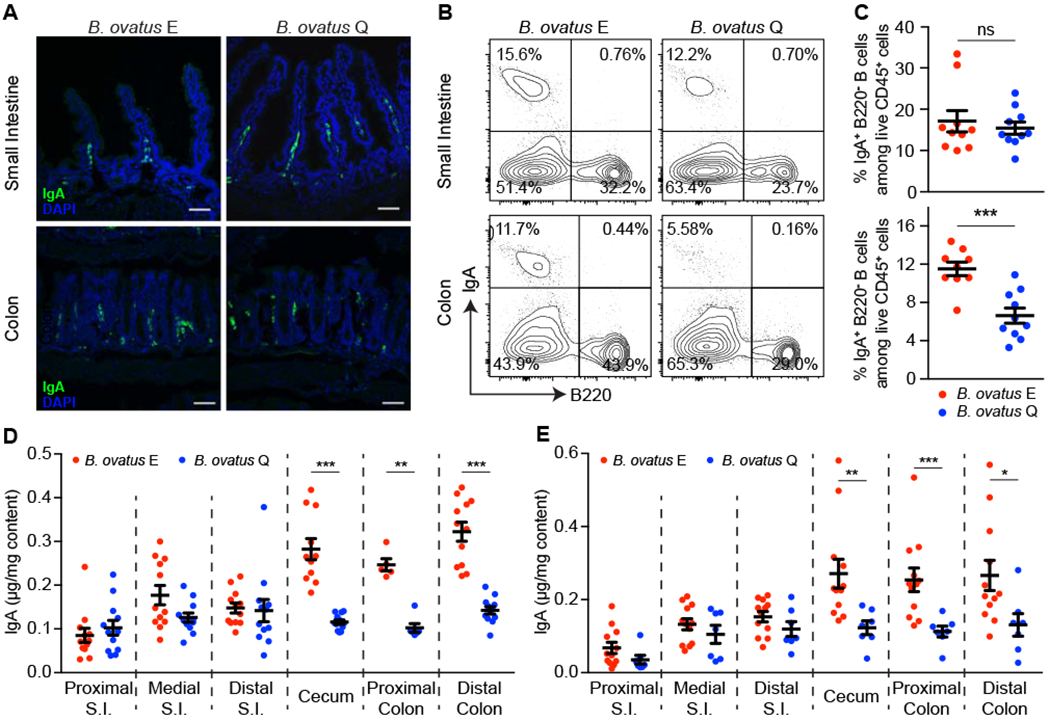
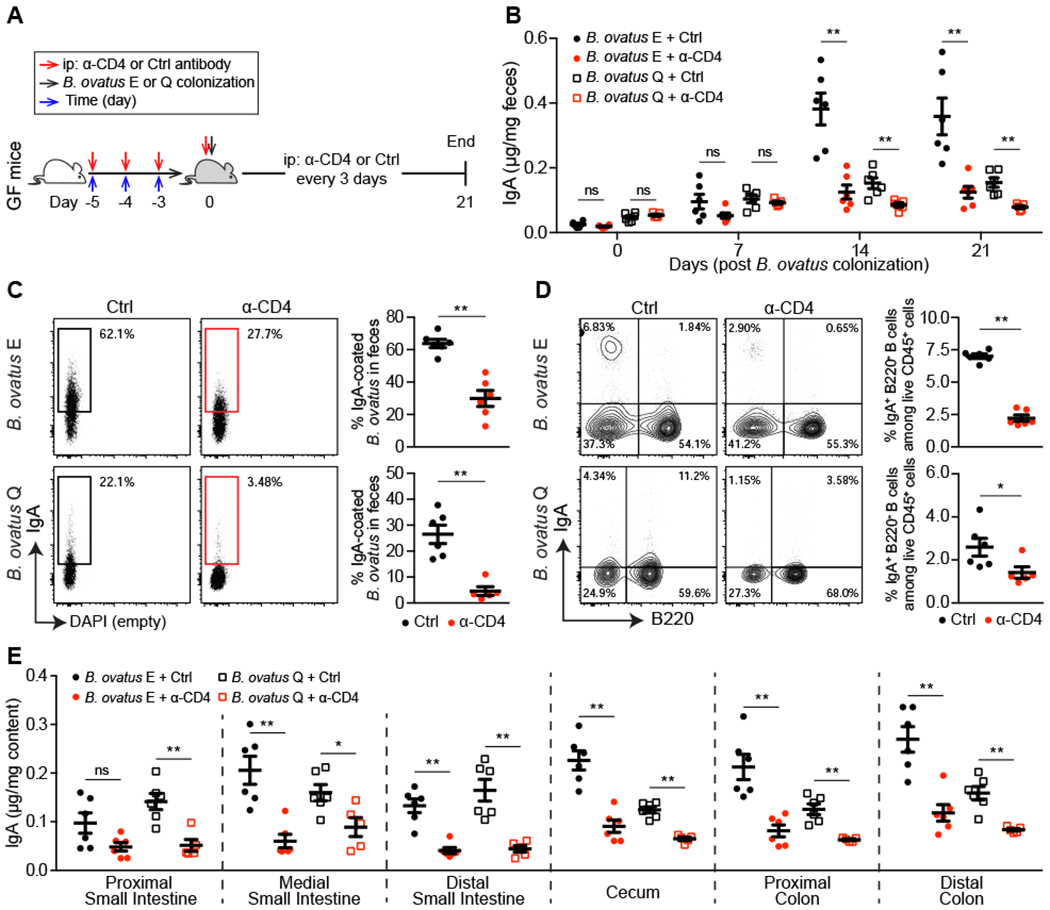
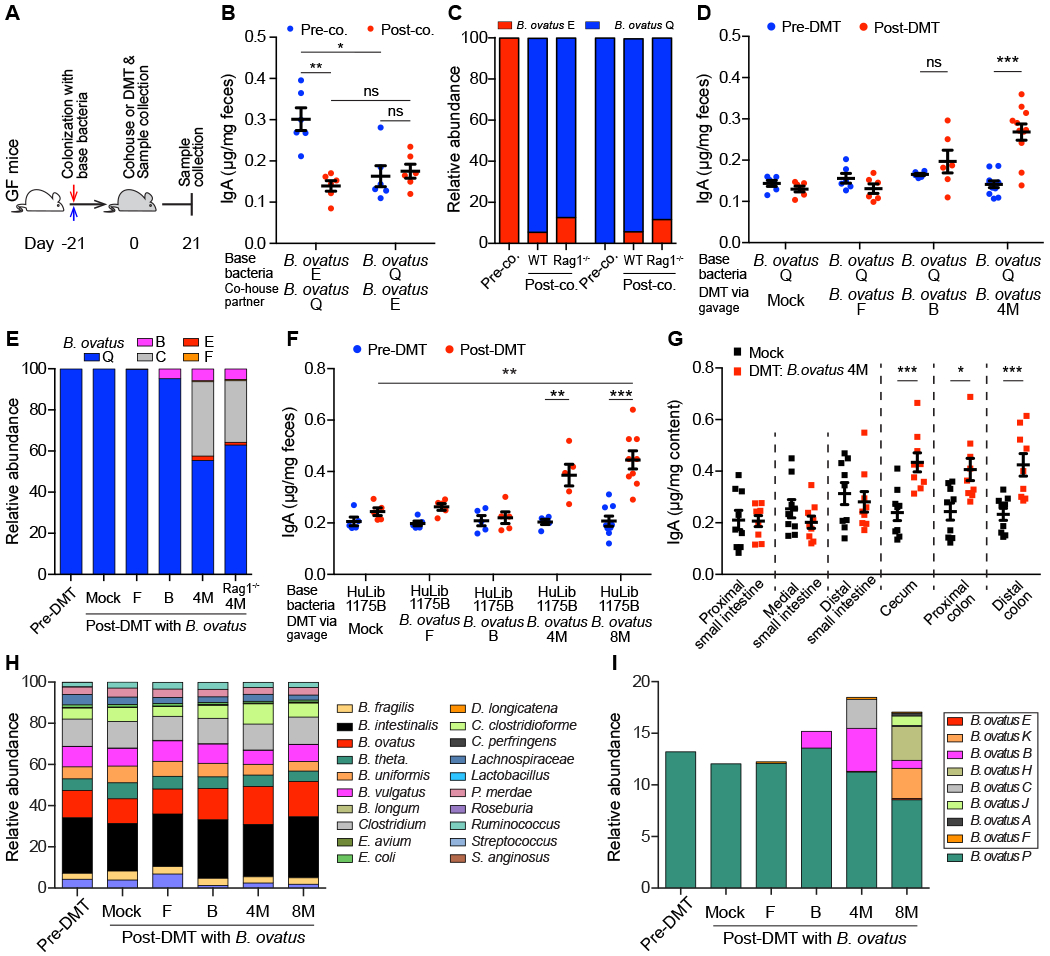
Fecal IgA production depends on colonization by a gut microbiota. However, the bacterial strains that drive gut IgA production remain largely unknown. Here, we assessed the IgA-inducing capacity of a diverse set of human gut microbial strains by monocolonizing mice with each strain. We identified Bacteroides ovatus as the species that best induced gut IgA production. However, this induction varied bimodally across different B. ovatus strains. The high IgA-inducing B. ovatus strains preferentially elicited more IgA production in the large intestine through the T cell-dependent B cell-activation pathway. Remarkably, a low-IgA phenotype in mice could be robustly and consistently converted into a high-IgA phenotype by transplanting a multiplex cocktail of high IgA-inducing B. ovatus strains but not individual ones. Our results highlight the critical importance of microbial strains in driving phenotype variation in the mucosal immune system and provide a strategy to robustly modify a gut immune phenotype, including IgA production.

Keywords: Bacteroides ovatus; gut microbiota; immune modulation; immunoglobulin A; strains.


Conflict of interest statement

Declaration of Interests J.J.F. serves as a consultant for Janssen Research & Development LLC. All remaining authors declare no conflict of interests.

Figures

Figure 1.
Figure 1.. Select B. ovatus Strains Dominate Fecal IgA Induction in Gnotobiotic Mice.
(A) Fecal IgA level in C57BL/6 gnotobiotic mice colonized with individual or a cocktail of human gut commensal bacteria. (B-E) Concentration of fecal IgA (B and D) and relative abundance of each bacterial strain (C and E) in the stool of gnotobiotic mice colonized sequentially with bacteria starting from E. coli (B and C) or B. ovatus (D and E). C.C.R.: mix of C. bolteae, C. aero. and R. gnavus; B.B.B.: mix of B. caccae, B. theta. and B. vulgatus. (F) Quantification of fecal IgA in monocolonized mice with an individual strain of B. ovatus. Dotted line separates high- and low-IgA phenotypes. (G) Statistical test of binomial distribution of B. ovatus strains based on fecal IgA induction in monocolonzied mice. (H) Dendrogram clustering of different B. ovatus strains based on genomic sequence. Data shown are mean ± SEM of 2-3 independent experiments and each dot represents the value for one mouse. Mann-Whitney test and one-way ANOVA were used; ***p < 0.001; ns, not significant. See also Figure S1 and Table S1, S2, S3.
Figure 2.
Figure 2.. IgAhigh B. ovatus Strain Elicits Stronger IgA Responses in the Large Intestine.
(A) Representative images of IgA+ cells in small intestine and the colon. IgA+ cells were stained with anti-IgA (green); Nuclei were counter-stained with DAPI (4’,6-diamidino-2-phenylindole) (blue). n = 5~. Scale bar = 50 μm. (B and C) Representative flow cytometry plot (B) and quantification of IgA-secreting cells (C) in small intestine and colon are shown. (D and E) Concentration of luminal IgA along the length of the intestinal tract in monocolonized C57BL/6 mice (D) and Swiss Webster mice (E). S.I.: small intestine. Data shown are mean ± SEM of 2-3 independent experiments and each dot represents the value for one mouse. Mann-Whitney test was used; **p < 0.01, ***p < 0.001; ns, not significant. See also Figure S2 and Table S2.
Figure 3.
Figure 3.. T-cell-dependent B Cell Activation Pathway Plays An Essential Role in B. ovatus Induced Fecal IgA Production.
(A) Schematic representation of CD4+ T cells depletion in germ-free mice. (B) Dynamics of fecal IgA concentration in B. ovatus monocolonized mice w/o anti-CD4 antibody treatment. (C) Representative flow cytometry plot and quantification of IgA-coated bacteria in the feces of monocolonized mice w/o anti-CD4 antibody treatment. (D) Representative flow cytometry plot and percentage of IgA-secreting B cells in the colon of monocolonized mice w/o anti-CD4 antibody treatment. (E) Concentration of luminal IgA along the length of the intestinal tract of monocolonized mice w/o anti-CD4 antibody treatment. Data shown are mean ± SEM and each dot represents the value for one mouse. Mann-Whitney test was used; *p < 0.05, **p < 0.01; ns, not significant. See also Figure S3 and Table S2.
Figure 4.
Figure 4.. Multiplex Microbial Strains Robustly Transfer High-IgA Phenotype to Low-IgA Producing Mice.
(A) Schematic representation of cohousing and defined microbial transplant (DMT) strategies. (B and C) Fecal IgA concentration (B) and relative abundance of each B. ovatus strain (C) in pre- and post-cohoused gnotobiotic mice, which were pre-colonized with either B. ovatus strain E or Q. (D and E) Fecal IgA concentration (D) and relative abundance of each B. ovatus strain (E) in mice pre- and post-DMT. Mice were pre-colonized with B. ovatus strain Q before DMT. (F) Fecal IgA concentration in mice pre- and post-DMT, which were pre-colonized with human microbiota culture collection (i.e. HuLib1175B). Mock: PBS; B. ovatus 4M/8M: a cocktail of 4/8 different IgAhigh B. ovatus strains (G) Concentration of luminal IgA along the length of the intestinal tract of mice after DMT with Mock or B. ovatus 4M. (H and I) Relative abundance of bacterial species (H) and different B. ovatus strains (I) in mice pre- and post-DMT. Data shown are mean ± SEM of 2-3 independent experiments and each dot represents the value for one mouse. Mann-Whitney test was used; *p < 0.05, **p < 0.01, ***p < 0.001; ns, not significant. See also Figure S4 and Table S4.

Comment in

References

    1. Arthur JC, Perez-Chanona E, Muhlbauer M, Tomkovich S, Uronis JM, Fan TJ, Campbell BJ, Abujamel T, Dogan B, Rogers AB, et al. (2012). Intestinal inflammation targets cancer-inducing activity of the microbiota. Science 338, 120–123. - PMC - PubMed
    1. Atarashi K, Tanoue T, Shima T, Imaoka A, Kuwahara T, Momose Y, Cheng G, Yamasaki S, Saito T, Ohba Y, et al. (2011). Induction of colonic regulatory T cells by indigenous Clostridium species. Science 331, 337–341. - PMC - PubMed
    1. Britton GJ, Contijoch EJ, Mogno I, Vennaro OH, Llewellyn SR, Ng R, Li Z, Mortha A, Merad M, Das A, et al. (2019). Microbiotas from Humans with Inflammatory Bowel Disease Alter the Balance of Gut Th17 and RORgammat(+) Regulatory T Cells and Exacerbate Colitis in Mice. Immunity 50, 212–224 e214. - PMC - PubMed
    1. Brynildsrud O, Bohlin J, Scheffer L, and Eldholm V (2016). Rapid scoring of genes in microbial pangenome-wide association studies with Scoary. Genome Biol 17, 238. - PMC - PubMed
    1. Bunker JJ, Drees C, Watson AR, Plunkett CH, Nagler CR, Schneewind O, Eren AM, and Bendelac A (2019). B cell superantigens in the human intestinal microbiota. Sci Transl Med 11. - PMC - PubMed

Substances

Supplementary concepts