. 2020 Apr 7;118(7):1612-1620.
doi: 10.1016/j.bpj.2020.01.030. Epub 2020 Feb 4.

How Nanopore Translocation Experiments Can Measure RNA Unfolding

Affiliations

How Nanopore Translocation Experiments Can Measure RNA Unfolding

Prasad Bandarkar et al. Biophys J. .

Abstract

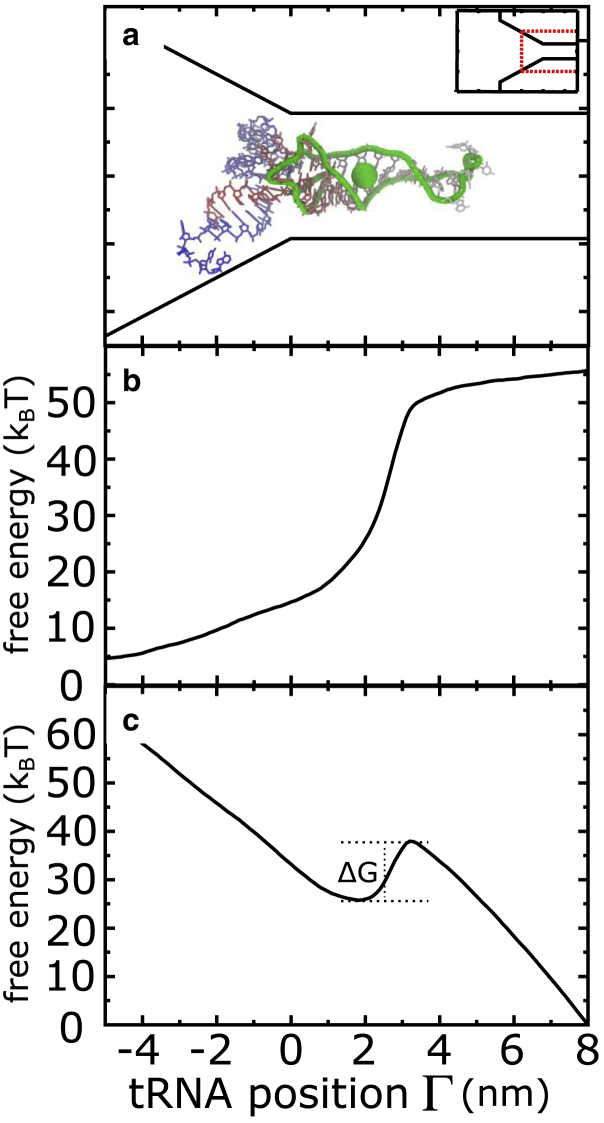
Electrokinetic translocation of biomolecules through solid-state nanopores represents a label-free single-molecule technique that may be used to measure biomolecular structure and dynamics. Recent investigations have attempted to distinguish individual transfer RNA (tRNA) species based on the associated pore translocation times, ion-current noise, and blockage currents. By manufacturing sufficiently smaller pores, each tRNA is required to undergo a deformation to translocate. Accordingly, differences in nanopore translocation times and distributions may be used to infer the mechanical properties of individual tRNA molecules. To bridge our understanding of tRNA structural dynamics and nanopore measurements, we apply molecular dynamics simulations using a simplified "structure-based" energetic model. Calculating the free-energy landscape for distinct tRNA species implicates transient unfolding of the terminal RNA helix during nanopore translocation. This provides a structural and energetic framework for interpreting current experiments, which can aid the design of methods for identifying macromolecules using nanopores.


Figures

Figure 1
Figure 1
Schematic representation of a tRNA-nanopore experiment. A dielectric membrane (gray) separates the electrolytic cell into two chambers, and solvent is allowed to pass through a nanometer-scale pore. The geometry of a nanopore typically consists of conical openings connected by a cylindrical region. Here, the diameter of the cylinder is drawn to scale, relative to the dimensions of a tRNA molecule. Because of the L-shaped structure of a tRNA molecule, translocation through a nanopore requires molecular deformations, which may involve a range of distortions. The detailed character of these deformations will govern the measured changes in ion currents. To see this figure in color, go online.
Figure 2
Figure 2
Modeled pore geometry and calculated free-energy profiles. (a) Schematic representation of a 3.7-nm diameter pore (full pore dimensions shown in inset) is shown. tRNAArg is shown to scale. Here, translocation through the pore is described by the coordinate Γ: axial position of the center of mass of the residues near the anticodon stem-loop (ASL) region. The ASL region used for center-of-mass calculations is shown in green tubes, and the position of the center of mass is depicted by the green sphere. (b) The free-energy profile in the absence of an applied electric field is shown. As expected, there is a large (>50kBT ) barrier, which is consistent with a lack of observed translocation events in the absence of an applied field (46). (c) The free-energy profile obtained after including the effect of an external potential with a strength of 200 mV is shown. Under these conditions, the predicted free-energy barrier ΔG is ∼12kBT. To see this figure in color, go online.
Figure 3
Figure 3
Predicted mean first-passage times (MFPTs) are comparable to experimental dwell times. (a) The MFPTs predicted for tRNAArg as a function of applied field strength for different values of the ion condensation factor θc (dashed lines) are shown. The experimentally measured dwell times are within the range of the predicted values, which illustrates how a simple energetic model can predict an overall timescale that is consistent with experimental measurements. (b) Experimental dwell times for tRNAArg and tRNAIle show a distinct separation in which shorter dwell times are associated with tRNAIle. This separation in timescales is consistent with previous experimental measurements (12). Here, to reduce the influence of pore heterogeneity, measurements were taken for both species using the same physical pore. (c) Theoretical MFPTs for tRNAArg and tRNAIle (θc = 0.25 and 0.40 shown) also predict faster kinetics are associated with tRNAIle. Overall, the structure-based model identifies differential kinetics and timescales that are similar to experiments. To see this figure in color, go online.
Figure 4
Figure 4
Pore entry leads to tRNA unfolding. (a) Average fraction of native contacts formed per residue Qi, as a function of tRNA translocation, for tRNAArg. Gray indicates that a residue does not have any contacts in the native structure. As the tRNA molecule initially enters the pore (Γ ∼3 nm), there is a sharp decrease in the fraction of native contacts formed (∼0.9 to ∼0.2) in the acceptor arm and 3′-CCA end (Fig. 1). (b) The average Hellinger distance per residue (Hi), as a function of the translocation coordinate Γ, for tRNAArg. There is an abrupt decrease in Hi (from ∼0.7 to ∼0.4) for acceptor arm residues, which signifies an increase in disorder of the tRNA backbone. Similarly, Qi and Hi calculated for tRNAIle (c and d) confirm that a decrease in native content and an increase in disorder are associated with nanopore translocation for both molecules. To see this figure in color, go online.
Figure 5
Figure 5
Nonmonotonic configurational entropy during translocation. (a) During the initial association with the pore (Γ < 0), there is a modest decrease in configurational entropy, which is followed by a sharp increase during translocation (Γ > 0). (b) The initial decrease in configurational entropy may be partially attributed to the reduction in accessible rotational motion, as measured by the orientational order parameter m¯. (c) During translocation, the overall increase in biomolecular disorder, as measured by the average value of H for acceptor arm residues (H¯), can rationalize the sharp increase in configurational entropy. This overall nonmonotonic behavior of ΔS suggests that tRNA capture and translocation will have opposing dependencies on temperature. To see this figure in color, go online.

References

    1. Dekker C. Solid-state nanopores. Nat. Nanotechnol. 2007;2:209–215. - PubMed
    1. Venkatesan B.M., Bashir R. Nanopore sensors for nucleic acid analysis. Nat. Nanotechnol. 2011;6:615–624. - PubMed
    1. Miles B.N., Ivanov A.P., Edel J.B. Single molecule sensing with solid-state nanopores: novel materials, methods, and applications. Chem. Soc. Rev. 2013;42:15–28. - PubMed
    1. Spitzberg J.D., Zrehen A., Meller A. Plasmonic-nanopore biosensors for superior single-molecule detection. Adv. Mater. 2019;31:e1900422. - PubMed
    1. Danda G., Drndić M. Two-dimensional nanopores and nanoporous membranes for ion and molecule transport. Curr. Opin. Biotechnol. 2019;55:124–133. - PubMed

Publication types

LinkOut - more resources