. 2020 Feb 18;30(7):2055-2064.e5.
doi: 10.1016/j.celrep.2020.01.059.

High-Throughput Drug Screening Identifies a Potent Wnt Inhibitor that Promotes Airway Basal Stem Cell Homeostasis

Affiliations

High-Throughput Drug Screening Identifies a Potent Wnt Inhibitor that Promotes Airway Basal Stem Cell Homeostasis

Cody J Aros et al. Cell Rep. .

Abstract

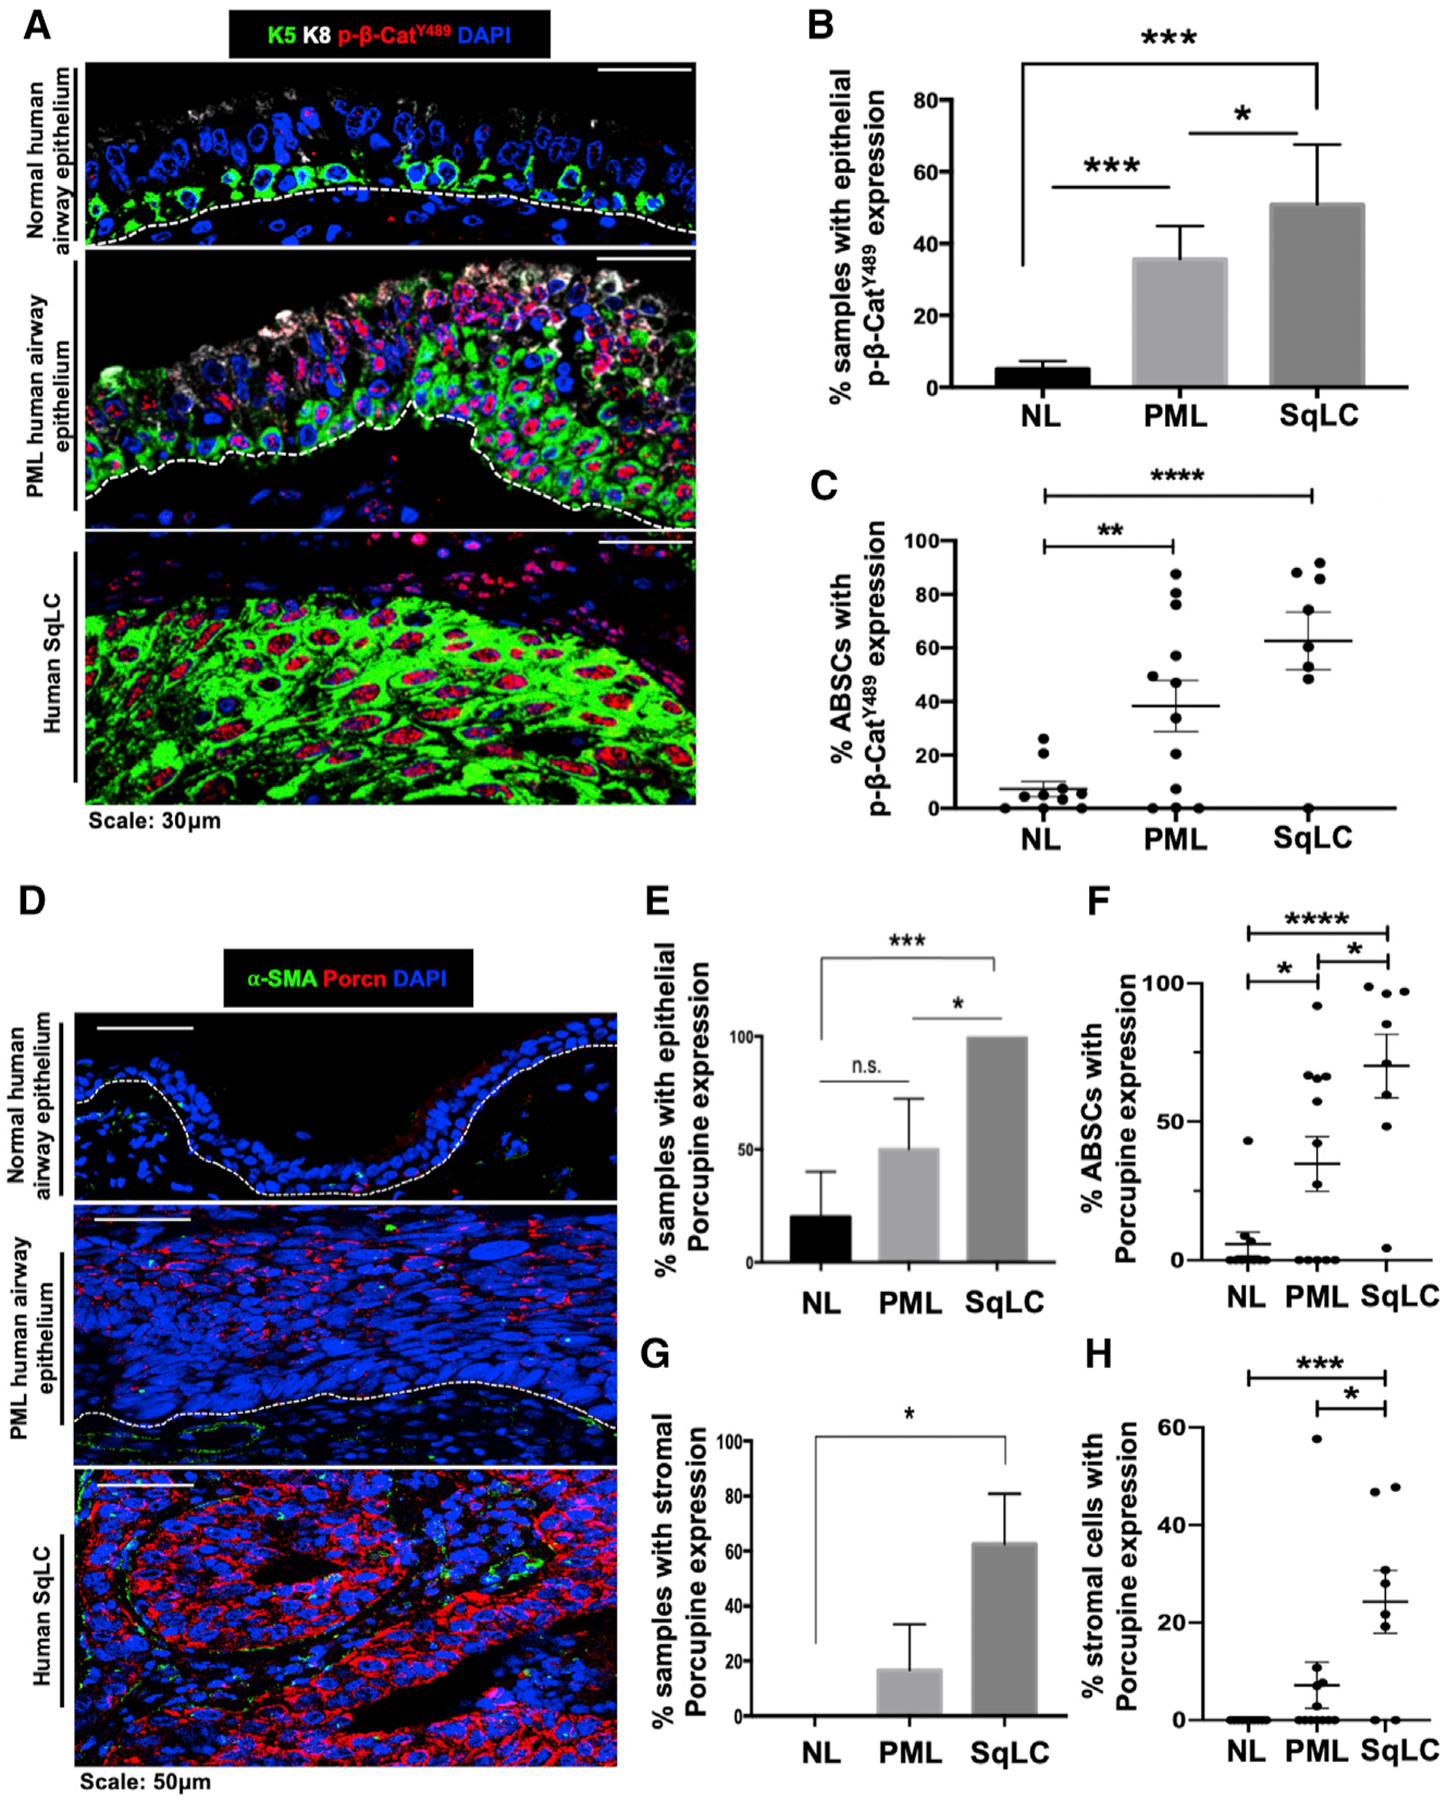
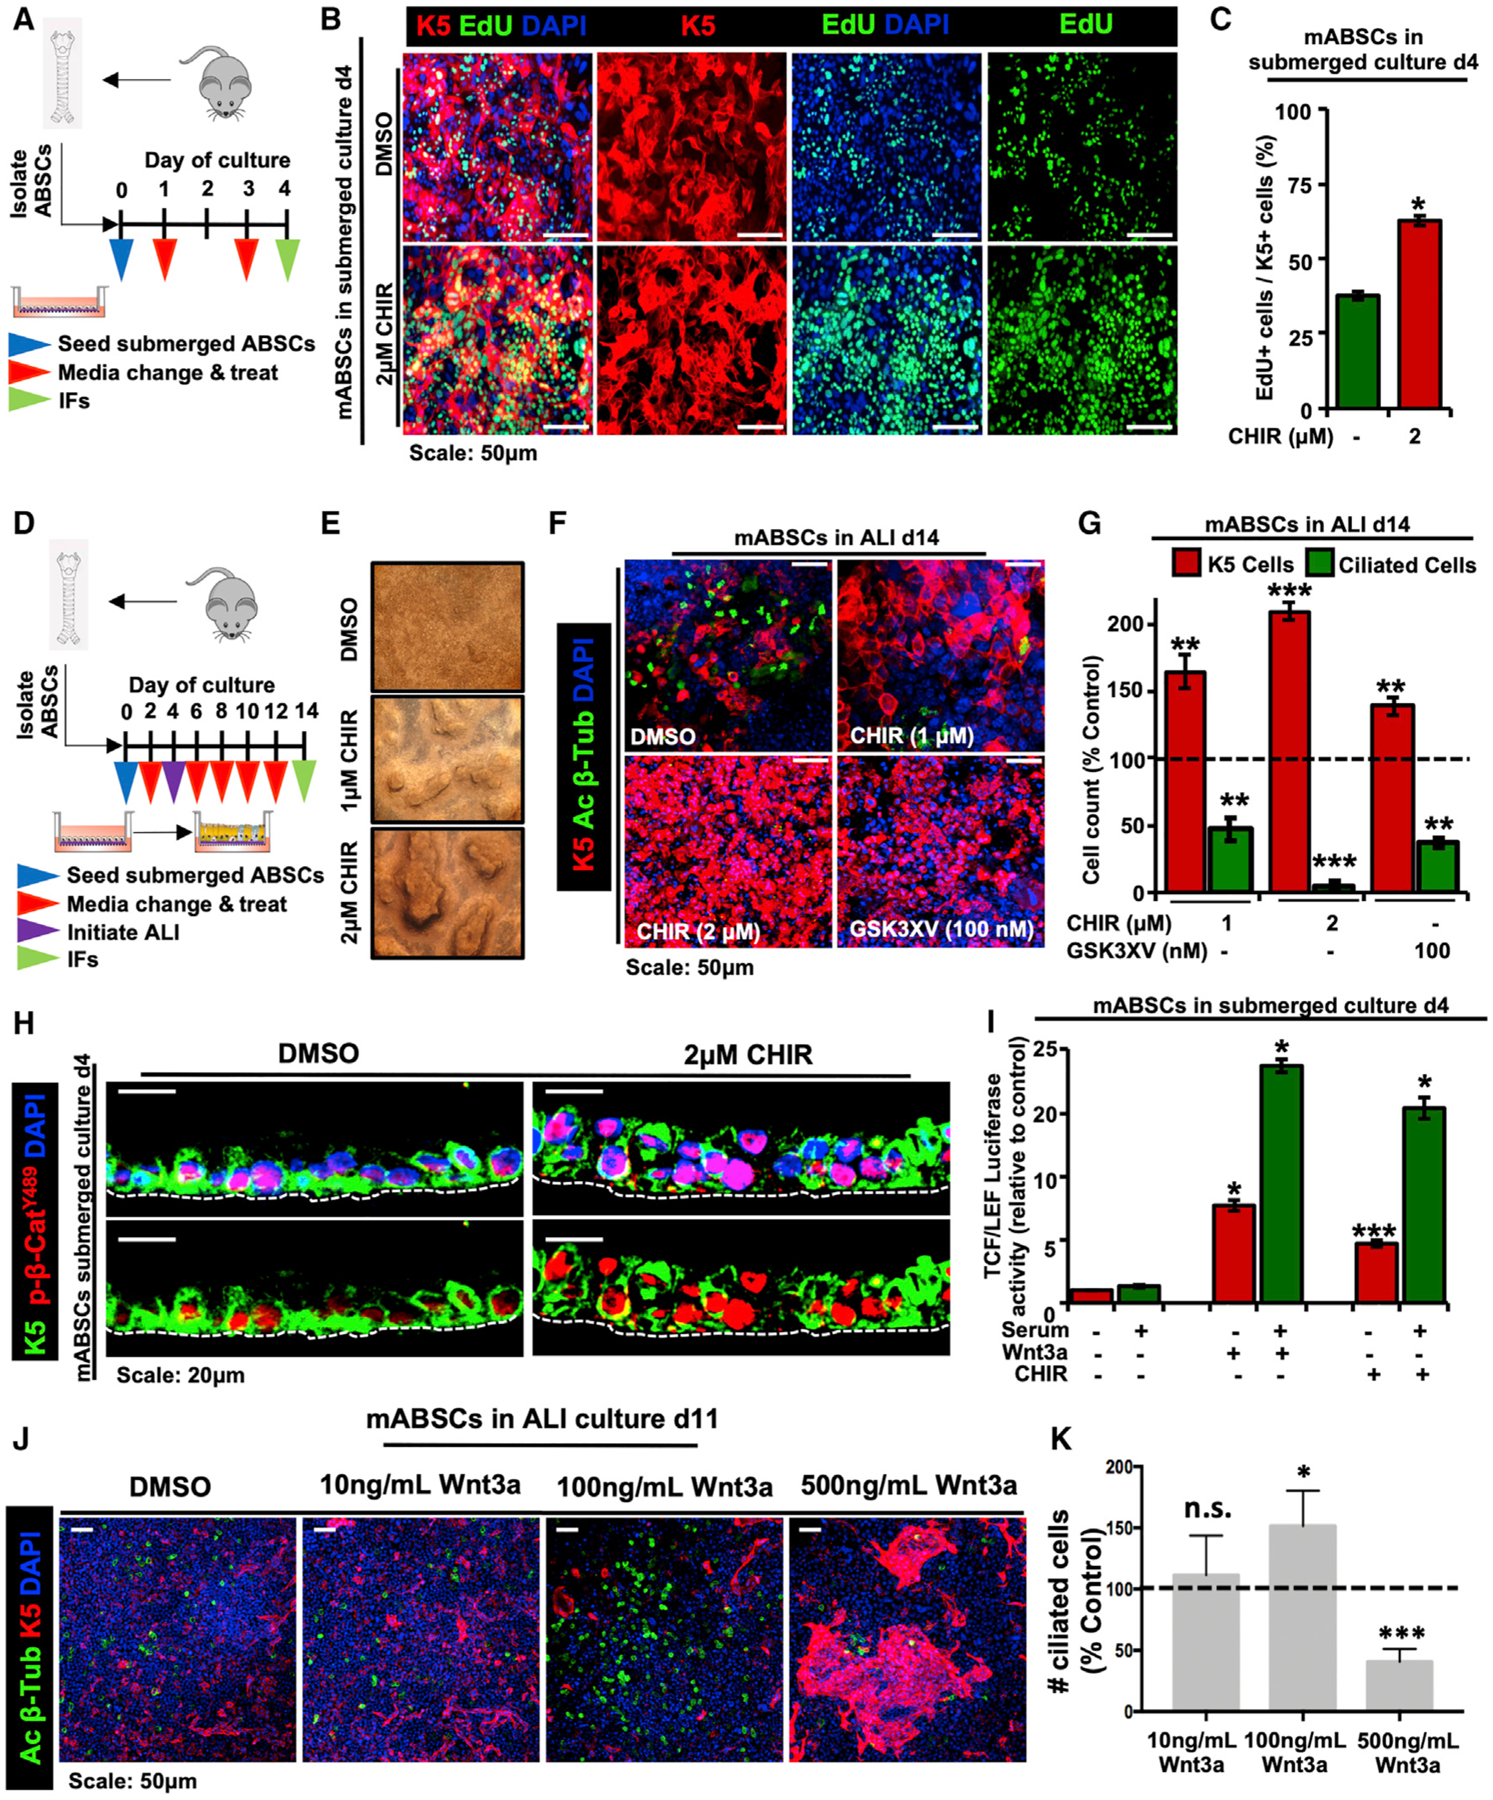
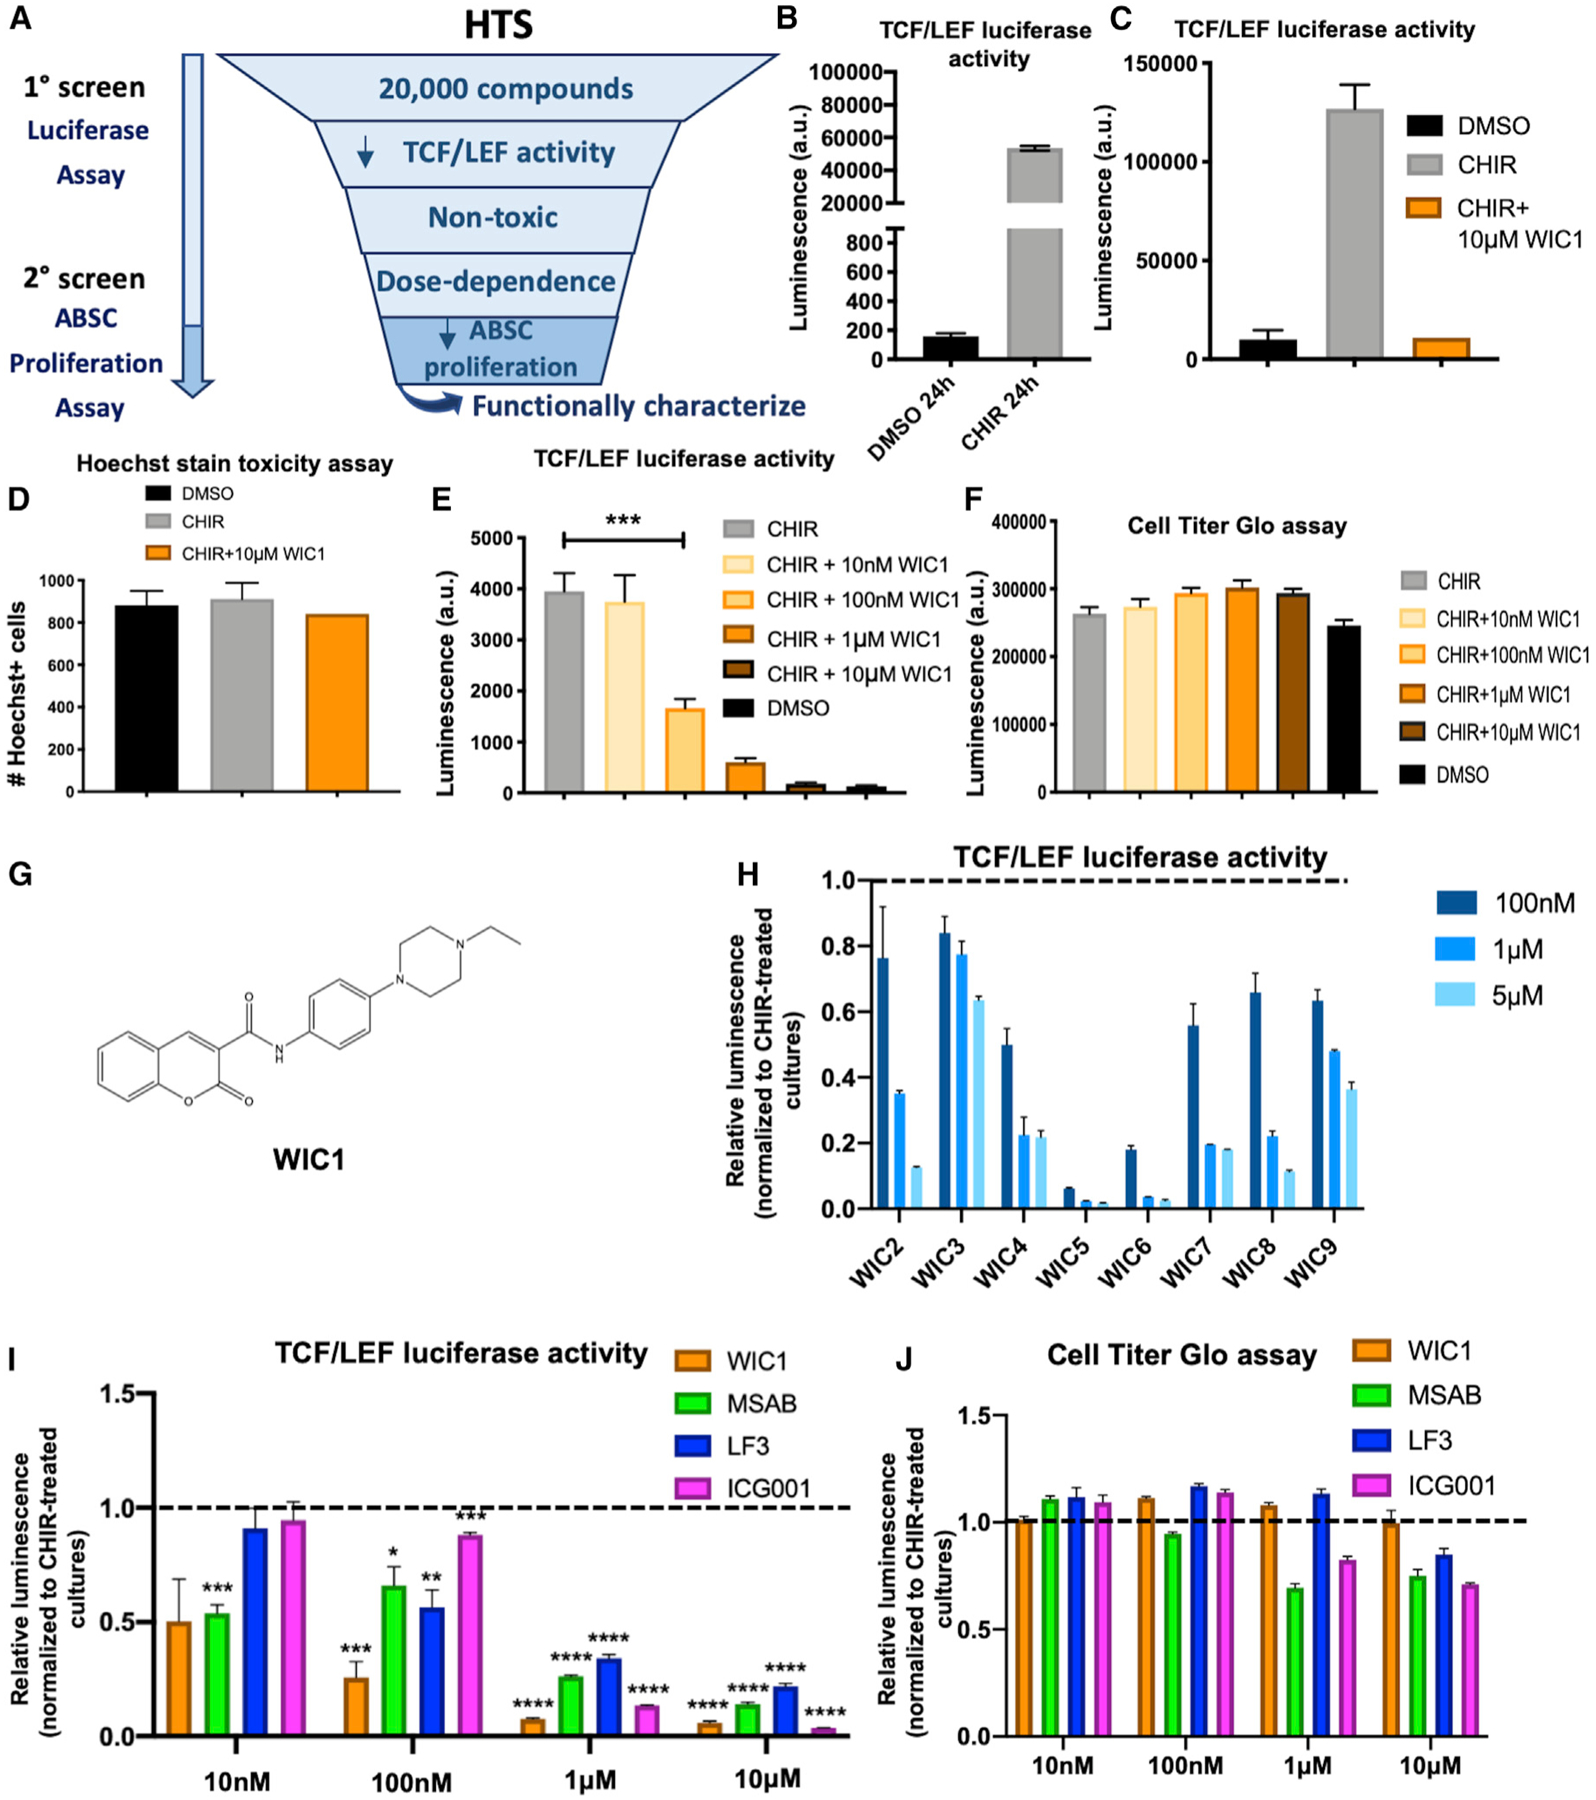
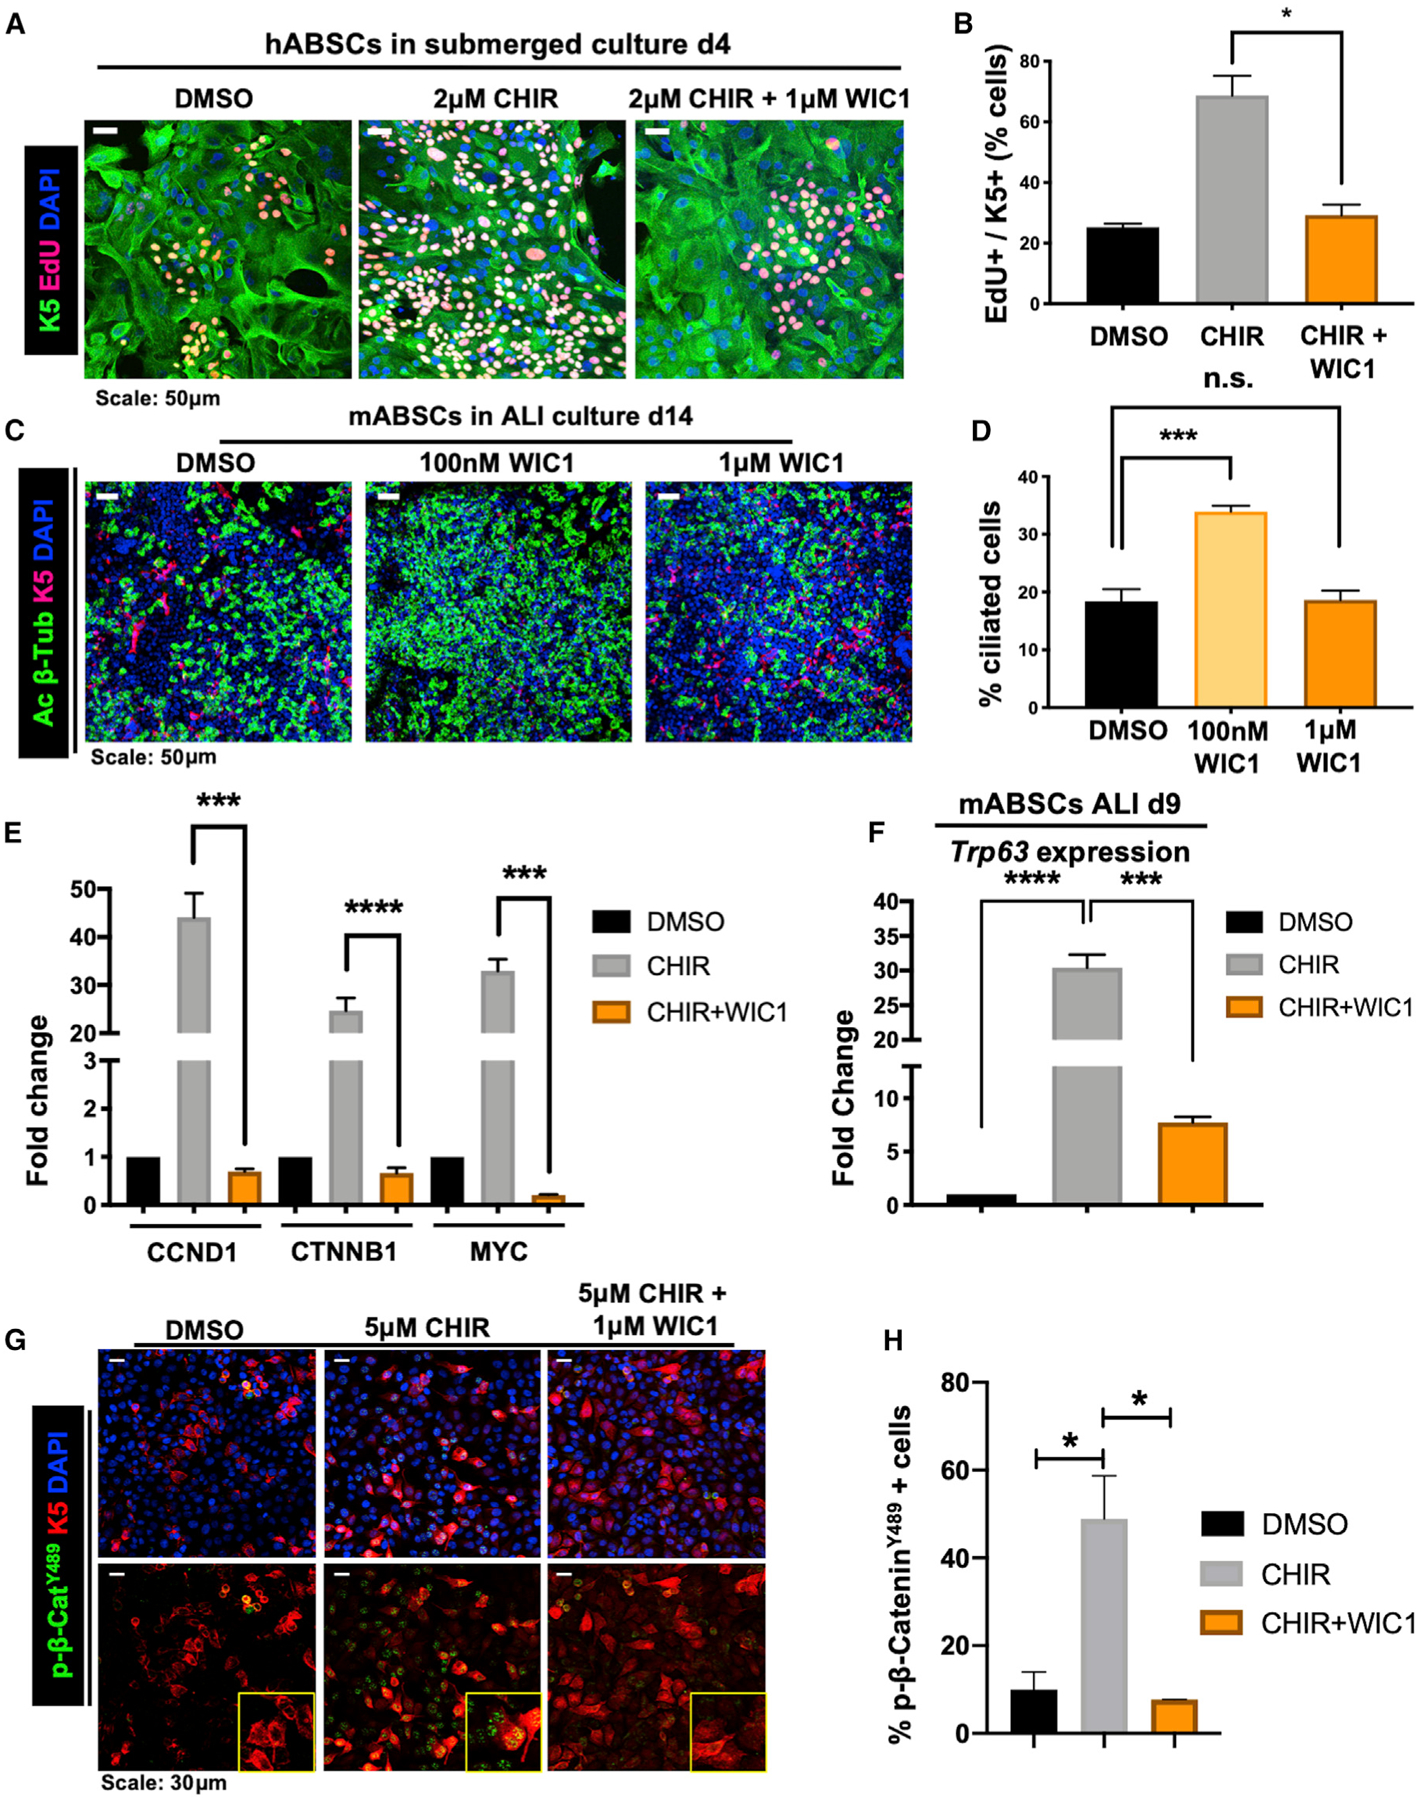
Mechanisms underpinning airway epithelial homeostatic maintenance and ways to prevent its dysregulation remain elusive. Herein, we identify that β-catenin phosphorylated at Y489 (p-β-cateninY489) emerges during human squamous lung cancer progression. This led us to develop a model of airway basal stem cell (ABSC) hyperproliferation by driving Wnt/β-catenin signaling, resulting in a morphology that resembles premalignant lesions and loss of ciliated cell differentiation. To identify small molecules that could reverse this process, we performed a high-throughput drug screen for inhibitors of Wnt/β-catenin signaling. Our studies unveil Wnt inhibitor compound 1 (WIC1), which suppresses T-cell factor/lymphoid enhancer-binding factor (TCF/LEF) activity, reduces ABSC proliferation, induces ciliated cell differentiation, and decreases nuclear p-β-cateninY489. Collectively, our work elucidates a dysregulated Wnt/p-β-cateninY489 axis in lung premalignancy that can be modeled in vitro and identifies a Wnt/β-catenin inhibitor that promotes airway homeostasis. WIC1 may therefore serve as a tool compound in regenerative medicine studies with implications for restoring normal airway homeostasis after injury.

Keywords: Wnt; airway stem cell; beta-catenin; drug screen; homeostasis; lung; premalignancy.


Conflict of interest statement

Declaration of Interests A patent has been filed on the contents of this manuscript.

Figures

Figure 1.
Figure 1.. Emergence of Dysregulated Wnt/p-β-CateninY489 Signaling Axis in Stepwise Progression to Human SqLC
(A) IF images of p-β-cateninY489 in human normal (NL) airway epithelium, premalignant lesions (PMLs), and squamous lung cancer (SqLC) patient samples. (B) Quantification of percentage of human NL, PML, and SqLC samples with positive epithelial p-β-cateninY489 expression. Three fields were quantified per patient. (C) Quantification of percentage of ABSCs with nuclear p-β-cateninY489 expression during stepwise progression to SqLC. Three fields were quantified per patient. (D) IF images of Porcupine in human normal airway epithelium, PMLs, and SqLC patient samples. (E) Quantification of percentage of human NL, PML, and SqLC samples with positive epithelial Porcupine expression. Three fields were quantified per patient. (F) Quantification of percentage of ABSCs with Porcupine expression during progression to SqLC. Three fields were quantified per patient. (G) Quantification of percentage of human NL, PML, and SqLC samples with positive Porcupine expression in the stromal compartment. Three fields were quantified per patient. (H) Quantification of percentage of stromal cells with Porcupine expression during progression to SqLC. Three fields were quantified per patient. *p < 0.05, **p < 0.01, ***p < 0.001, and ****p < 0.0001; n.s., not significant by Student’s t test. All error bars represent mean ± SEM.
Figure 2.
Figure 2.. Dysregulated ABSC Homeostasis Is Controlled by Perturbations in Canonical Wnt Signaling In vitro
(A) Schema outlining seeding and treatment of mABSCs under submerged conditions with DMSO or CHIR. (B) IF images of mABSC proliferation in vitro under submerged conditions on day 4 treated with DMSO or CHIR using the click-iT EdU assay. (C) Quantification of proliferating K5+ EdU+ mABSCs under CHIR- versus DMSO-treated conditions in vitro. Five fields of each treatment were used for quantification. (D) Schema outlining seeding and treatment of mABSCs under submerged and ALI conditions with DMSO or CHIR. (E) Bright-field images of mABSCs under ALI conditions for 11 days treated with CHIR in vitro. (F) IF images of mABSCs under ALI culture conditions for 14 days treated in vitro with two independent GSK3β inhibitors CHIR and GSK3XV. Acetylated β-tubulin (Ac β-Tub) is a marker of ciliated cells. (G) Quantification of ABSCs and ciliated cells from mABSC cultures under ALI conditions for 14 days treated with CHIR and GSK3XV. Data are normalized DMSO-treated controls, indicated by the dotted line. Five fields of each treatment were used for quantification. (H) IF images of mABSC submerged cultures treated with CHIR for 4 days for p-β-cateninY489. (I) Bar graph depicting TCF/LEF activity of mABSCs treated with recombinant mouse Wnt3a or CHIR, measured by a luciferase reporter. (J) IF images of mABSCs under ALI conditions for 11 days treated with varying concentrations of recombinant mouse Wnt3a in vitro. (K) Quantification of ciliated cells from mABSC cultures under ALI conditions for 11 days treated with varying concentrations of Wnt3a. Data are normalized DMSO-treated controls, indicated by the dotted line. Three to six fields of each treatment were used for quantification (n = 3–6). *p < 0.05, **p < 0.01, and ***p < 0.001 by Student’s t test. All error bars represent mean ± SEM.
Figure 3.
Figure 3.. High-Throughput Drug Screening Identifies a Small-Molecule Inhibitor of Canonical Wnt Signaling
(A) High-throughput screen (HTS) schema to identify small molecule inhibitors of Wnt signaling. (B) Bar graph representing BEAS2B TCF/LEF luciferase reporter activity treated with DMSO or CHIR for 24 h used for HTS. (C) Bar graph representing BEAS2B TCF/LEF luciferase reporter activity treated with DMSO, CHIR, or CHIR + WIC1 after 24 h from HTS. (D) Bar graph representing percentage of viable, nontoxic BEASB cells measured by Hoechst staining treated with DMSO, CHIR, or CHIR + WIC1 from HTS. (E) Bar graph representing BEAS2B TCF/LEF luciferase reporter activity treated with DMSO, CHIR, or CHIR with varying concentrations of WIC1 for 24 h. (F) Bar graph representing CellTiter-Glo assay in BEAS2B cells treated with DMSO, CHIR, or CHIR with varying concentrations of WIC1. (G) Structure of WIC1. (H) Bar graph representing BEAS2B TCF/LEF luciferase reporter activity treated with CHIR and varying concentrations of WIC2–WIC9 from SAR studies. Data are normalized to CHIR-treated cultures, indicated by the dotted line. (I) Bar graph representing BEAS2B TCF/LEF luciferase reporter activity treated for 24 h with 5 μM CHIR or 5 μM CHIR plus indicated concentrations of WIC1, MSAB, LF3, or ICG001. Data are normalized to CHIR-treated cultures, indicated by the dotted line. (J) Bar graph representing the CellTiter-Glo assay in BEAS2B cells treated for 24 h with 5 μM CHIR or 5 μM CHIR plus indicated concentrations of WIC1, MSAB, LF3, or ICG001. Data are normalized to CHIR-treated cultures, indicated by the dotted line (n = 3–6). *p < 0.05, **p < 0.01, ***p < 0.001, and ****p < 0.0001 by Student’s t test. All error bars represent mean ± SEM.
Figure 4.
Figure 4.. WIC1 Inhibits Wnt-Induced ABSC Hyperproliferation, Promotes Ciliated Cell Differentiation, and Acts by Decreasing Nuclear p-β-CateninY489
(A) IF images of mABSCs in vitro under submerged conditions on day 4 treated with DMSO, CHIR, or CHIR+WIC1 using click-iT EdU assay. (B) Quantification of K5+ EdU+ mABSCs under submerged conditions on day 4 treated with DMSO, CHIR, or CHIR+WIC1. 3 fields of each treatment used for quantification. (C) IF images of mABSCs in vitro under ALI culture conditions for 14 days treated with DMSO or indicated concentrations of WIC1. (D) Quantification of percentage of ciliated cells from mABSC cultures under ALI conditions for 14 days treated with DMSO or indicated concentrations of WIC1. Four fields of each treatment were used for quantification. (E) Bar graph representing qPCR data assessing mRNA expression of CCND1, CTNNB1, and MYC in BEAS2B cells treated with DMSO, 5 μM CHIR, or 5 μM CHIR + 1 μM WIC1 for 48 h. (F) Bar graph representing qPCR data assessing mRNA expression of Trp63 in mABSCs treated with DMSO, 1 μM CHIR, or 1 μM CHIR + 1 μM WIC1 on ALI culture day 9. (G) IF images for p-β-cateninY489 from BEAS2B cells treated with DMSO, 5 μM CHIR, or 5 μM CHIR + 1 μM WIC1 for 24 h. Yellow boxes show magnified inlets of the indicated treatment. (H) Quantification of percentage of p-β-cateninY489+ BEAS2B cells treated with DMSO, 5 μM CHIR, or 5 μM CHIR + 1 μM WIC1 for 24 h. Three fields of each treatment were used for quantification (n = 3–6). *p < 0.05, **p < 0.01, ***p < 0.001, and ****p < 0.0001 by Student’s t test. All error bars represent mean ± SEM.

References

    1. Akiri G, Cherian MM, Vijayakumar S, Liu G, Bafico A, and Aaronson SA (2009). Wnt pathway aberrations including autocrine Wnt activation occur at high frequency in human non-small-cell lung carcinoma. Oncogene 28, 2163–2172. - PMC - PubMed
    1. Au NH, Gown AM, Cheang M, Huntsman D, Yorida E, Elliott WM, Flint J, English J, Gilks CB, and Grimes HL (2004). P63 expression in lung carcinoma: a tissue microarray study of 408 cases. Appl. Immunohistochem. Mol. Morphol 12, 240–247. - PubMed
    1. Caron A, Xu X, and Lin X (2012). Wnt/β-catenin signaling directly regulates Foxj1 expression and ciliogenesis in zebrafish Kupffer’s vesicle. Development 139, 514–524. - PMC - PubMed
    1. Cole BB, Smith RW, Jenkins KM, Graham BB, Reynolds PR, and Reynolds SD (2010). Tracheal Basal cells: a facultative progenitor cell pool. Am. J. Pathol 177, 362–376. - PMC - PubMed
    1. Ekins S, and Bunin BA (2013). The Collaborative Drug Discovery (CDD) database. Methods Mol. Biol 993, 139–154. - PubMed

Publication types

MeSH terms