. 2020 Feb 18;30(7):2065-2074.e4.
doi: 10.1016/j.celrep.2020.01.073.

Glioma-Derived miRNA-Containing Extracellular Vesicles Induce Angiogenesis by Reprogramming Brain Endothelial Cells

Affiliations

Glioma-Derived miRNA-Containing Extracellular Vesicles Induce Angiogenesis by Reprogramming Brain Endothelial Cells

Rocco Lucero et al. Cell Rep. .

Abstract

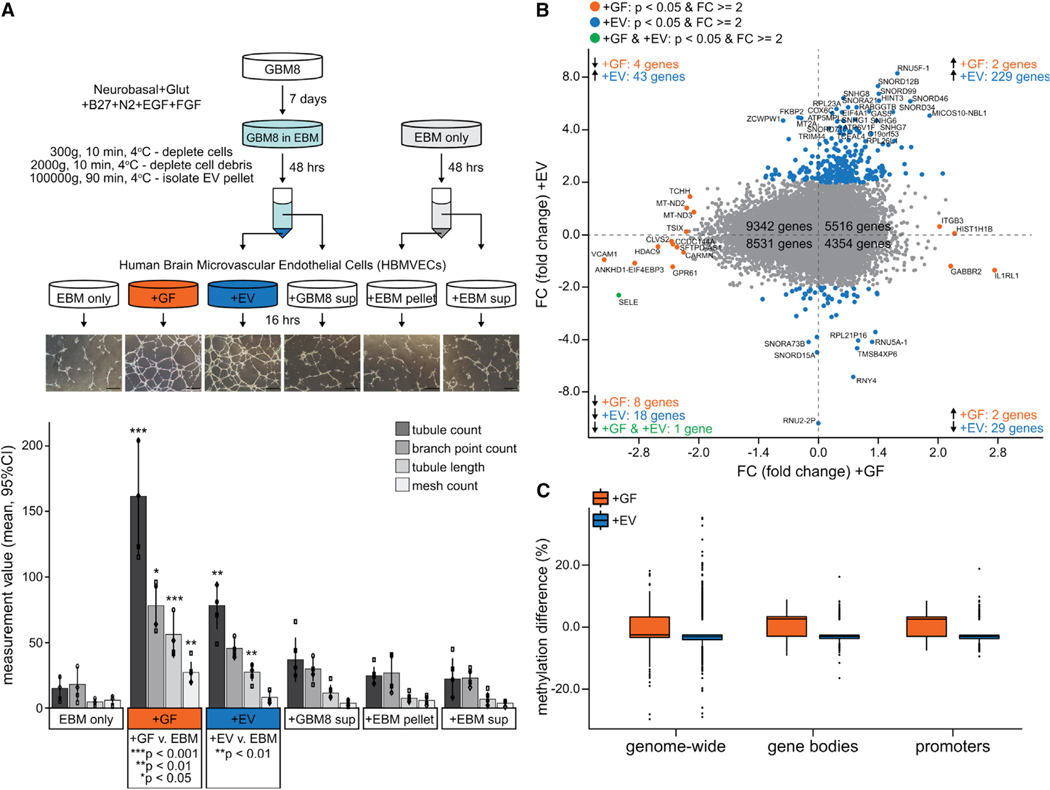
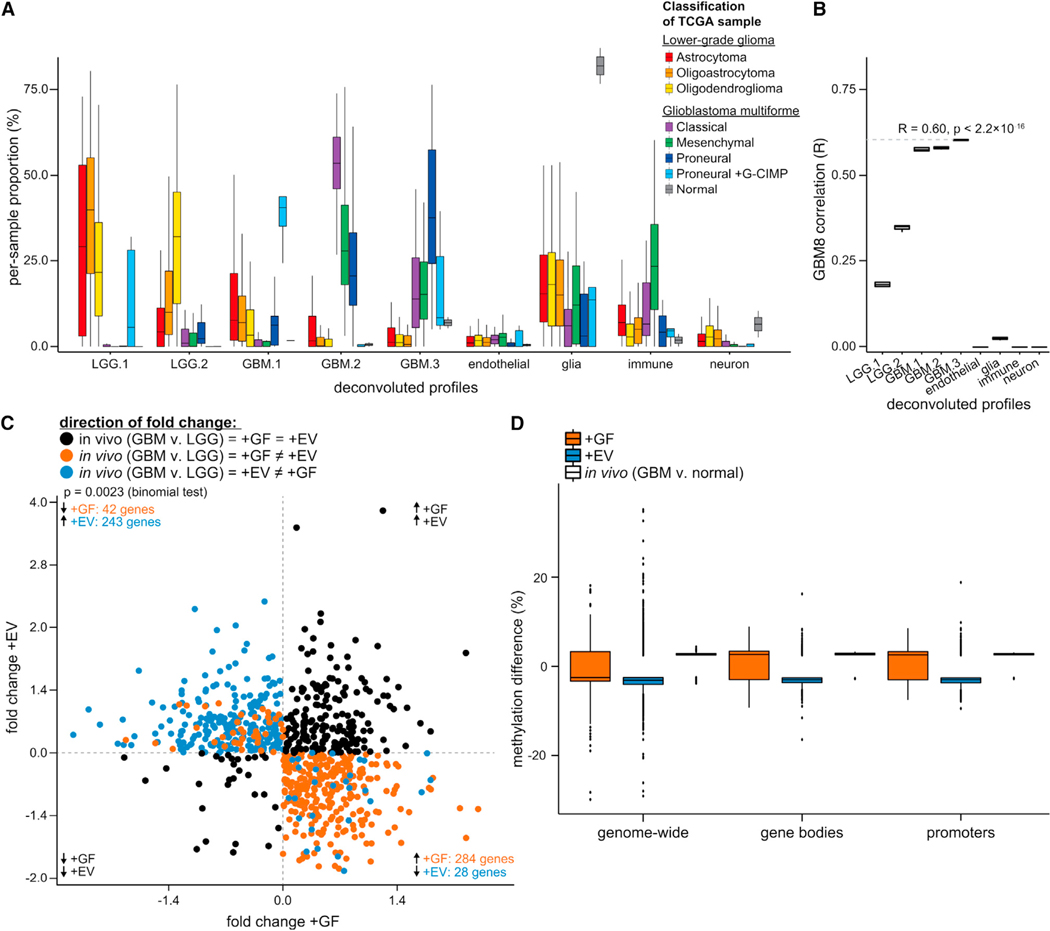
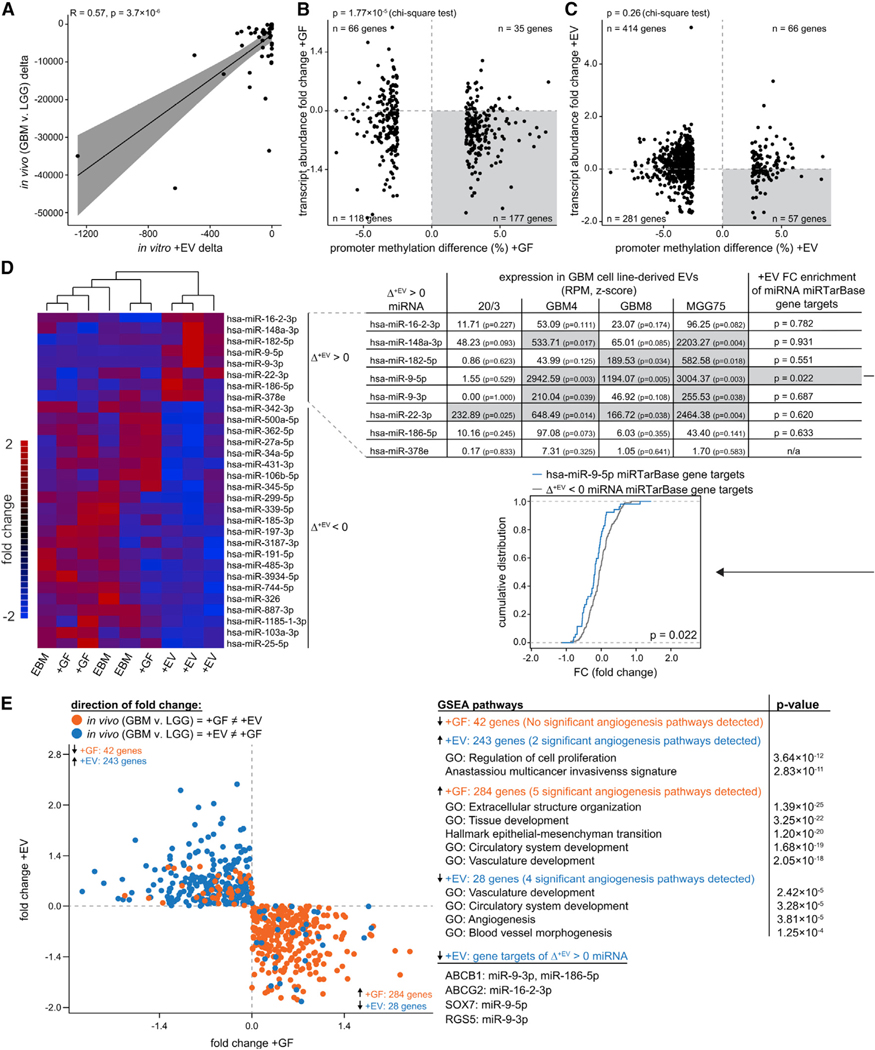
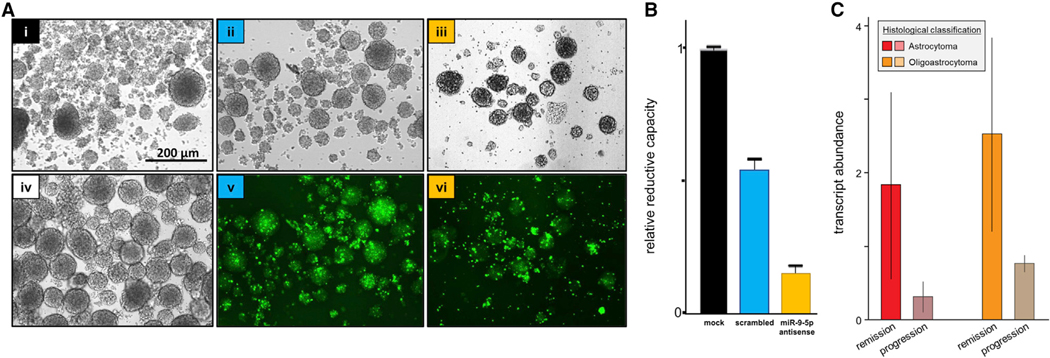
Glioblastoma (GBM) is characterized by aberrant vascularization and a complex tumor microenvironment. The failure of anti-angiogenic therapies suggests pathways of GBM neovascularization, possibly attributable to glioblastoma stem cells (GSCs) and their interplay with the tumor microenvironment. It has been established that GSC-derived extracellular vesicles (GSC-EVs) and their cargoes are proangiogenic in vitro. To further elucidate EV-mediated mechanisms of neovascularization in vitro, we perform RNA-seq and DNA methylation profiling of human brain endothelial cells exposed to GSC-EVs. To correlate these results to tumors in vivo, we perform histoepigenetic analysis of GBM molecular profiles in the TCGA collection. Remarkably, GSC-EVs and normal vascular growth factors stimulate highly distinct gene regulatory responses that converge on angiogenesis. The response to GSC-EVs shows a footprint of post-transcriptional gene silencing by EV-derived miRNAs. Our results provide insights into targetable angiogenesis pathways in GBM and miRNA candidates for liquid biopsy biomarkers.

Keywords: angiogenesis; biomarker; cancer stem cell; deconvolution; exRNA; extracellular vesicle; glioblastoma; miRNA; reprogramming; tumor microenvironment.


Conflict of interest statement

Declaration of Interests The authors declare no competing interests.

Figures

Figure 1.
Figure 1.. GFs and GSC-Derived EVs Induce Similar Vascularization Patterns but Divergent Transcriptional and Epigenomic Responses in HBMVECs
(A) Schematic and results of in vitro tube-formation assay. (i) Pellet and supernatant fractions were isolated from media conditioned by GBM8 neurospheres (EV, GBM8 sup) or unconditioned media (EBM pellet, EBM sup). (ii) HBMVECs were cultured on Matrigel for 16 h under EBM containing angiogenic GFs or 1 of the 4 media fractions, then (iii) plates were photographed and harvested for molecular profiling. (iv) Bar plot shows tube-formation assay (n = 4) metrics (mean ± 95% confidence interval [CI]). (B) Comparative transcript-level changes for +GF versus +EV (log2 fold change versus “EBM only”; n = 2) (quadrant I is top right and that quadrant numbering is counterclockwise). (C) Comparative DNA methylation changes (log2 fold change versus EBM only; n = 3).
Figure 2
Figure 2. Transcriptional and Epigenomic Perturbations Induced In Vitro by GFs or GSC-Derived EVs in ECs Largely Resemble Those within Human GBM Tumors.
Histoepigenetic analysis of GBM and LGG tumors in the TCGA collection identified constituent cell types of in vivo GBM and LGG tumors (cancer, endothelial, immune, glial, and neuronal). (A) Inferred cellular composition of GBM tumors (classical, mesenchymal, and proneural ± G-CIMP) and LGG tumors (astrocytoma, oligoastrocytoma, oligo-dendroglioma). The inferred cancer epigenomic profiles (LGG1 and −2 and GBM1, −2, and −3) are enriched in specific tumor subtypes. Non-cancer epigenomic profiles are named according to the highest correlation with normal reference profiles and expression of select marker genes. (B) Correlation of deconvoluted profiles with GBM8 GSCs is consistent with the proneural origin of GBM8 (see A, GBM.3 profile). (C) Intersection of expression changes of the EC fraction in vivo (GBM versus LGG) and in vitro (+GF or +EV versus EBM). Quadrants II and IV show genes with opposite changes in HBMVECs upon +GF and +EV treatments (color denotes treatment-specific concordance with the expression change in vivo; this panel shows a subset of genes from Figure 1B) (quadrant I is top right and that quadrant numbering is counterclockwise). (D) Side-by-side view of in vivo and in vitro DNA methylation changes (this panel includes the data from Figure 1C, augmented by in vivo changes).
Figure 3.
Figure 3.. Identification of Candidate miRNAs that May Mediate EV-Induced Vascularization
(A) The 28 genes downregulated in vitro upon +EV treatment (indicated by blue dots in E, quadrant IV) show concordant downregulation in vivo with correlated magnitudes (R = 0.57). (B and C) Transcript depletion upon +GF treatment associates with DNA methylation gain over promoters (B), whereas transcript depletion upon +EV treatment does not associate with promoter methylation (C). (D) Of the miRNAs that showed a notable increase in abundance in HBMVECs following +EV treatment (top 8 rows of heatmap, first column of table), 5 showed significantly high abundance within GSC-EVs (center columns of table, highlighted in gray). Downstream targets of miR-9 were significantly downregulated (last column of table). (E) GSEA implicates 5 angiogenic pathways enriched for the 284 genes upregulated in vivo and upon +GF treatment (quadrant IV, orange dots) and 4 angiogenic pathways enriched for the 28 genes downregulated in vivo and upon EV treatment (quadrant IV, blue dots) (quadrant I is top right and that quadrant numbering is counterclockwise).
Figure 4.
Figure 4.. miR-9–5p Supports the Metabolic Activity of GBM Stem Cells and May Influence Resistance to Therapeutic Intervention on Gliomas
(A) GBM8 neurosphere cultures: transfected with 50 nM lipofectamine plus no oligonucleotide (i, mock); FAM-labeled scrambled oligonucleotide (ii, v, scrambled); or FAM-labeled antagomir (iii, vi, miR-9–5p antisense); non-transfected GBM8 (iv). Micrographs taken 12 days after transfection (seeding at1 × 104 cells/ well). Scale bar, 200 μm. (B) Metabolic activity (mean ± SD) of transfected cells measured by WST-1reduction assay. (C) miR-9–5p levels (mean ± SD) in the cancer cell fraction of LGG tumors (astrocytomas or oligoastrocytomas), stratified by response to therapeutic intervention.

References

    1. Ameratunga M, Pavlakis N, Wheeler H, Grant R, Simes J, and Khasraw M. (2018). Anti-angiogenic therapy for high-grade glioma. Cochrane Database Syst. Rev 11, CD008218. - PMC - PubMed
    1. Aslan C, Maralbashi S, Salari F, Kahroba H, Sigaroodi F, Kazemi T, and Kharaziha P. (2019). Tumor-derived exosomes: implication in angiogenesis and antiangiogenesis cancer therapy. J. Cell. Physiol 234, 16885–16903. - PubMed
    1. Assenov Y, Müller F, Lutsik P, Walter J, Lengauer T, and Bock C. (2014). Comprehensive analysis of DNA methylation data with RnBeads. Nat. Methods 11, 1138–1140. - PMC - PubMed
    1. Bergers G, and Benjamin LE (2003). Tumorigenesis and the angiogenic switch. Nat. Rev. Cancer 3, 401–410. - PubMed
    1. Beyer S, Fleming J, Meng W, Singh R, Haque SJ, and Chakravarti A. (2017). The Role of miRNAs in angiogenesis, invasion and metabolism and their therapeutic implications in gliomas. Cancers (Basel) 9, 85. - PMC - PubMed

Publication types