. 2020 Feb 18;30(7):2195-2208.e5.
doi: 10.1016/j.celrep.2020.01.075.

STAT Signaling Modifies Ascl1 Chromatin Binding and Limits Neural Regeneration from Muller Glia in Adult Mouse Retina

Affiliations

STAT Signaling Modifies Ascl1 Chromatin Binding and Limits Neural Regeneration from Muller Glia in Adult Mouse Retina

Nikolas L Jorstad et al. Cell Rep. .

Abstract

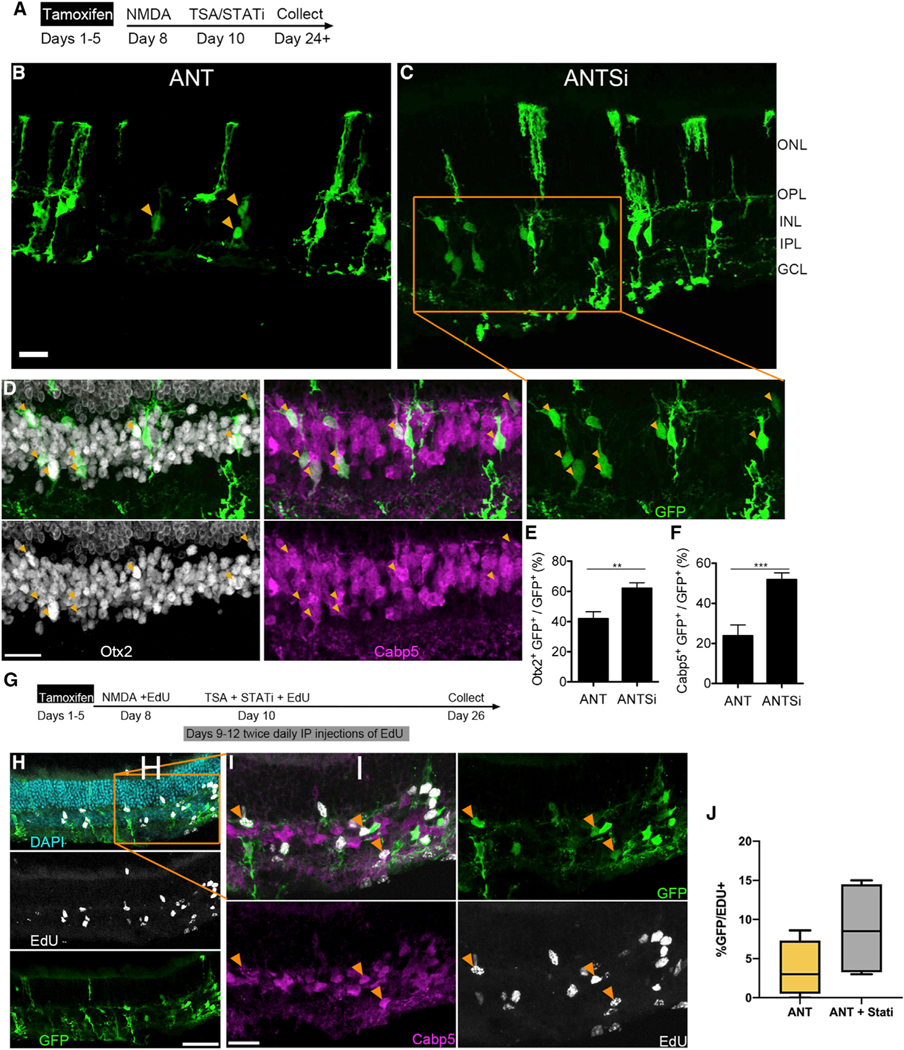
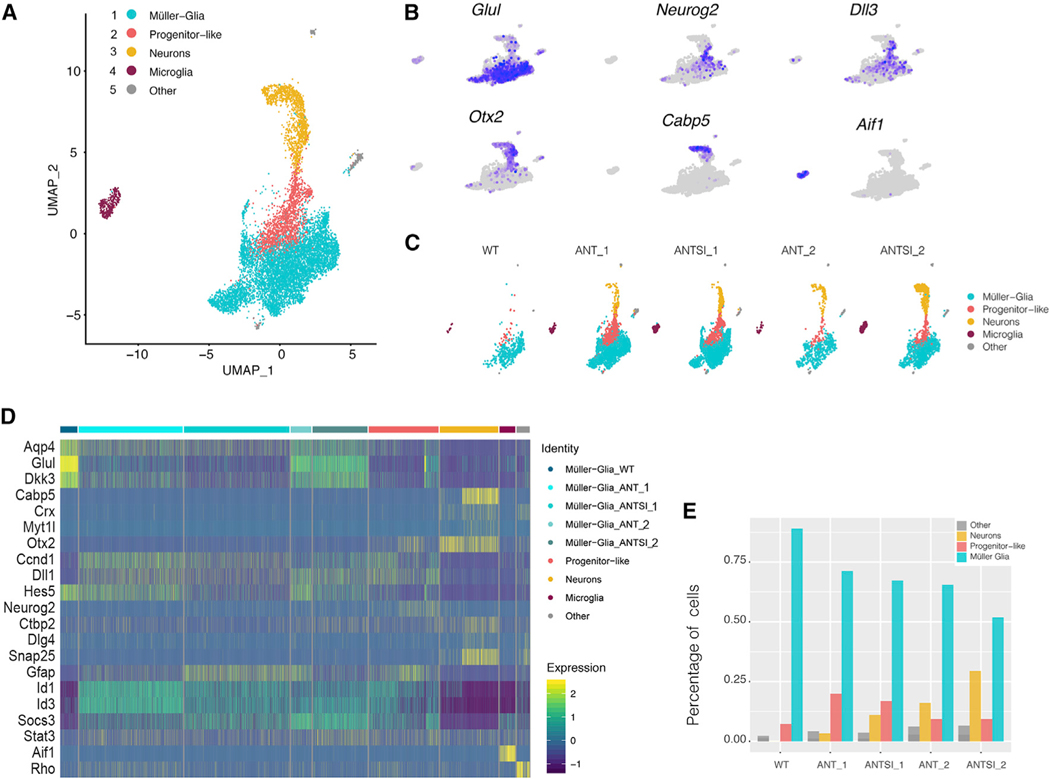
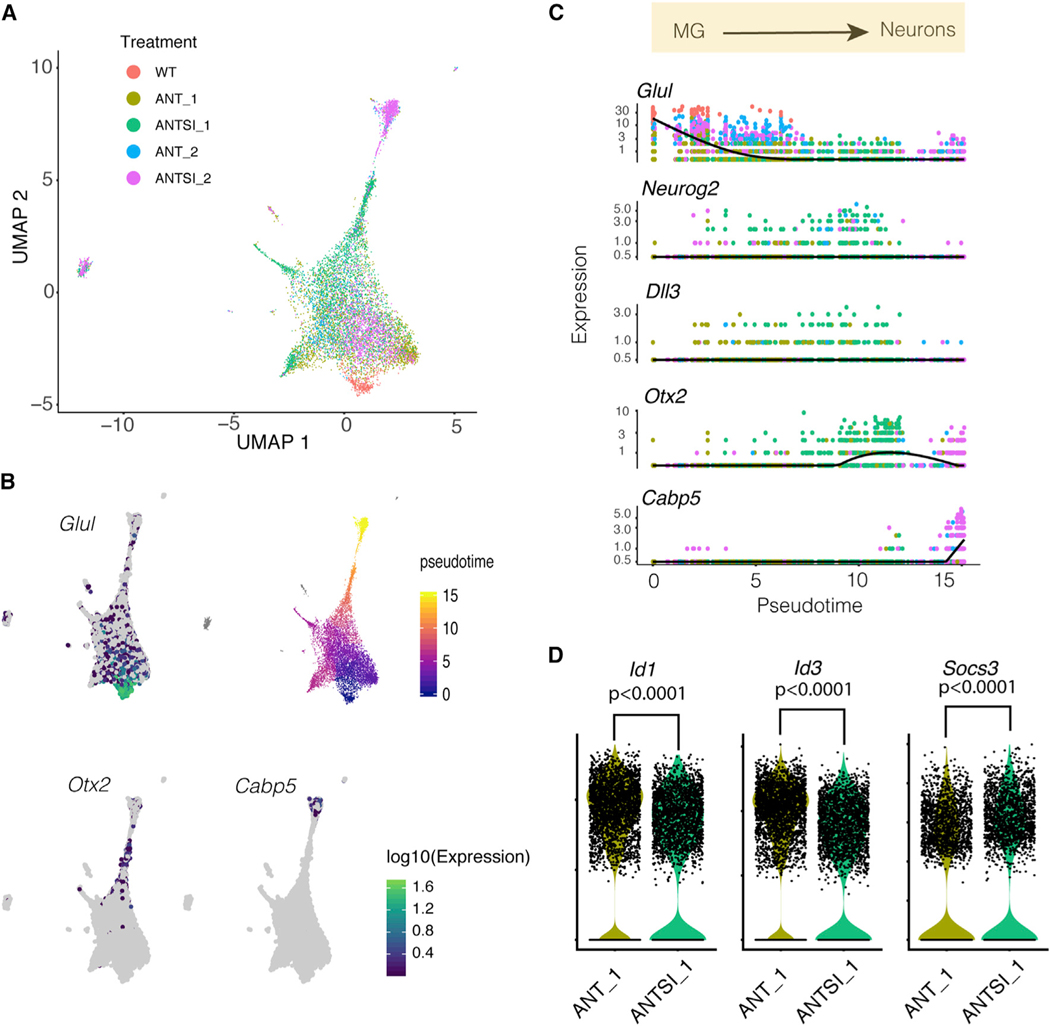
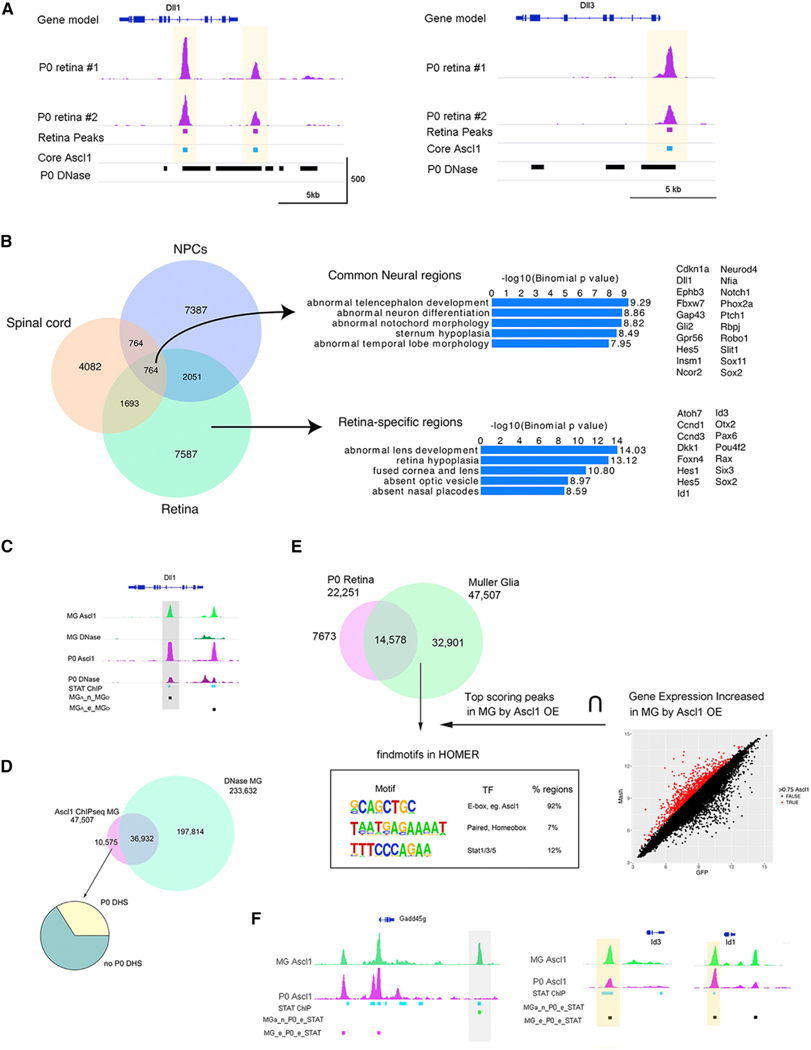
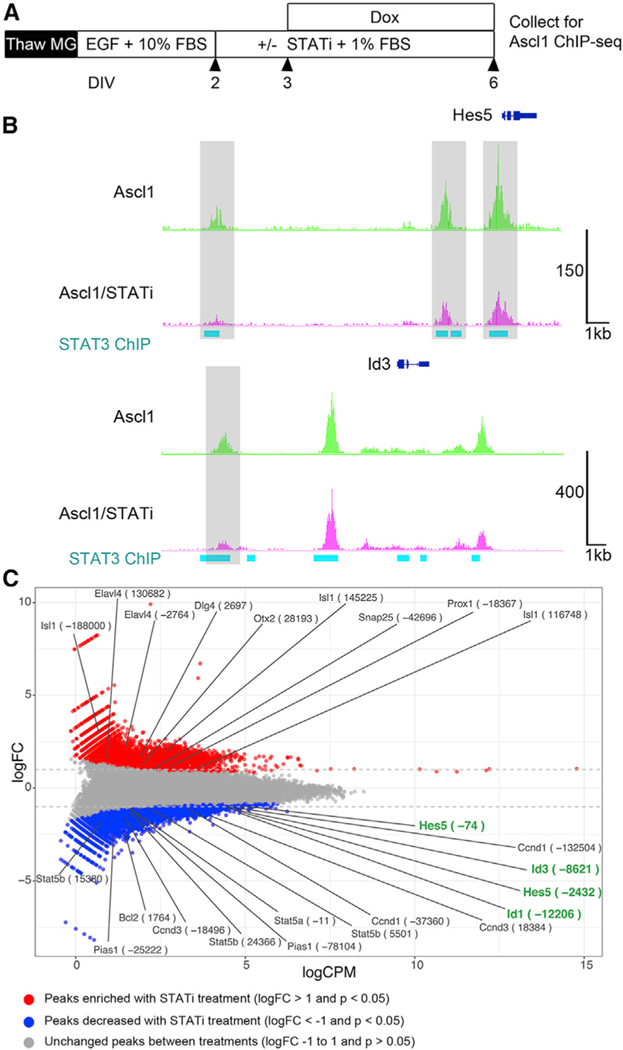
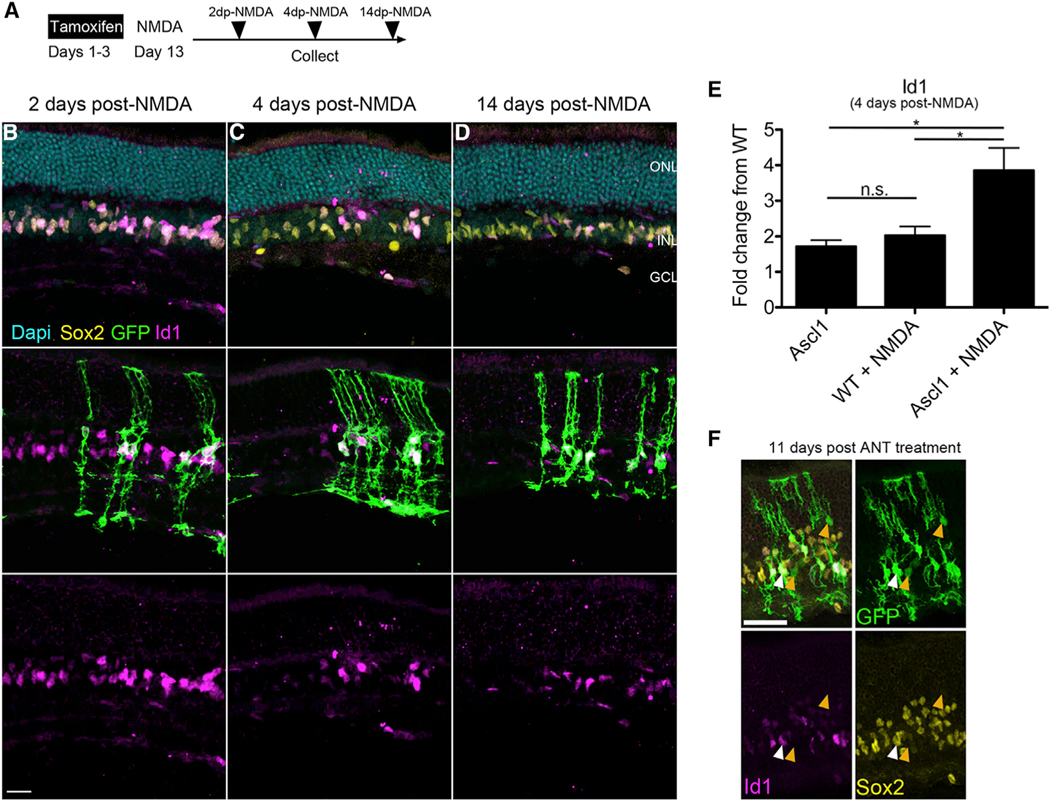
Müller glia (MG) serve as sources for retinal regeneration in non-mammalian vertebrates. We find that this process can be induced in mouse MG, after injury, by transgenic expression of the proneural transcription factor Ascl1 and the HDAC inhibitor TSA. However, new neurons are generated only from a subset of MG. Identifying factors that limit Ascl1-mediated MG reprogramming could make this process more efficient. In this study, we test whether injury-induced STAT activation hampers the ability of Ascl1 to reprogram MG into retinal neurons. Single-cell RNA-seq shows that progenitor-like cells derived from Ascl1-expressing MG have a higher level of STAT signaling than do those cells that become neurons. Ascl1-ChIPseq and ATAC-seq show that STAT potentially directs Ascl1 to developmentally inappropriate targets. Using a STAT inhibitor, in combination with our previously described reprogramming paradigm, we found a large increase in the ability of MG to generate neurons.

Keywords: Ascl1; ChIP-seq; Id3; glia; neurogenesis; proneural; reprogramming.


Conflict of interest statement

Declaration of Interests A patent including some of the findings in this report has been filed for by the University of Washington with inventors Nik Jorstad, Stefanie Wohl, and Thomas A. Reh. The patent is titled “Methods and compositions to stimulate retinal regeneration.”

Figures

Figure 1.
Figure 1.. STAT Pathway Inhibition Increases the Number of Müller Glial-Derived Neurons
(A) Experimental paradigm for increasing Müller Glial (MG)-derived regeneration efficiency. Tamoxifen is administered for up to 5 consecutive days, followed by NMDA damage a few days after tamoxifen, followed by administration of TSA and/or STAT inhibition a couple days after damage. Retinas were collected a minimum of 2 weeks after TSA/STATi. (B) Representative image showing ANT-treated adult retina with MG-derived neurons. (C) Representative image showing ANTSi-treated adult retina with increased number of MG-derived neurons. Scale bars for (B) and (C), 20 μm. ONL, outer nuclear layer; OPL, outer plexiform layer; INL, inner nuclear layer; IPL, inner plexiform layer; GCL, ganglion cell layer. (D) Shows enlargement of ANTSi-treated retinas from (C). Orange arrows indicate Cabp5+ Otx2+ GFP+ cells. All images are flattened z stacks. (E) Quantification of Otx2 in ANT (n = 16) and ANTSi-treated (n = 13) retinas. (F) Quantification of Cabp5 in ANT-treated (n = 6) and ANTSi-treated (n = 8) retinas. ANT versus ANTSi treatments in (E) and (F) were significantly different by unpaired t test at **p = 0.0023 and ***p = 0.0006, respectively. (G) Experimental paradigm for testing where ANTSi-treated MG proliferate prior to neurogenesis. (H) Representative image from proliferation experiment showing EdU and GFP colocalization. (I) Enlargement of (H) highlighting GFP+ EdU+ Cabp5+ MG-derived neurons (orange arrows). Scale bars for (H) and (I), 50 and 20 μm, respectively. (J) Quantification of Edu+ GFP+ cells. Box plot illustrates mean, upper quartile, and lower quartile.
Figure 2.
Figure 2.. ANTSi-Treated Müller Glial-Derived Neurons Integrate into Existing Retinal Circuits
(A and B) Low (A) and high (B) magnification views of example images of Müller Glial (MG)-derived neuron (green) contacting cone photoreceptors (magenta) in the OPL; scale bars, 10 and 5 μm, respectively. (c) Enlargement of (B) showing 0.18 μm z stack steps of the MG-derived neurons making contact with cone pedicle; scale bar, 2 μm. (D) Example image of MG-derived neuron with neuronal process in OPL and IPL; scale bar, 20 μm. (E) Enlargement of yellow arrow from (D) showing a Psd95+ Ctbp2+ photoreceptor synapse onto an apical MG-derived neuronal process in ONL. Left image sets show XY projection, and right image sets show YZ projection; scale bar, 2 μm. (F) Enlargement of yellow arrow from (D) showing Ctbp2 staining within the MG-derived neuronal processes in IPL. Upper right image shows stringent GFP mask used to identify Ctbp2 puncta within MG-derived neurons; scale bar, 5 μm. (G) Enlargement of yellow arrowhead from (F) showing Ctbp2 within masked GFP process, directly opposed to Psd95 staining, consistent with synaptic specializations. Upper image sets show XY projection, and lower image sets show XZ projection; scale bar, 0.5 μm. (H) Population data for input resistance and visual responses recorded with the current-clamp technique. (I) Population data for input resistance and resting membrane potential measurements. In (H) and (I), solid colored circles indicate new measurements recorded from ANTSi treatment condition, and hollow colored circles indicate measurements from ANT treatment condition from a previous study (Jorstad et al., 2017). Green traces in (H) show maximum evoked light response from 500 ms luminance stimulation for MG (left) and MG-derived neuron (right). Green traces in (I) show representative responses to equal increasing steps of injected current for MG (left) and MG-derived neuron (right). ANTSi-treated recordings were performed at 2, 5, and 7 weeks post-TSA and STATi administration.
Figure 3.
Figure 3.. ANTSi Treatment Results in More Müller Glial-Derived Neurons by scRNA-Seq
(A) A UMAP plot of FACS-purified WT Müller Glia (MG) and ANT-treated (and ANTSi-treated) MG. Five clusters were identified in the combined data. (B) Feature plots of glial (Glul), progenitor (Dll1), neuronal (Cabp5 and Otx2), rod (Rho), and microglial (Aif1) gene expression to identify clusters by cell type. Cells expressing each gene are labeled purple; gray cells had expression of the gene below threshold of detection. (C) UMAP plot from (A) colored by treatment condition. Note neurons (yellow) only appear in the ANT and ANTSi conditions. (D) Heatmap showing all cells from the five treatment conditions: WT FACS-purified MG (WT), ANT-treated MG 2 days (ANT_1) and 6 weeks (ANT_2) following the last intraocular injection, and ANTSi-treated MG 2 days (ANTSi_1) and 3 weeks (ANTSi_2) after the last intraocular injection, respectively. Müller Glial (MG)-derived neurons express synaptic genes (e.g., Snap25, Dlg4) and do not express Stat pathway targets (e.g., Socs3, Id1/3, Gfap). Progenitor-like cells highly express Stat pathway targets. Scale shows log2 expression. (E) Graph showing the fraction of each treatment that was composed of MG, progenitor-like cells, and MG-derived neurons. ANTSi treatment increases the proportion of MG-derived neurons and decreases the proportion of progenitor-like cells relative to ANT treatment.
Figure 4.
Figure 4.. Pseudo-Time Analysis of scRNA-Seq Datasets
(A) UMAP plot from Monocle showing clusters colored by treatment condition. (B) Gene expression for glial (Glul) and neural (Otx2, Cabp5) genes shown as feature plots on the UMAP plot from (A). The highest expression of glial genes is in the WT Müller glia (MG), and the highest level of neural genes is in the cluster where ANTSi_2 cells predominate. The pseudo-time plot shows the progression from the glial to neural state with ANTSi treatment. (C) Pseudo-time plots of gene expression for glial (Glul), progenitor (Neurog2, Dll3), and neural (Otx2, Cabp5) genes with cells colored by treatment group as in (A). (D)MGcells from ANT_1 and ANTSi_1 conditions plotted as violin plots for Id1, Id3, and Socs3 gene expression, to show significant reduction in Id1/3 expression with STAT inhibition.
Figure 5.
Figure 5.. Ascl1 ChIP-Seq from Ascl1-Overexpressing Müller Glia and P0 Retinal Progenitors
(A) Epigenetic analyses of progenitor genes Dll1 and Dll3. Tracks show biological replicate Ascl1 ChIP-seq peaks from P0 whole retina (P0 retina #1, #2), and bars indicate peaks that were called from peak-calling algorithm HOMER with FDR of 0.1% (Retina Peaks track), peaks that were called from retinal, spinal cord, and NPC Ascl1 ChIP-seq datasets (Core Ascl1 track), and DNase-seq peaks from P0 whole retina showing accessible chromatin (P0 DNase track). Yellow highlights indicate core/common binding sites. Scale at the bottom track (x axis, kilobases of genomic DNA; y axis, reads per million [RPM]). (B) Venn diagram showing proportions of overlap for Ascl1 ChIP-seq peaks between P0 retina, NPCs, and spinal cord (left). Gene Ontology analysis of retinal specific and core/common Ascl1 ChIP-seq peaks using GREAT algorithm and example genes in these categories (right). (C) Epigenetic comparison of Ascl1-overexpressing MG (MG Ascl1 and MG DNase tracks) with P0 developing retina (P0 Ascl1 and P0 DNase tracks). Additional tracks showing previously described Stat3 ChIP-seq peaks from brain oligodendrocytes (STAT ChIP) and comparative peak overlap analyses of Ascl1 peaks without DHSs (MGA_n_MGD) or with DHSs (MGA_e_MGD). (D) Top: Venn diagram showing proportions of overlap of Ascl1 ChIP-seq peaks with DNase-seq peaks from Ascl1-overexpressing MG. Bottom: pie chart showing the proportion of Ascl1 ChIP-seq peaks that have a P0 DNase peak present. (E) Venn diagram showing proportions of overlap from Ascl1 ChIP-seq peaks between P0 developing retina and Ascl1-overexpressing MG (top). Integrative analysis looking for motifs that were enriched at Ascl1-overexpressing MG-specific Ascl1 peaks (developmentally inappropriate), are located within ±5 kb of the transcription start site (TSS) and are associated with a 0.75 increase in gene expression (from a previous Ascl1-virus versus GFP-virus microarray). Top-scoring motifs meeting these criteria are presented in box (E-box 92%, paired homebox 7%, Stat1/3/5 12%) (bottom). (F) Epigenetic comparison of Gadd45 g, Id1, and Id3 gene loci in Ascl1-overexpressing MG (MG Ascl1) and P0 developing retina (P0 Ascl1). Additional tracks showing previously described Stat3 ChIP-seq peaks (STAT ChIP) and comparative peak overlap analyses of sites containing a MG Ascl1 peak, a P0 Ascl1 peak, and a Stat3 peak (MGA_e_P0_e_STAT) or sites containing a MG Ascl1 peak, a Stat3 peak, but no P0 Ascl1 peak (MGA_n_P0_e_STAT). Yellow highlights indicate strong Ascl1-binding sites during development and forced Ascl1 expression; gray highlights indicate anomalies.
Figure 6.
Figure 6.. Ascl1 ChIP-Seq from Ascl1-Overexpressing Müller Glia with or without STATi
(A) Experimental paradigm for Ascl1 ChIP-seq. (B) Representative tracks of Ascl1 ChIP-seq datasets from Ascl1 and Ascl1/STATi conditions, and STAT3 ChIP-seq data from oligodendrocytes (GEO: GSM2650746). Gray highlights show peaks that were significantly decreased in STATi-treated cells. (C) MA plot of all Ascl1 and Ascl1/STATi-treated Ascl1 ChIP-seq peaks. Red shows peaks that were significantly enriched in the STATi-treated cells with a log fold change (FC) > 1, and blue shows peaks that were significantly decreased in the STATi-treated cells with a log FC < −1.
Figure 7.
Figure 7.. Ascl1 Overexpression Results in Dysregulated STAT-Target Genes
(A) Experimental paradigm for analyzing STAT-target genes in Ascl1-overexpressing Müller glia (MG). (B) Both GFP– Sox2+ and Ascl1-expressing GFP+ MG express Id1 2 days after NMDA damage. (C) Ascl1+ cells have higher expression of Id1 relative to GFP– MG (Sox2+ cells) 4 days after NMDA damage. (D) Id1 expression is reduced in GFP– MG but remains in the Ascl1-expressing GFP+ MG14 days after NMDA damage. Note that the flat Id1+ nuclei in all images not labeled with GFP are endothelial cells. Scale bars for (B)–(D), 20 μm. (E) Graph showing qRT-PCR for Id1 gene expression relative to WT on retinas treated 4 days post-NMDA. One-way ANOVA with Tukey’s post-test: *p < 0.05, n = 4 biological replicates per condition run in triplicate. (F) Id1 expression is reduced in GFP–MG but remains in the Ascl1-expressing GFP+MG14 days after ANT treatment (white arrows).Müller glial-derived neurons (orange arrows) do not express Id1. Scale bar, 40 μm.

References

    1. Bai G, Sheng N, Xie Z, Bian W, Yokota Y, Benezra R, Kageyama R, Guillemot F, and Jing N. (2007). Id sustains Hes1 expression to inhibit precocious neurogenesis by releasing negative autoregulation of Hes1. Dev. Cell 13, 283–297. - PubMed
    1. Barnabé-Heider F, Wasylnka JA, Fernandes KJ, Porsche C, Sendtner M, Kaplan DR, and Miller FD (2005). Evidence that embryonic neurons regulate the onset of cortical gliogenesis via cardiotrophin-1. Neuron 48, 253–265. - PubMed
    1. Benezra R, Davis RL, Lockshon D, Turner DL, and Weintraub H. (1990). The protein Id: a negative regulator of helix-loop-helix DNA binding proteins. Cell 61, 49–59. - PubMed
    1. Boareto M, Iber D, and Taylor V. (2017). Differential interactions between Notch and ID factors control neurogenesis by modulating Hes factor autoregulation. Development 144, 3465–3474. - PMC - PubMed
    1. Bonni A, Sun Y, Nadal-Vicens M, Bhatt A, Frank DA, Rozovsky I, Stahl N, Yancopoulos GD, and Greenberg ME (1997). Regulation of gliogenesis in the central nervous system by the JAK-STAT signaling pathway. Science 278, 477–483. - PubMed

Publication types

Substances