. 2020 Apr;8(4):506-517.
doi: 10.1158/2326-6066.CIR-19-0690. Epub 2020 Feb 19.

Inhibition of SHP-1 Expands the Repertoire of Antitumor T Cells Available to Respond to Immune Checkpoint Blockade

Affiliations

Inhibition of SHP-1 Expands the Repertoire of Antitumor T Cells Available to Respond to Immune Checkpoint Blockade

Jeremy P Snook et al. Cancer Immunol Res. 2020 Apr.

Abstract

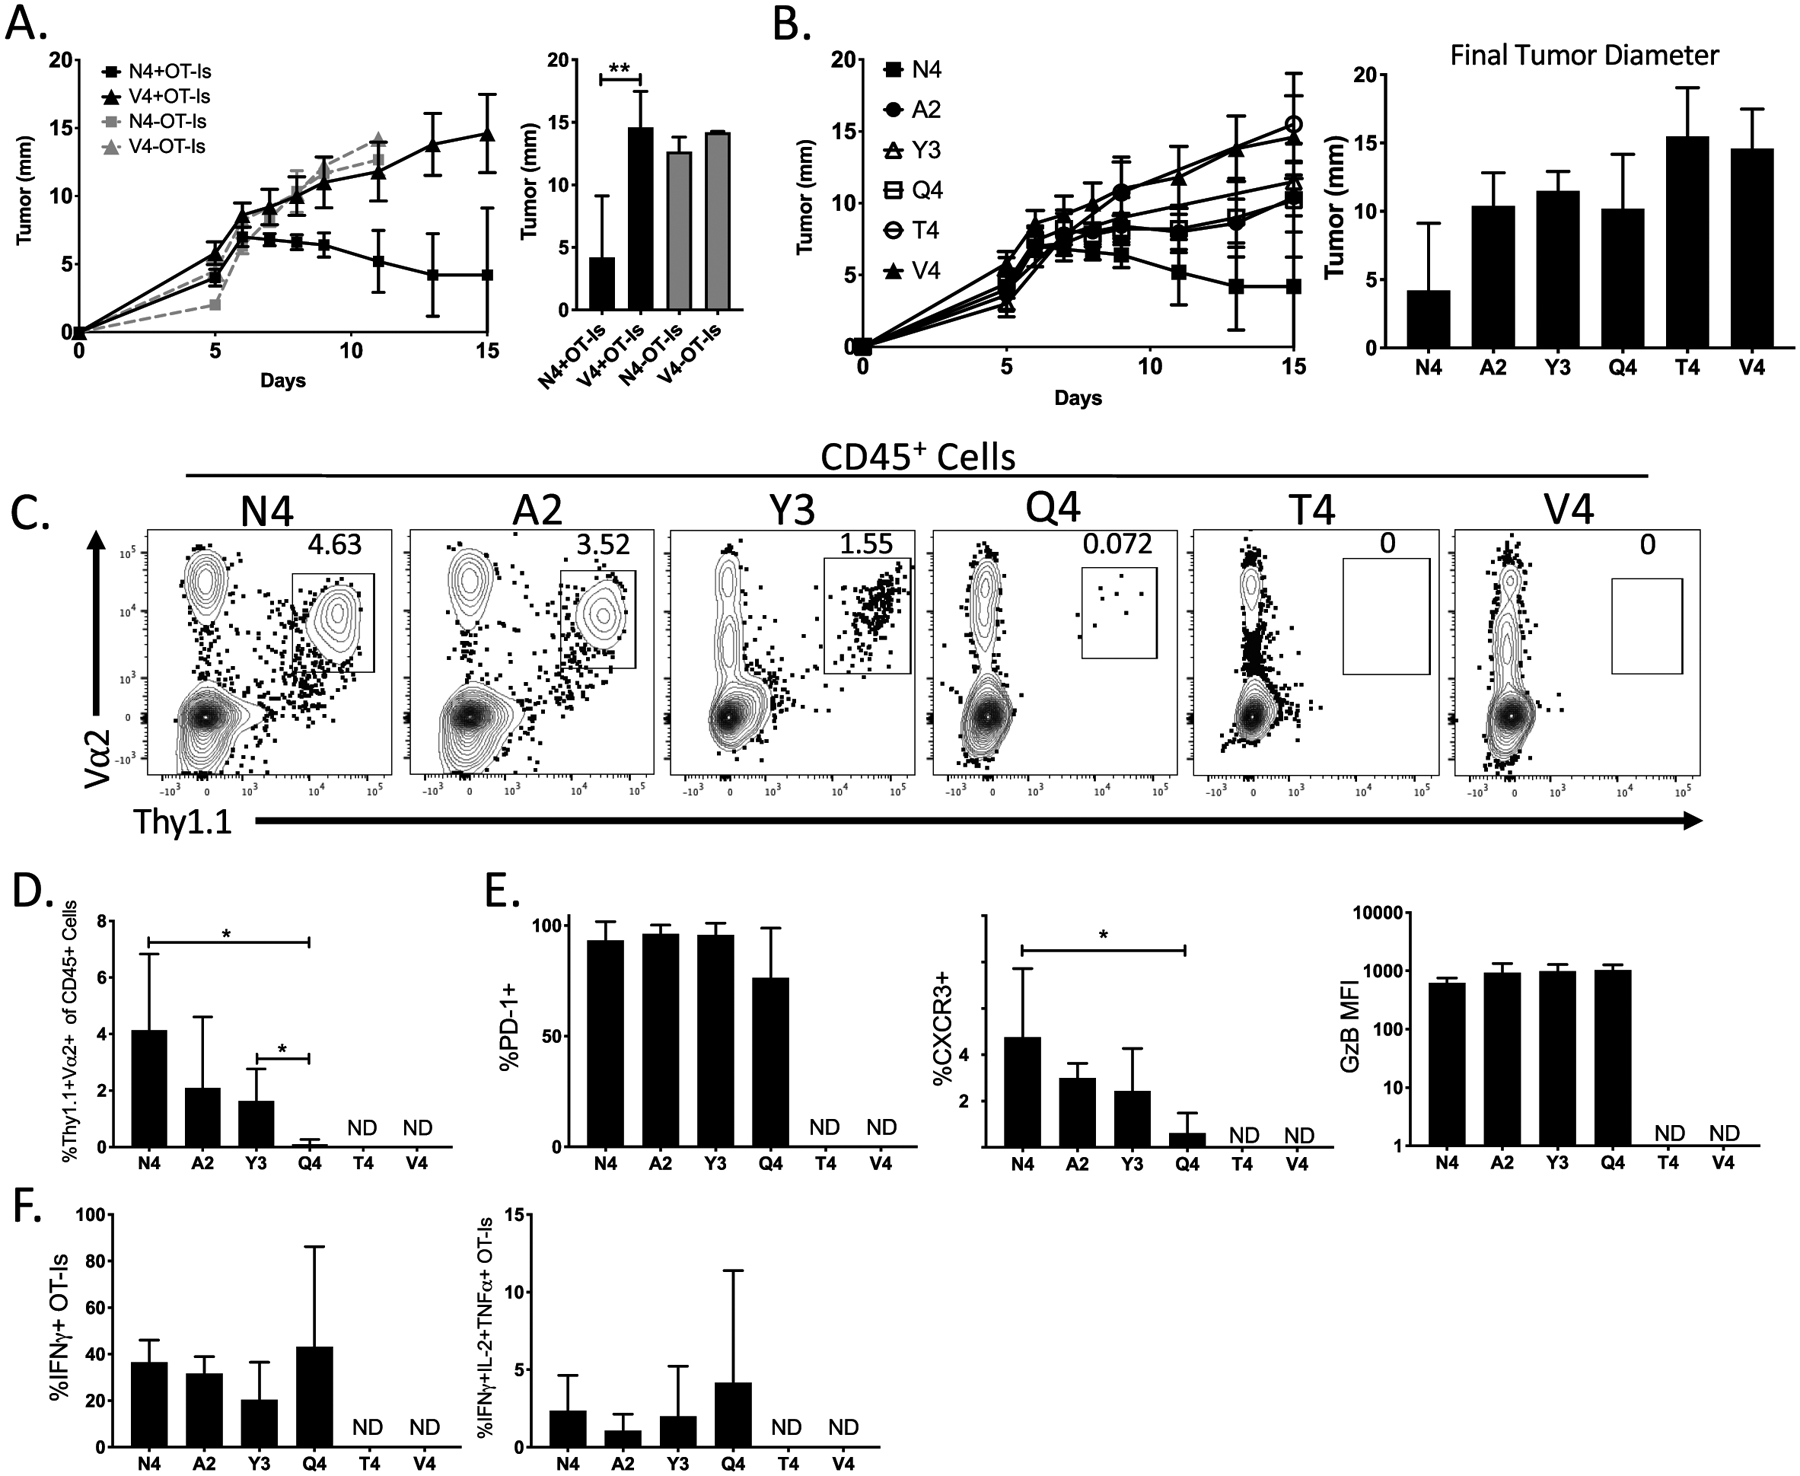
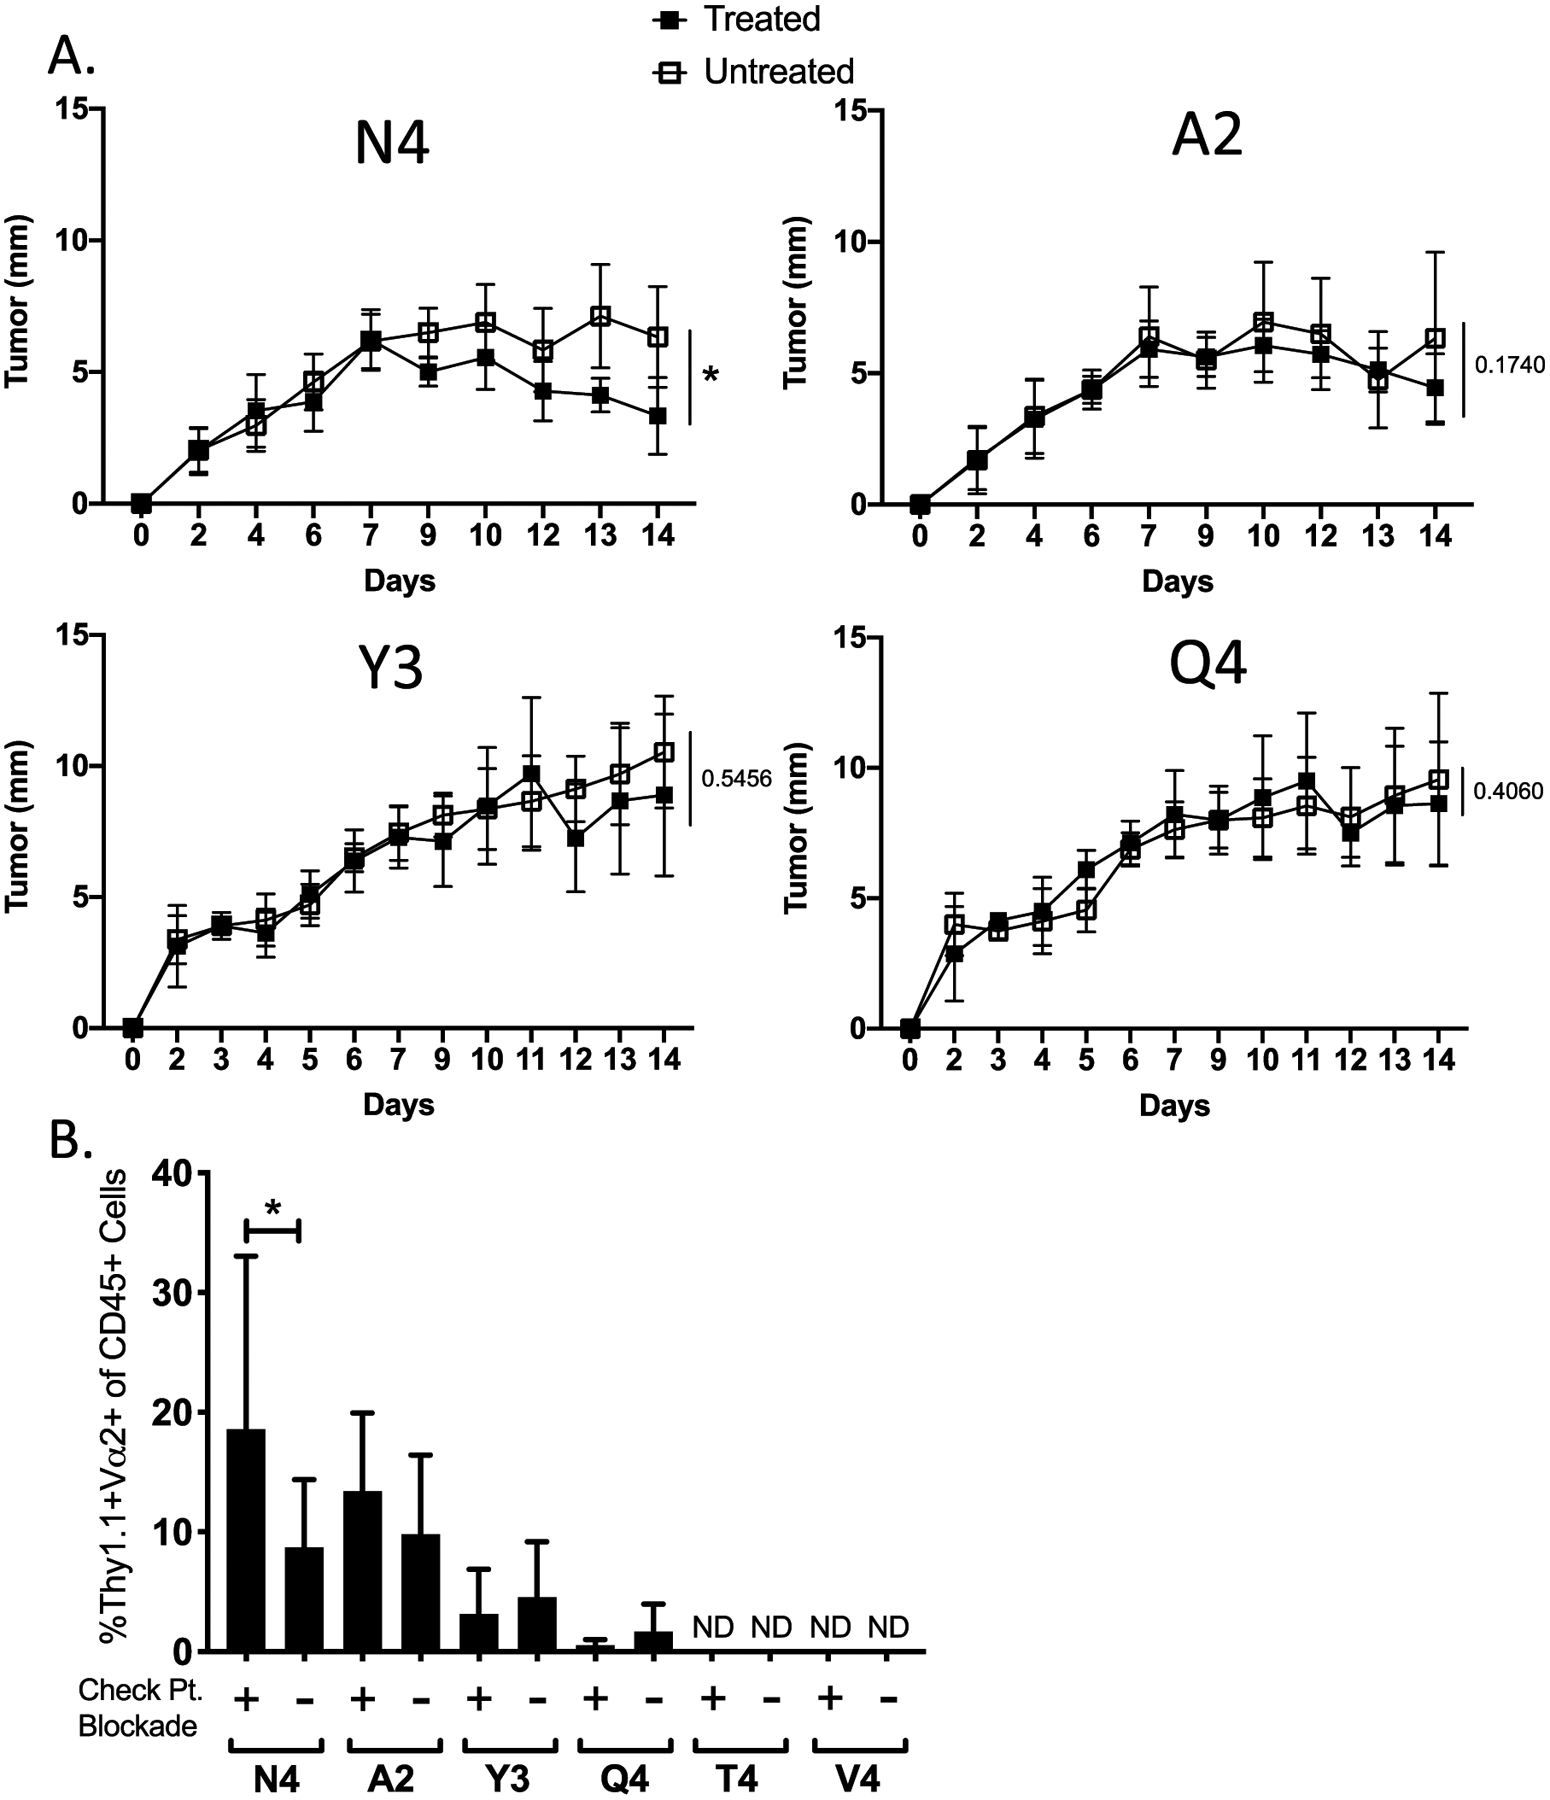
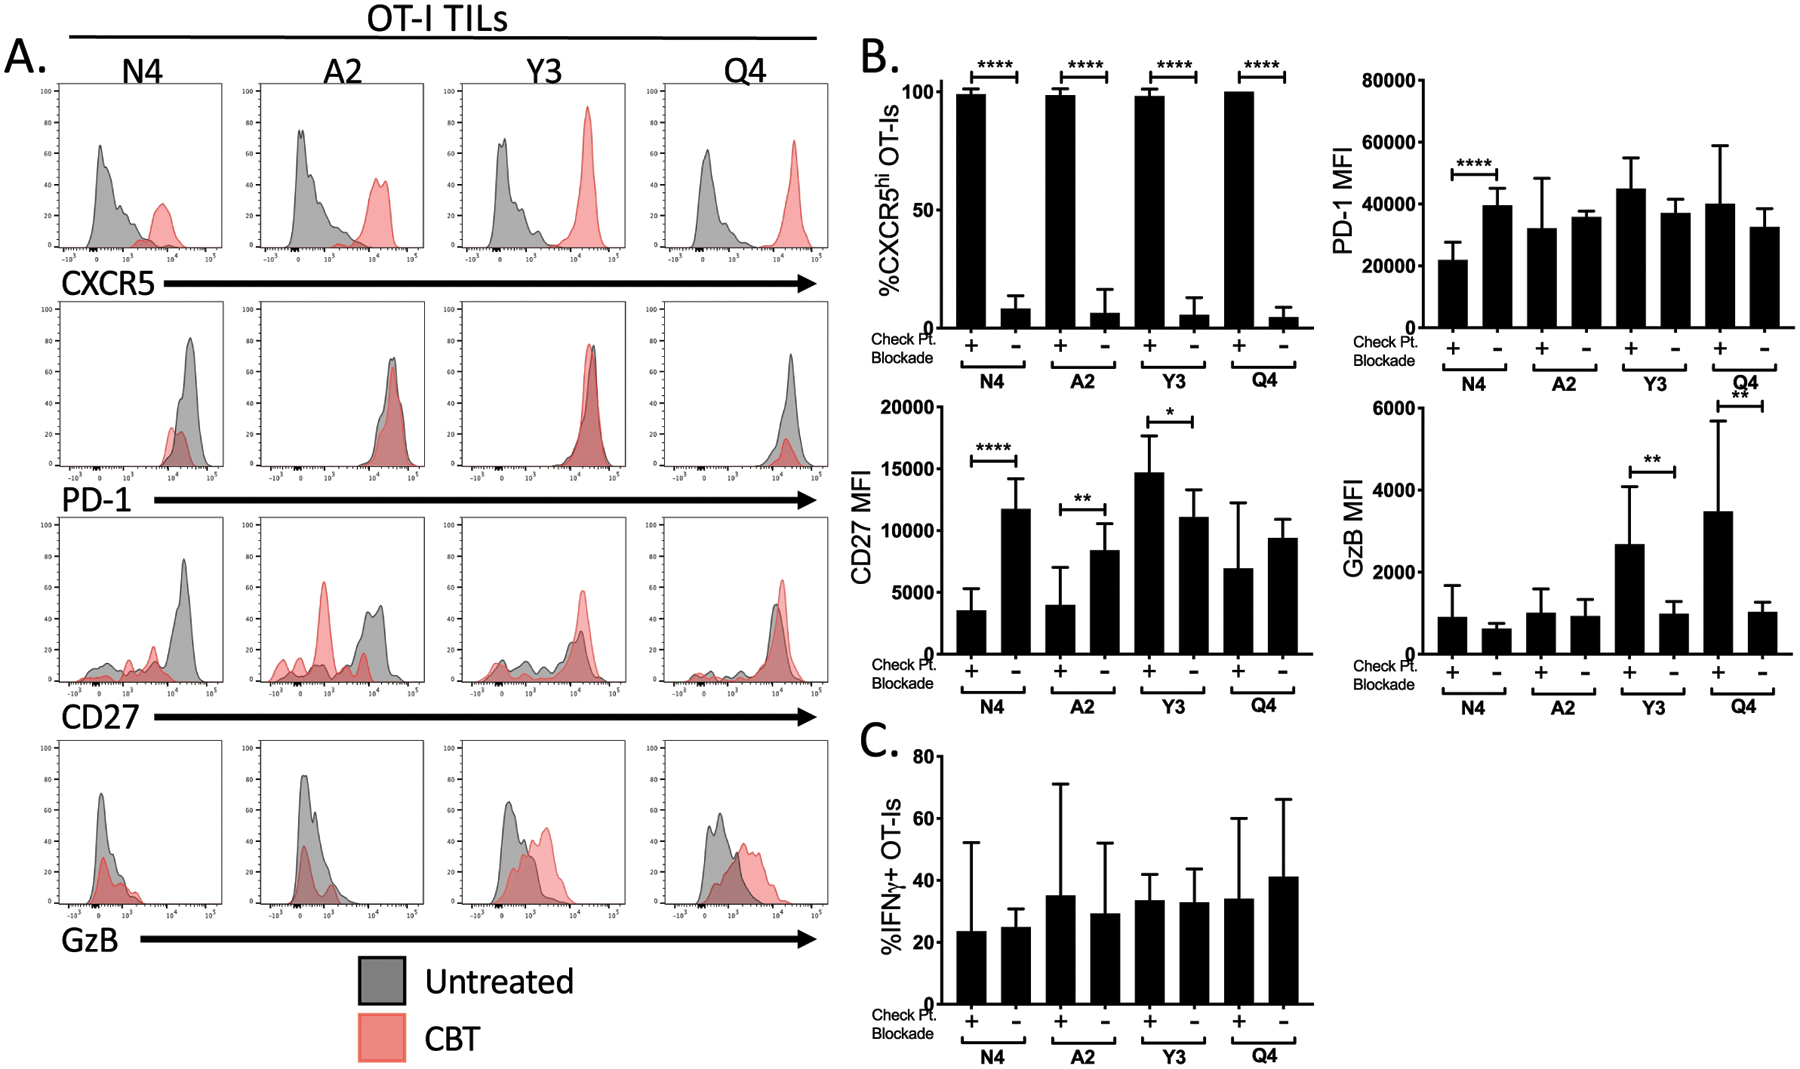
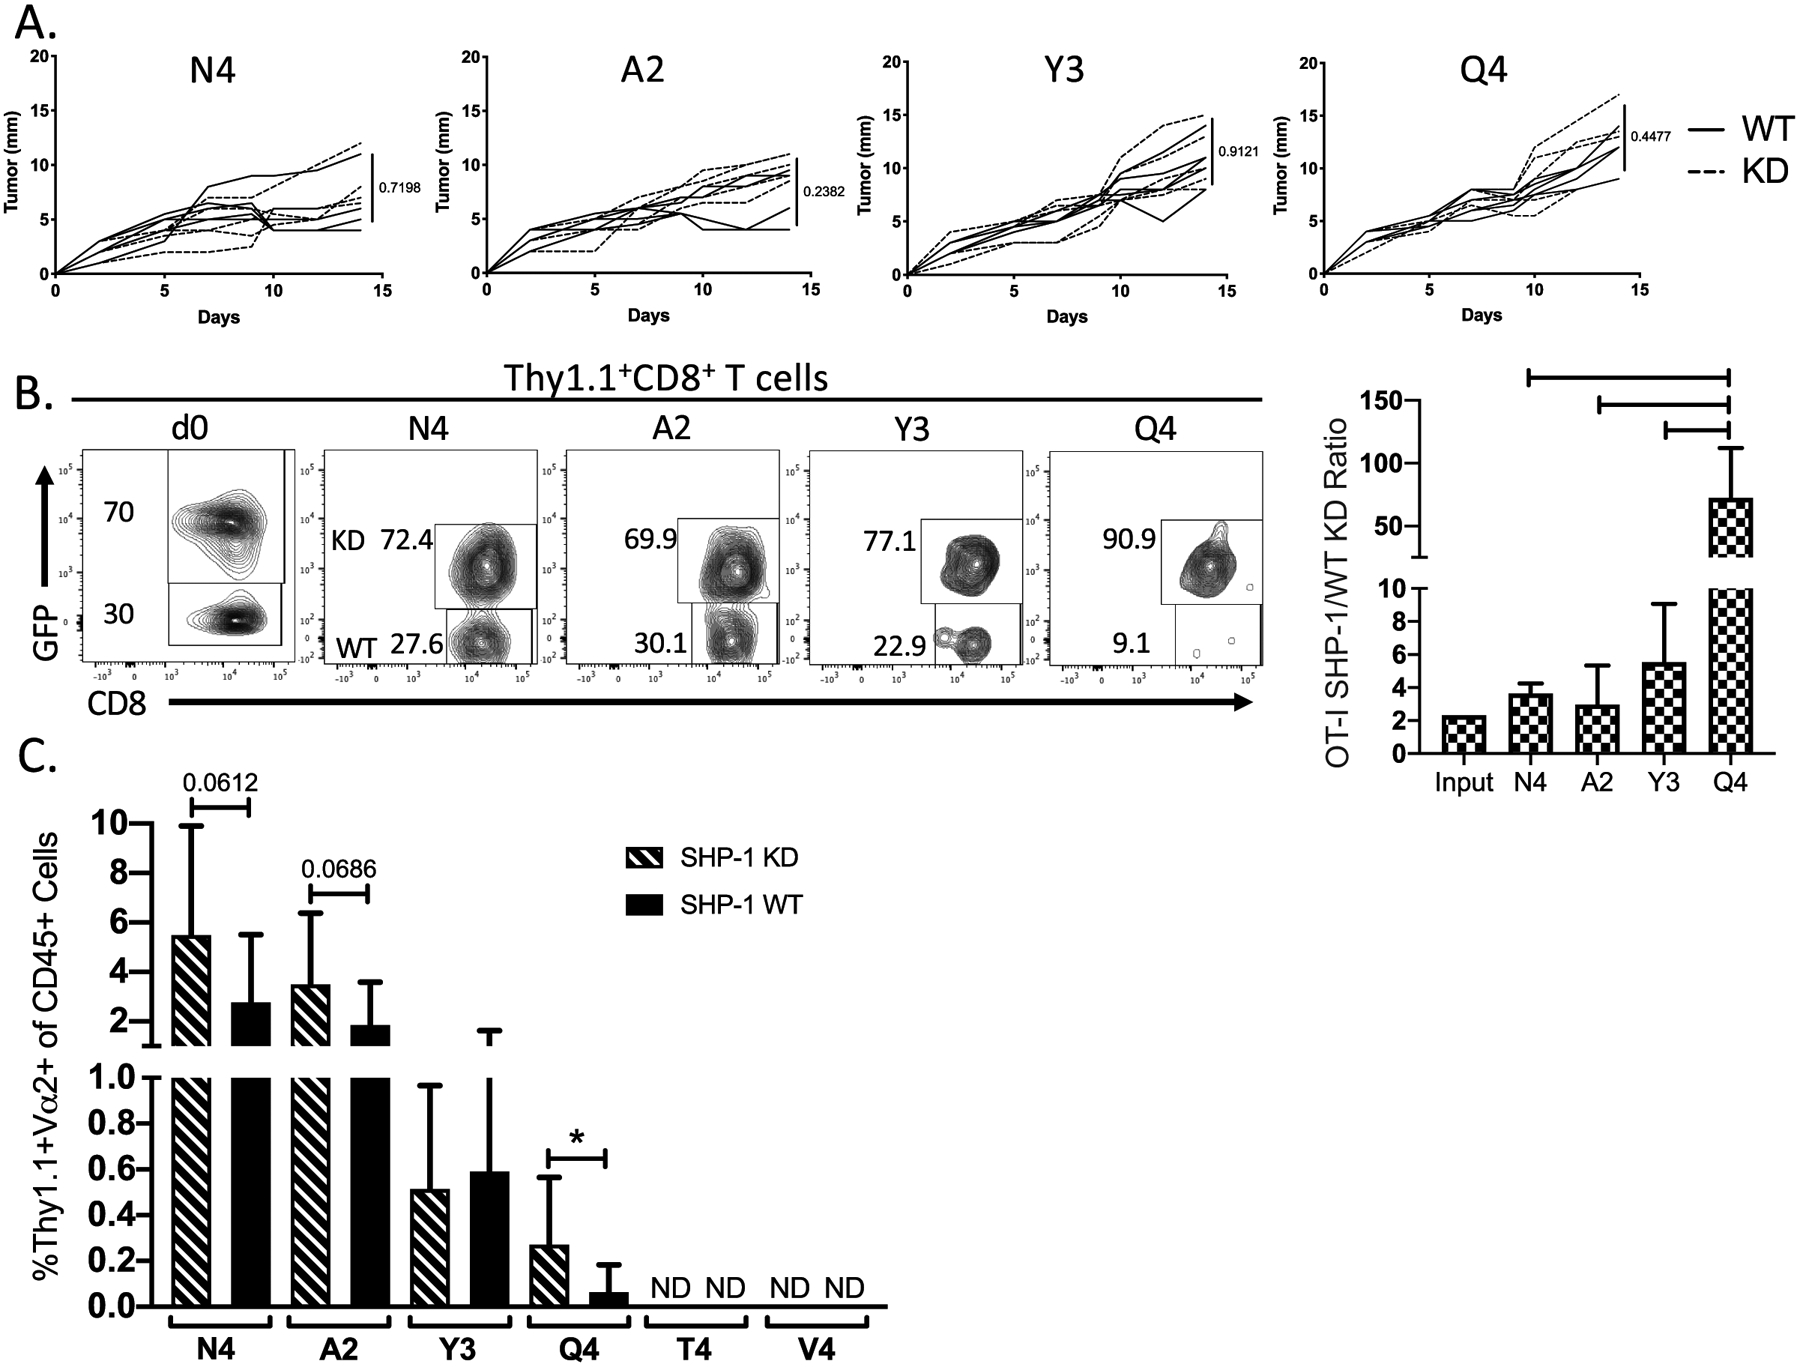
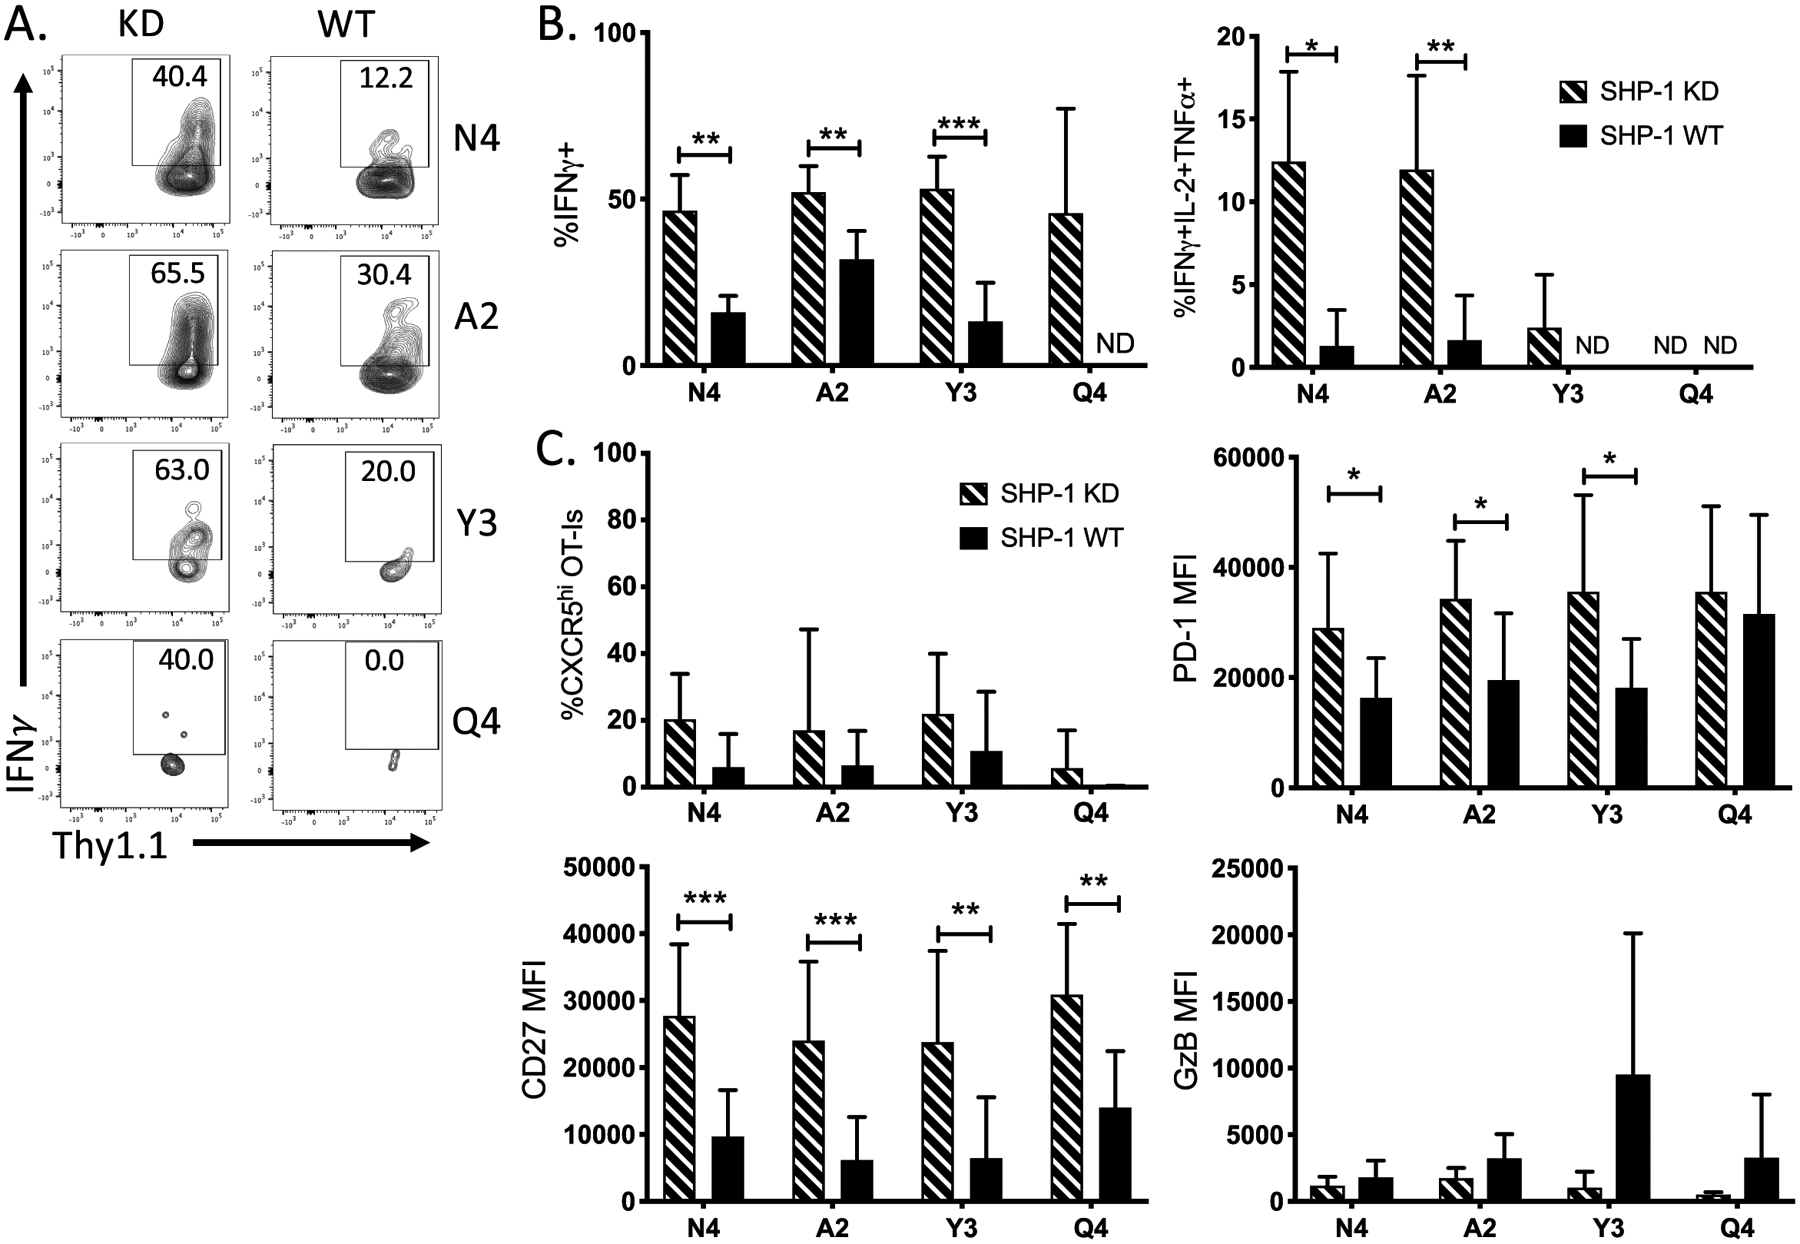
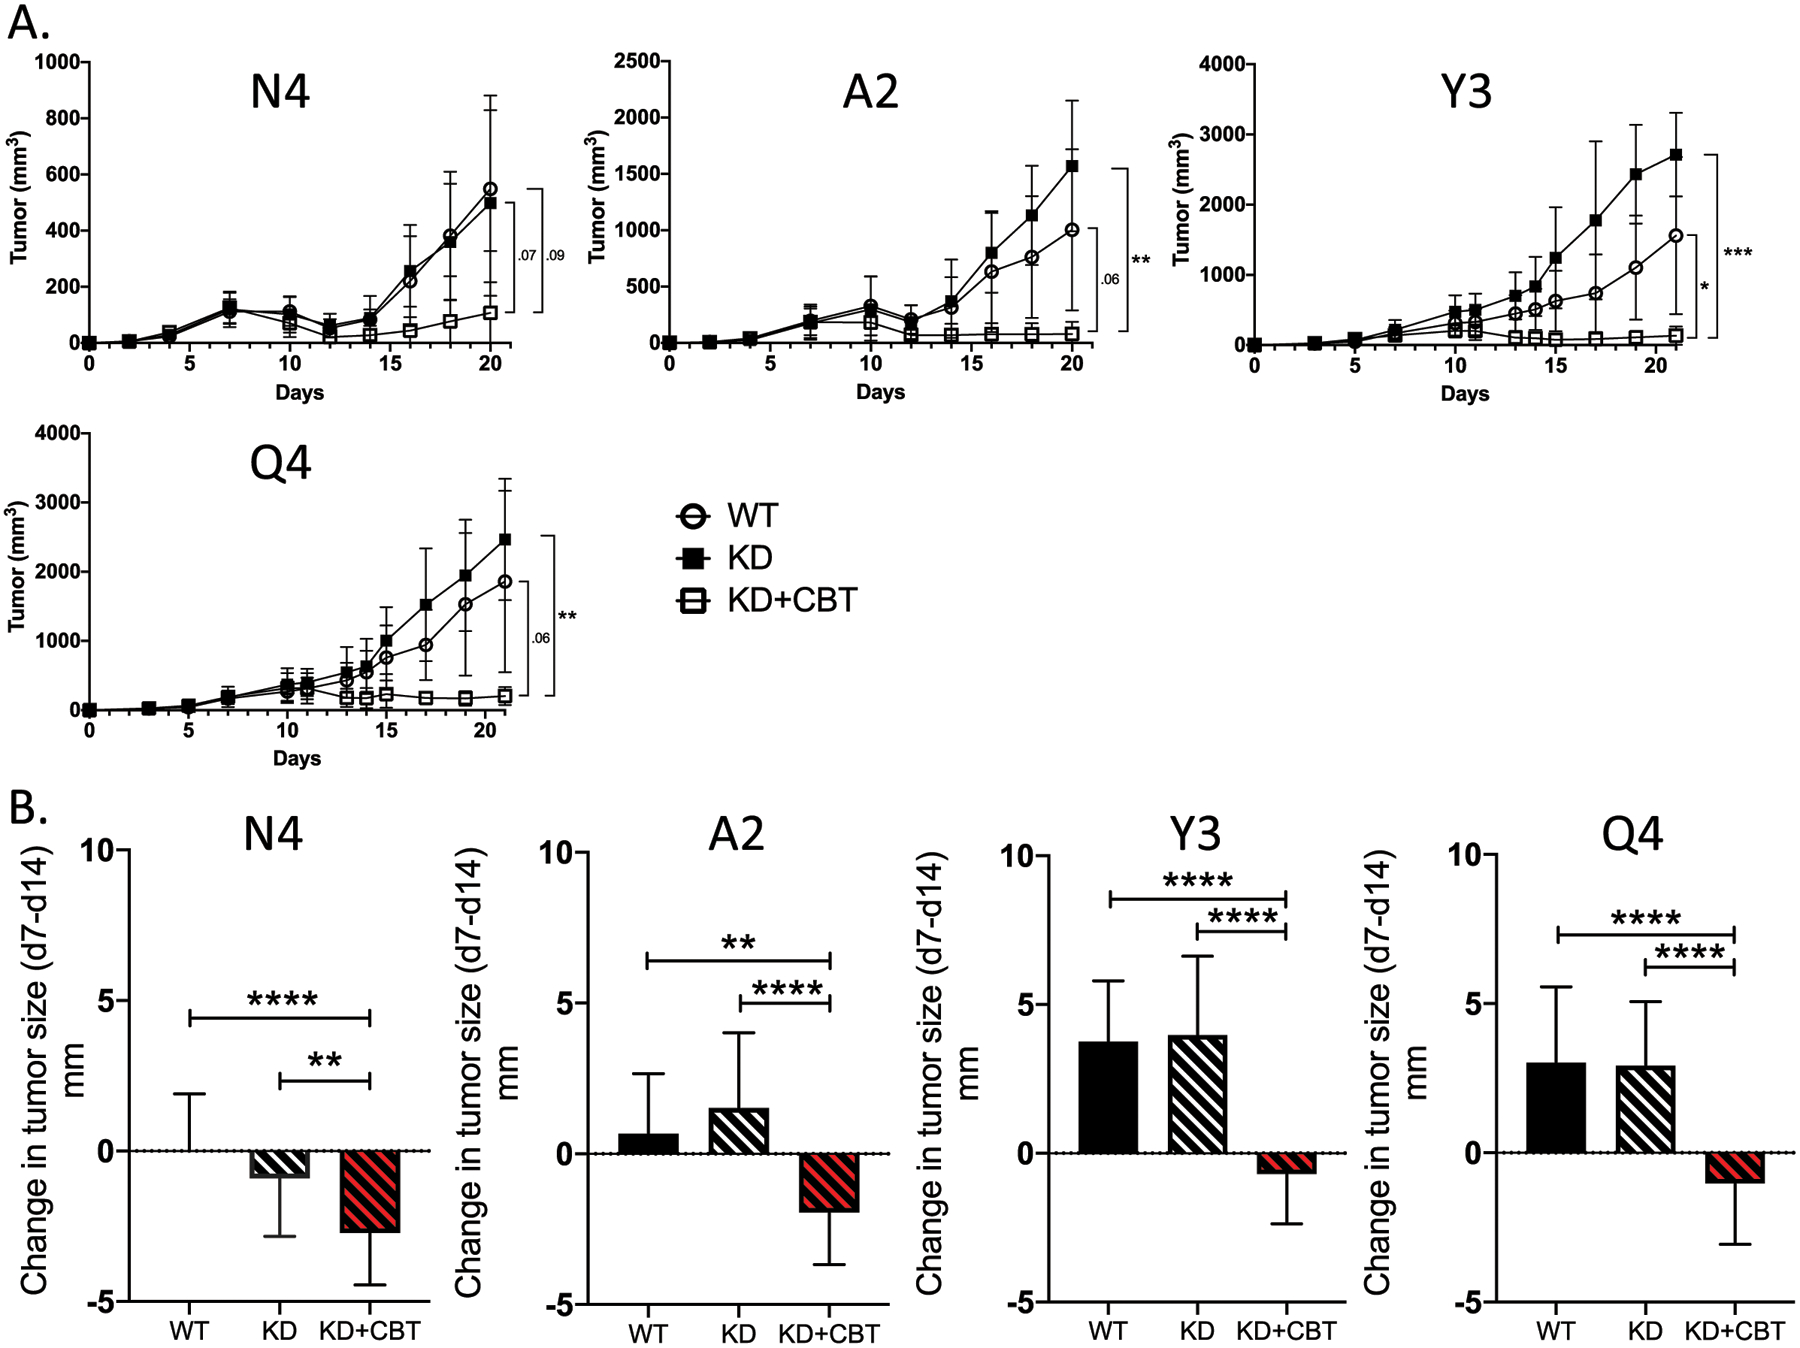
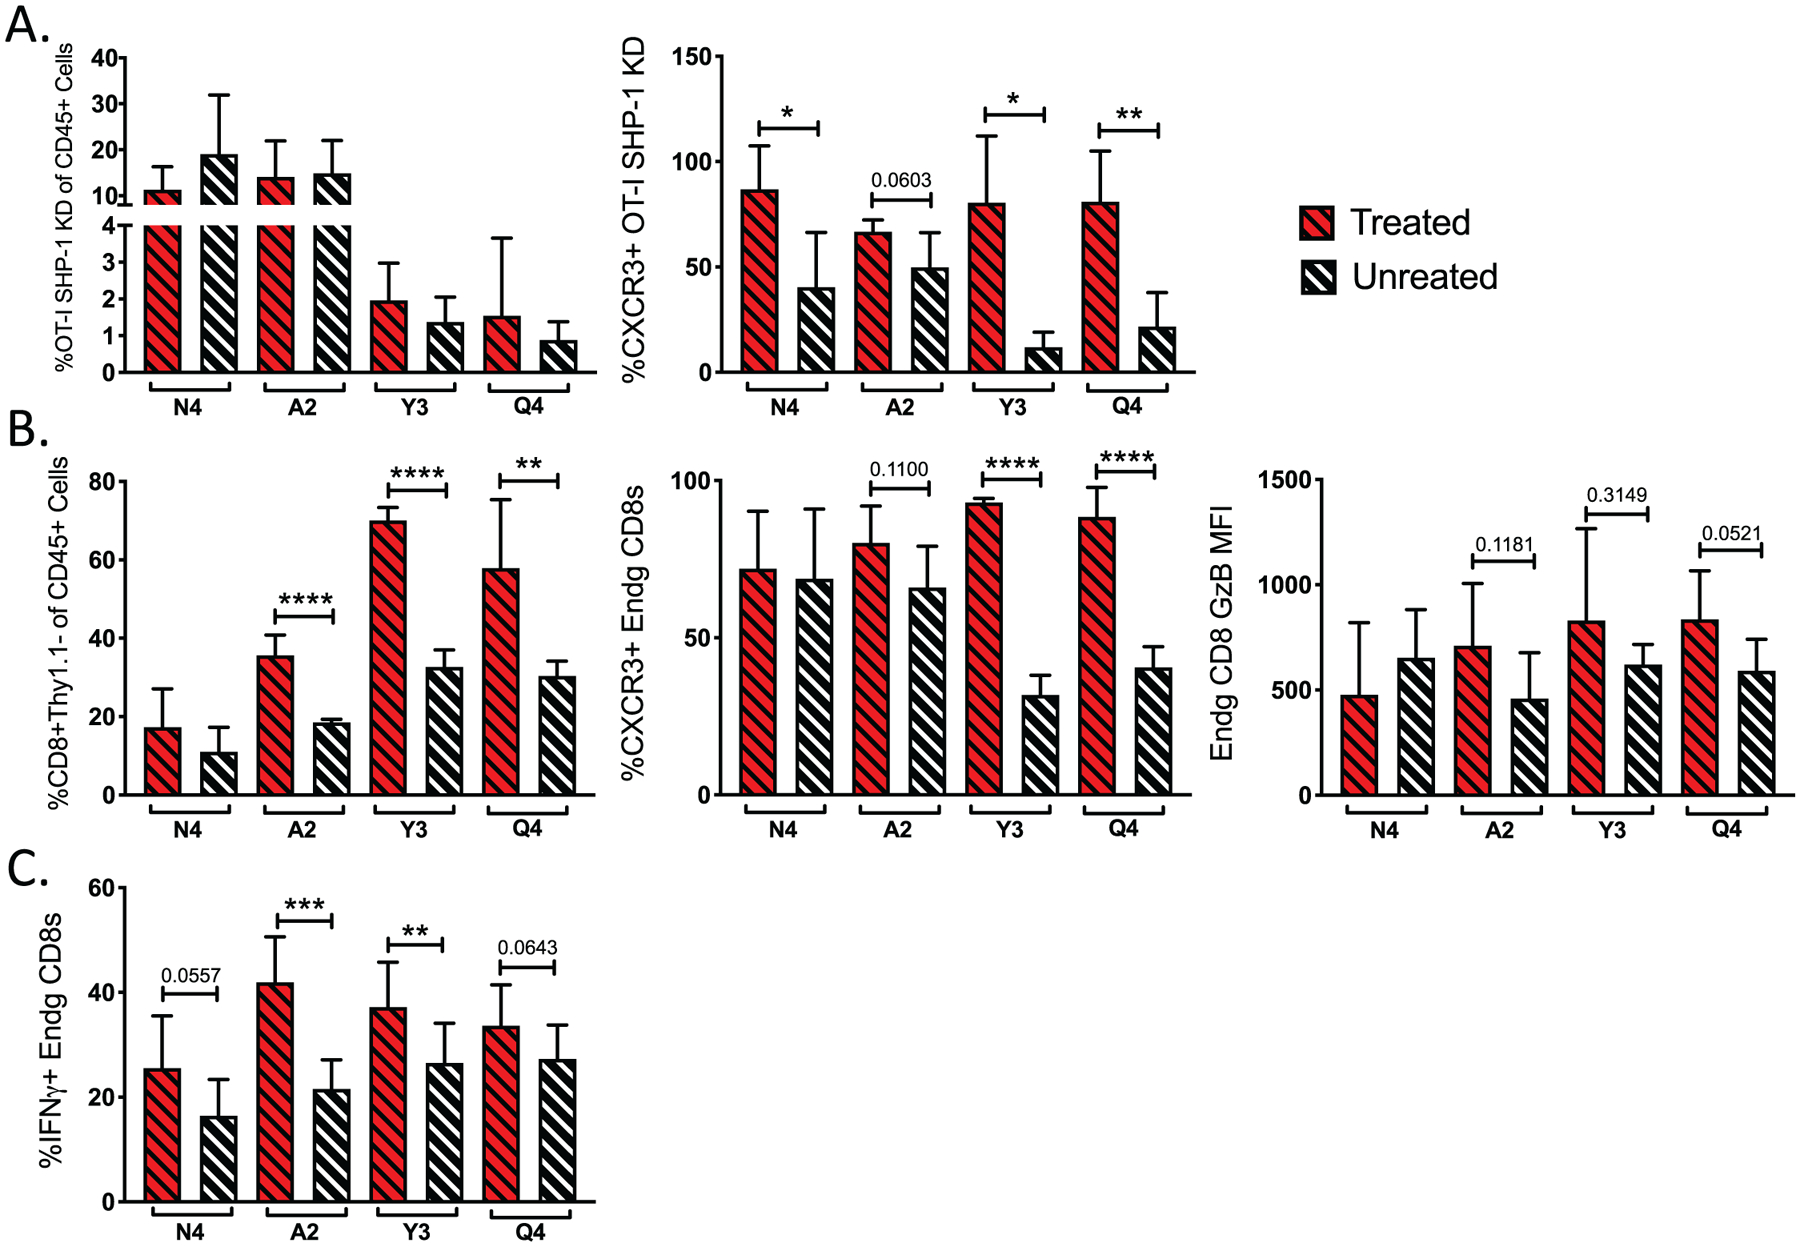
The presence and activity of CD8+ T cells within the tumor microenvironment are essential for the control of tumor growth. Utilizing B16-F10 melanoma tumors that express altered peptide ligands of chicken ovalbumin, OVA257-264, we measured high- and low-affinity OVA-specific responses following adoptive transfer of OT-I CD8+ T cell into mice subsequently challenged with tumors. T-cell receptor (TCR) affinity positively correlated with the frequency of OT-I tumor-infiltrating lymphocytes (TIL). Differences in TCR affinity inversely corresponded to in vivo tumor growth rate. Blockade of the PD-1 and CTLA-4 checkpoints preferentially increased the frequency and antitumor function of TIL responding to high-affinity antigens, while failing to enhance the antitumor activity of low-affinity T cells. To determine whether lowering the TCR activation threshold could enhance the breadth and magnitude of the antitumor T-cell response, we inhibited Src homology region 2 domain-containing phosphatase 1 (SHP-1) in OT-I T cells prior to tumor antigen exposure. SHP-1 knockdown increased the cytokine-producing potential of high- and low-affinity T cells but failed to enhance control of tumor growth. In contrast, when SHP-1 knockdown of OT-I T cells was combined with immunotherapy, we observed a significant and long-lasting suppression of tumor growth mediated by low-affinity T cells. We conclude that lowering the TCR activation threshold by targeting SHP-1 expands the repertoire of T cells available to respond to conventional checkpoint blockade, leading to enhanced control of tumor growth.


Figures

Figure 1:
Figure 1:
Antitumor responses are dominated by high-affinity CD8+ T cells. (A) Line graph indicates the growth of B16-OVA(N4) or B16-OVA(V4) tumors in the presence or absence of OT-I CD8+ T cells. The bar graph depicts the final tumor diameter at day 15 post implantation. (B) The line graph indicates the growth kinetics of B16-OVA(APL) tumors in B6 mice that received OT-I CD8+ T cells. The bar graph shows the final tumor diameters for all 6 different OVA(APL)s. (C) Representative flow plots show the gating scheme used to determine the frequency of OT-I CD8+ T cells (CD45+Thy1.1+Va2+) within the tumor. (D) Bar graph indicates the frequency of OT-I T cells within the CD45+ cell population in B16-OVA(APL) tumors 14 days after implantation. (E) Bar graphs show the expression of PD-1, CXCR3 and Granzyme B in either frequency or mean fluorescence intensity (MFI) via flow cytometry of OT-I CD8+ T cells within the tumor. (F) Bar graphs indicate the frequency of single or multi-cytokine producing OT-I T cells after ex vivo restimulation with corresponding OVA(APL) peptide. Error bars indicate SD. Statistical significance was determined by an unpaired t test *P < 0.05, **P < 0.01 (n=5–8 mice per group, representative of two independent experiments).
Figure 2:
Figure 2:
Checkpoint blockade therapy preferentially enhances high-affinity T cell responses. (A) Line graphs show the average growth kinetics of the different B16-OVA(APL) tumors in the presence (filled square) or absence (open square) of checkpoint blockade therapy administered on days 7 and 10 post tumor inoculation. (B) Bar graph indicates the frequency of OT-Is in the CD45+ population within each tumor subset at day 14 post implantation. Error bars indicate SD. Statistical significance was determined by comparing the area under the tumor growth curve (A) or group means (B) using an unpaired t test (n=18 mice per group, representative of two independent experiments). *P < 0.05, **P < 0.01, ***P < 0.001, ****P < 0.0001.
Figure 3:
Figure 3:
Functional responses to ICB differ based on TCR affinity for tumor antigen. (A) Representative flow plots show the expression of CXCR5, PD-1, CD27 and Granzyme B within OT-I T cells extracted from the CB treated (red) and untreated tumors (grey). (B) Bar graphs indicate the expression of CXCR5, PD-1, LAG-3, CD27, and Granzyme B in either frequency or MFI on OT-I T cells isolated from B16-OVA(APL) tumors from CB treated (+) or untreated (–) mice. (C) Bar graphs show the production of IFNγ by OT-I CD8+ T cells following ex vivo restimulation with corresponding OVA(APL) for each group. Error bars indicate SD, and statistical significance was determined by an unpaired t test (n=8 mice per group, representative of two independent experiments). *P < 0.05, **P < 0.01, ***P < 0.001, ****P < 0.0001.
Figure 4:
Figure 4:
Inhibition of SHP-1 in antitumor CD8+ T cells expands available repertoire for low-affinity tumor antigen. We generated OT-I bone marrow chimeras expressing a SHP-1-specific shRNA, along with a GFP reporter. One day before tumor cell implantation, OT-I T cells were adoptively transferred into naïve B6 recipient mice. GFP+ (SHP-1 KD) and GFP (non-transduced, SHP-1 WT) OT-I T cells in the tumor were analyzed. (A) Line graphs indicate the growth kinetics of the different B16-OVA(APL) tumors in the presence of SHP-1 KD (dashed) or WT (solid) OT-I CD8+ T cells. (B) Representative flow plots show the frequency of GFP+ (SHP-1 KD) compared to GFP (SHP-1 WT) OT-I T cells within the OT-I CD8+ T cell population of a single tumor at time of harvest, including the frequency of the OT-I population upon initiation of the experiment (d0). Bar graph indicates the ratio of SHP-1 KD to WT OT-I T cells found in the tumor at day 14 post implantation. (C) Bar graph shows the percent OT-Is within the CD45+ cell population SHP-1 KD OT-I T cells (dashed) compared to WT counterparts (filled) within the same tumor. Frequencies are normalized to input of KD:WT OT-Is at time of adoptive transfer. Error bars indicate SD. Values that are not detectable above background are labeled ND. Statistical significance was determined by comparing the area under the tumor growth curve (A) or group mean (B-C) using an unpaired t test (n=5–8 mice per group, representative of two independent experiments). *P < 0.05, **P < 0.01.
Figure 5:
Figure 5:
Inhibition of SHP-1 in antitumor CD8+ T cells enhances cytokine production. (A) Representative flow plots show the production of IFNγ by either SHP-1 KD OT-I CD8+ TILs or their WT counterparts following ex vivo restimulation with full-length OVA peptide. (B) Bar graphs indicate the frequency of cytokine producing OT-I SHP-1 KD (dashed) or WT (solid) T cells at d14 post tumor cell implantation. (C) Bar graphs show the frequency of expression or MFI of surface markers CXCR5, PD-1, CD27 and Granzyme B on OT-I T cells. Error bars indicate SD. Statistical significance was determined by comparing the group means using an unpaired t test (n=8–15 mice per group, representative of three independent experiments). *P < 0.05, **P < 0.01, ***P < 0.001.
Figure 6:
Figure 6:
Inhibition of SHP-1, combined with ICB, promotes tumor regression across a wide range of tumor antigen affinities. (A) Line graphs indicate the growth kinetics of tumors in the presence of WT OT-I CD8+ T cells (open circle), SHP-1 KD OT-Is (filled square) and SHP-1 KD OT-Is in the presence of ICB (open square). (B) Bar graphs show the change in tumor diameter between day 7 (pre-treatment) and day 14 (post-treatment). Comparisons between WT (solid), SHP-1 KD (black dashed), and SHP-1 KD with CB treatment (red dashed) are made for each OVA(APL). Error bars indicate SD. Statistical significance was determined by comparing the area under the tumor growth curve (A) or group mean (B) using an unpaired t test (n=10–15 mice per group, representative of two independent experiments). *P < 0.05, **P < 0.01, ***P < 0.001.
Figure 7:
Figure 7:
ICB combined with SHP-1 inhibition increases the frequency of IFNγ-producing endogenous antitumor T cells. (A) Bar graphs indicate the frequency of SHP-1 KD OT-Is in the CD45+ population with (red dashed) and without (black dashed) ICB and CXCR3 surface expression on KD OT-Is. (B) Bar graphs show the frequency of endogenous CD8+ T cells (Thy1.1) within the CD45+ population in the tumor and expression of CXCR3 and Granzyme B on endogenous CD8+ T cells with (red dashed) or without (black dashed) ICB. (C) Bar graphs indicate the frequency of IFNγ producing endogenous CD8+ T cells after ex vivo restimulation with corresponding OVA(APL) peptide. Error bars indicate SD, and statistical significance was determined by an unpaired t test (n=10–15 mice per group, representative of two independent experiments). *P < 0.05, **P < 0.01, ***P < 0.001.

References

    1. Atkins MB, Lotze MT, Dutcher JP, Fisher RI, Weiss G, Margolin K, et al. High-dose recombinant interleukin 2 therapy for patients with metastatic melanoma: analysis of 270 patients treated between 1985 and 1993. J Clin Oncol 1999;17(7):2105–16. - PubMed
    1. Mocellin S, Pasquali S, Rossi CR, Nitti D. Interferon alpha adjuvant therapy in patients with high-risk melanoma: a systematic review and meta-analysis. Journal of the National Cancer Institute 2010;102(7):493–501 doi 10.1093/jnci/djq009. - DOI - PubMed
    1. Rosenberg SA, Yang JC, Topalian SL, Schwartzentruber DJ, Weber JS, Parkinson DR, et al. Treatment of 283 consecutive patients with metastatic melanoma or renal cell cancer using high-dose bolus interleukin 2. JAMA 1994;271(12):907–13. - PubMed
    1. Hamid O, Robert C, Daud A, Hodi FS, Hwu WJ, Kefford R, et al. Safety and tumor responses with lambrolizumab (anti-PD-1) in melanoma. N Engl J Med 2013;369(2):134–44 doi 10.1056/NEJMoa1305133. - DOI - PMC - PubMed
    1. Hodi FS, O’Day SJ, McDermott DF, Weber RW, Sosman JA, Haanen JB, et al. Improved survival with ipilimumab in patients with metastatic melanoma. N Engl J Med 2010;363(8):711–23 doi 10.1056/NEJMoa1003466. - DOI - PMC - PubMed

Publication types

MeSH terms