Randomized Controlled Trial
. 2020 Jul;69(7):1258-1268.
doi: 10.1136/gutjnl-2019-320438. Epub 2020 Feb 19.

Mediterranean diet intervention in overweight and obese subjects lowers plasma cholesterol and causes changes in the gut microbiome and metabolome independently of energy intake

Affiliations
Randomized Controlled Trial

Mediterranean diet intervention in overweight and obese subjects lowers plasma cholesterol and causes changes in the gut microbiome and metabolome independently of energy intake

Victoria Meslier et al. Gut. 2020 Jul.

Abstract

Objectives: This study aimed to explore the effects of an isocaloric Mediterranean diet (MD) intervention on metabolic health, gut microbiome and systemic metabolome in subjects with lifestyle risk factors for metabolic disease.

Design: Eighty-two healthy overweight and obese subjects with a habitually low intake of fruit and vegetables and a sedentary lifestyle participated in a parallel 8-week randomised controlled trial. Forty-three participants consumed an MD tailored to their habitual energy intakes (MedD), and 39 maintained their regular diets (ConD). Dietary adherence, metabolic parameters, gut microbiome and systemic metabolome were monitored over the study period.

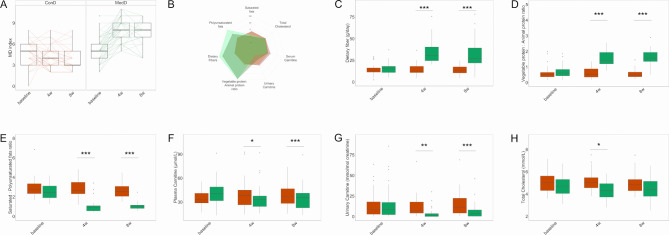
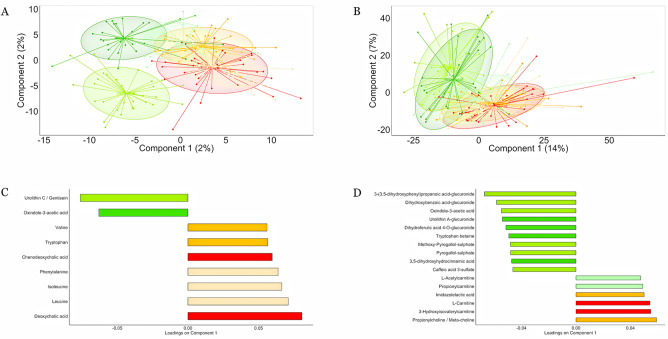
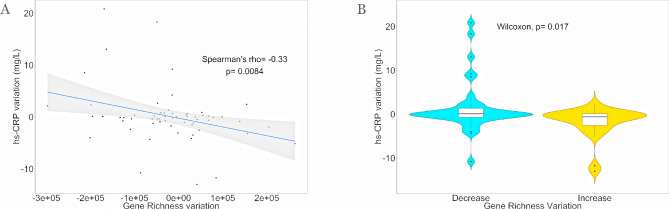
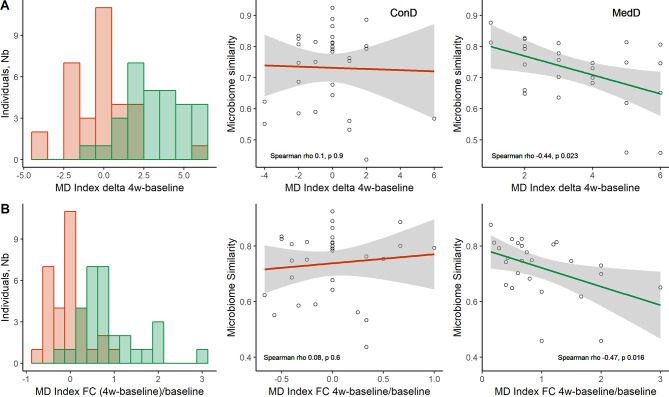
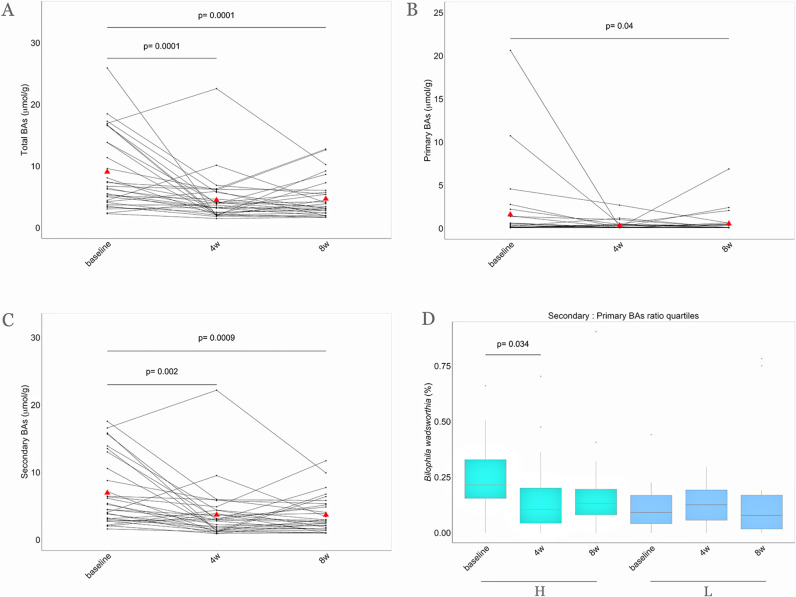
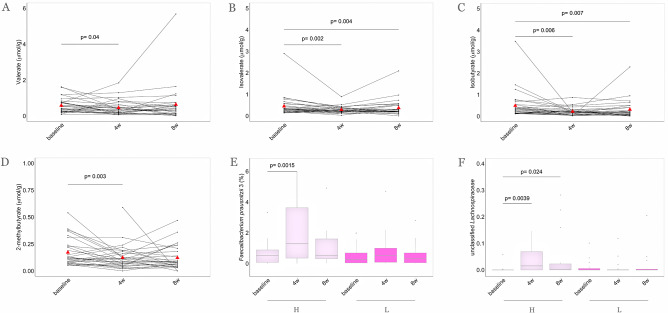
Results: Increased MD adherence in the MedD group successfully reprogrammed subjects' intake of fibre and animal proteins. Compliance was confirmed by lowered levels of carnitine in plasma and urine. Significant reductions in plasma cholesterol (primary outcome) and faecal bile acids occurred in the MedD compared with the ConD group. Shotgun metagenomics showed gut microbiome changes that reflected individual MD adherence and increase in gene richness in participants who reduced systemic inflammation over the intervention. The MD intervention led to increased levels of the fibre-degrading Faecalibacterium prausnitzii and of genes for microbial carbohydrate degradation linked to butyrate metabolism. The dietary changes in the MedD group led to increased urinary urolithins, faecal bile acid degradation and insulin sensitivity that co-varied with specific microbial taxa.

Conclusion: Switching subjects to an MD while maintaining their energy intake reduced their blood cholesterol and caused multiple changes in their microbiome and metabolome that are relevant in future strategies for the improvement of metabolic health.

Keywords: diet; intestinal microbiology; nutrition.


Conflict of interest statement

Competing interests: None declared.

Figures

Figure 1
Figure 1
Adherence to the Mediterranean diet (MD) and changes in dietary and metabolic variables. (A) Box plots showing MD index score for controls (ConD) or treated subjects (MedD) during the intervention, the significance was tested by applying the post hoc Friedman-Nemenyi test for pairwise test of multiple comparisons within each group. (B) Percentage changes in dietary and metabolic variables are represented as spider chart. Changes in levels of dietary components consumption including (C) dietary fibre, (D) vegetable proteins/animal proteins ratio, (E) saturated to polyunsaturated fats ratio. Reduction in serum and urinary markers such as (F) plasma carnitine, (G) urinary carnitine and (H) total cholesterol. The significance was tested by applying unpaired Wilcoxon rank-sum tests for variation at the specific time point compared with baseline in MedD versus ConD. Orange boxes refer to controls and green boxes to Mediterranean subjects, respectively. Baseline, 0 weeks; 4w, 4 weeks; 8w, 8 weeks of nutritional intervention (*p<0.05, **p<0.01 and ***p<0.001).
Figure 2
Figure 2
Mediterranean diet changes the intestinal and systemic metabolome. Partial least squares discriminant analysis plots based on molecular features detected in (A) faeces and (B) urine. Subjects belonging to different categories were coloured according to diet and time points: MedD subjects at baseline (light green), after 4 weeks (green) and 8 weeks of intervention (dark green). ConD subjects at baseline (light orange), after 4 weeks (orange) and 8 weeks (dark orange) of intervention. The loading plots display vectors that contributed the most to variability of individual dataset; variables explaining the variance between the groups in (C) faecal and (D) urine metabolome are reported as bar plots.
Figure 3
Figure 3
Microbial diversity richness anticorrelates with inflammation. (A) Spearman’s correlation between variation of gut microbial gene richness and individual inflammatory status (serum hs-CRP) variation at the end of trial; n observation=62. (B) Violin plot showing differences in serum hs-CRP variation between subjects increasing (n=25, yellow) compared with subjects decreasing (n=37, light blue) gene richness at the end of trial. Statistical differences between groups were determined using unpaired Wilcoxon rank-sum tests. hs-CRP, high sensitivity C reactive protein.
Figure 4
Figure 4
Mediterranean diet (MD) affects gut microbiome composition. (A) Total delta MD index changes over the 4w-baseline period. Left: histograms of delta (4w-baseline) MD index (n=62). Right: linear regressions of microbiome similarity compared with delta 4w-baseline MD index. Microbiome similarity was estimated by Spearman correlations between microbial composition at 4 weeks and baseline within each individual. (B) Total MD index fractional changes (FCs) (4w-baseline)/baseline, used as proxy to measure the effort of adherence (n=62). Left: distribution of individuals relative to MD index FC. Right: linear regressions of microbiome similarity and FC. Spearman correlations (rho and p values) are reported, excluding outliers, for ConD (n=31) and MedD (n=26) groups, respectively. 4w, 4 weeks.
Figure 5
Figure 5
Faecal BA concentrations over the nutritional intervention. Parallel coordinate plot showing variations of faecal (A) total, (B) primary and (C) secondary BA concentrations within the MedD group during the intervention. The red triangles indicate mean values, the lines connecting dots are used to indicate the same sample at each time point. The significance was tested by applying the post hoc Friedman-Nemenyi test for pairwise test of multiple comparisons within each group. (D) In the box plot the relative abundances of Bilophila wadsworthia are compared considering subjects falling in the highest quartile (n=16, green) and in the lowest quartile of reduction (n=16, blue) of secondary to primary BAs ratio after 4 weeks of treatment. Baseline, 0 weeks; 4w, 4 weeks; 8w, 8 weeks of nutritional intervention. H, highest quartile of reduction; L, lowest quartile of reduction; BAs, bile acids.
Figure 6
Figure 6
MD intervention determines a reduction of faecal branched-chain fatty acid (BCFA) concentrations and higher levels of Faecalibacterium prausnitzii and Lachnospiraceae taxa. Parallel coordinate plot showing variations of (A) valerate, (B) isovalerate, (C) isobutyrate and (D) 2-methylbutyrate faecal concentrations within MedD population. The red triangles indicate mean values, the lines connecting dots are used to indicate the same sample at each time point. The significance was tested by applying the post hoc Friedman-Nemenyi test for pairwise test of multiple comparisons within each group. In the box plots, the relative abundances of (E) F. prausnitzii 3 and (F) Lachnospiraceae family are compared considering subjects falling in the highest quartile (n=16, violet) and in the lowest quartile (n=16, purple) of faecal butyrate increase after 4 weeks of treatment. Statistical differences between groups were determined using Wilcoxon rank-sum tests. Baseline, 0 weeks; 4w, 4 weeks; 8w, 8 weeks of intervention. H, highest quartile of increase; L, lowest quartile of increase.

Comment in

References

    1. Kelly JT, Palmer SC, Wai SN, et al. . Healthy dietary patterns and risk of mortality and ESRD in CKD: a meta-analysis of cohort studies. Clin J Am Soc Nephrol 2017;12:272–9. 10.2215/CJN.06190616 - DOI - PMC - PubMed
    1. Chiavaroli L, Viguiliouk E, Nishi SK, et al. . Dash dietary pattern and cardiometabolic outcomes: an umbrella review of systematic reviews and meta-analyses. Nutrients 2019;11:338 10.3390/nu11020338 - DOI - PMC - PubMed
    1. Martínez-González MA, Gea A, Ruiz-Canela M. The Mediterranean diet and cardiovascular health. Circ Res 2019;124:779–98. 10.1161/CIRCRESAHA.118.313348 - DOI - PubMed
    1. Bendall CL, Mayr HL, Opie RS, et al. . Central obesity and the Mediterranean diet: a systematic review of intervention trials. Crit Rev Food Sci Nutr 2018;58:3070–84. 10.1080/10408398.2017.1351917 - DOI - PubMed
    1. Eleftheriou D, Benetou V, Trichopoulou A, et al. . Mediterranean diet and its components in relation to all-cause mortality: meta-analysis. Br J Nutr 2018;120:1081–97. 10.1017/S0007114518002593 - DOI - PubMed

Publication types