. 2020 Apr 1;40(14):2849-2858.
doi: 10.1523/JNEUROSCI.2277-19.2020. Epub 2020 Feb 19.

Cortico-Thalamo-Cortical Circuits of Mouse Forelimb S1 Are Organized Primarily as Recurrent Loops

Affiliations

Cortico-Thalamo-Cortical Circuits of Mouse Forelimb S1 Are Organized Primarily as Recurrent Loops

KuangHua Guo et al. J Neurosci. .

Abstract

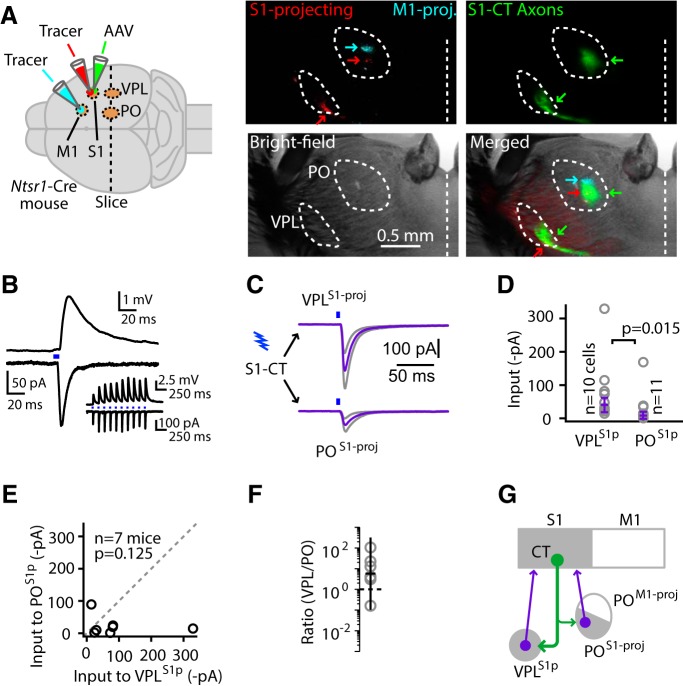
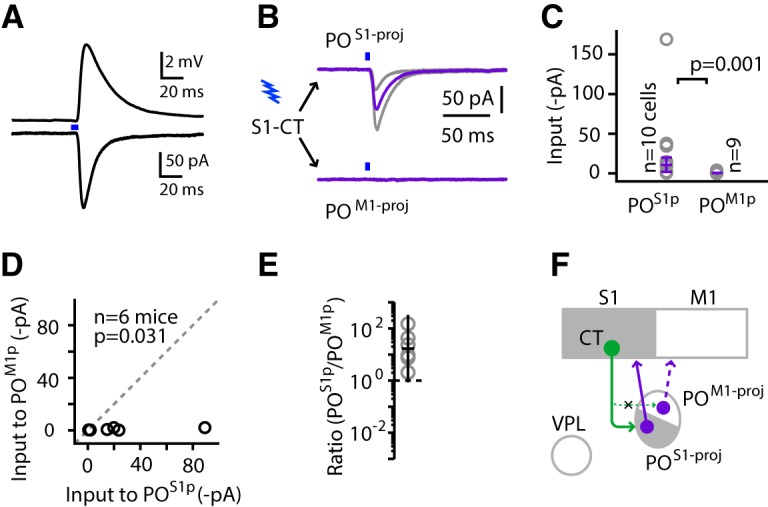
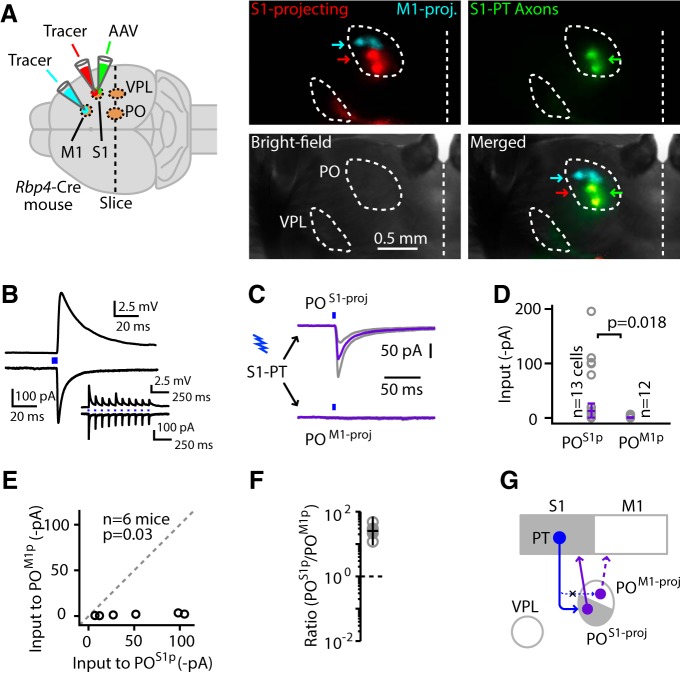
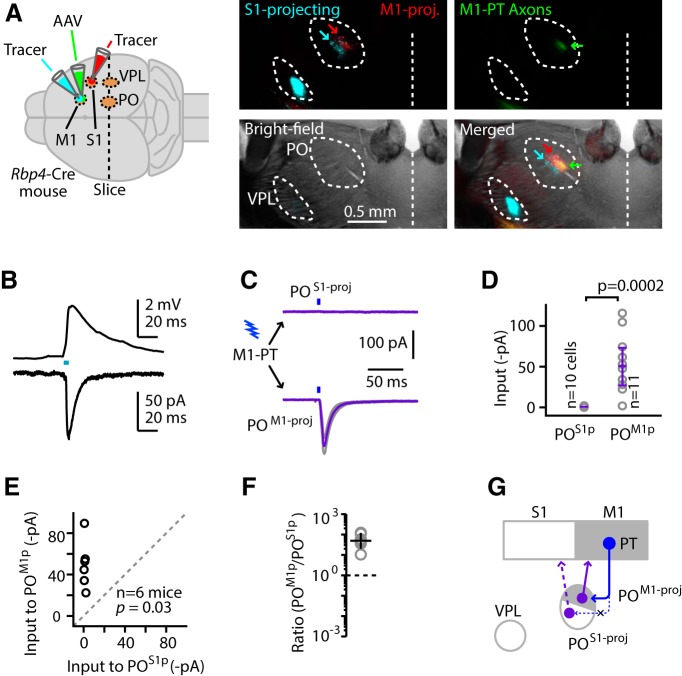
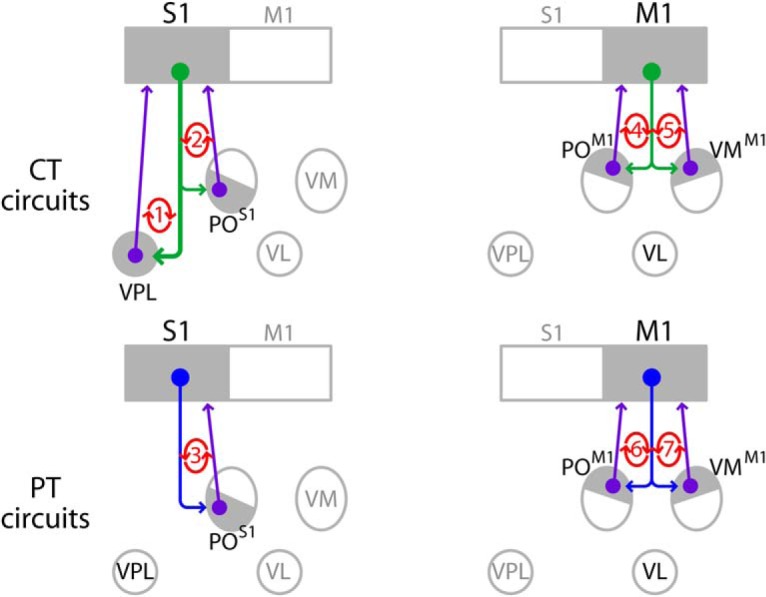
Cortical projections to the thalamus arise from corticothalamic (CT) neurons in layer 6 and pyramidal tract-type (PT) neurons in layer 5B. We dissected the excitatory synaptic connections in the somatosensory thalamus formed by CT and PT neurons of the primary somatosensory (S1) cortex, focusing on mouse forelimb S1. Mice of both sexes were studied. The CT neurons in S1 synaptically excited S1-projecting thalamocortical (TC) neurons in subregions of both the ventral posterior lateral and posterior (PO) nuclei, forming a pair of recurrent cortico-thalamo-cortical (C-T-C) loops. The PT neurons in S1 also formed a recurrent loop with S1-projecting TC neurons in the same subregion of the PO. The PT neurons in the adjacent primary motor (M1) cortex formed a separate recurrent loop with M1-projecting TC neurons in a nearby subregion of the PO. Collectively, our results reveal that C-T-C circuits of mouse forelimb S1 are primarily organized as multiple cortical cell-type-specific and thalamic subnucleus-specific recurrent loops, with both CT and PT neurons providing the strongest excitatory input to TC neurons that project back to S1. The findings, together with those of related studies of C-T-C circuits, thus suggest that recurrently projecting thalamocortical neurons are the principal targets of cortical excitatory input to the mouse somatosensory and motor thalamus.SIGNIFICANCE STATEMENT Bidirectional cortical communication with the thalamus is considered an important aspect of sensorimotor integration for active touch in the somatosensory system, but the cellular organization of the circuits mediating this process is not well understood. We used an approach combining cell-type-specific anterograde optogenetic excitation with single-cell recordings targeted to retrogradely labeled thalamocortical neurons to dissect these circuits. The findings reveal a consistent pattern: cortical projections to the somatosensory thalamus target thalamocortical neurons that project back to the same cortical area. Commonalities of these findings to previous descriptions of related circuits in other areas suggest that cortico-thalamo-cortical circuits may generally be organized primarily as recurrent loops.

Keywords: channelrhodopsin; connectivity; corticothalamic; motor; somatosensory; thalamocortical.


Figures

Figure 1.
Figure 1.
Localization of forelimb S1. A, Schematic (left) showing dorsal surface of mouse cortex, with location of forelimb S1 based on standard atlas coordinates. Coronal slice (center) and flat map (right) from a Scnn1a-Cre × nt-mCherry mouse, which labels layer 4 (L4) neurons in somatosensory areas. PMBSF, posterior medial barrel subfield. B, Schematic (left) showing injection in forelimb S1 of tracer for retrograde labeling. Images show the cortical injection site (center) and the thalamic labeling in VPL and PO (right). C, Localization of the forelimb S1 area by somatosensory mapping with in vivo flavoprotein autofluorescence imaging. Responses were evoked by tactile stimulation of the forepaw, hindpaw, or whiskers. Images show the ΔF/F responses for each body part after averaging across animals (n = 5), thresholding, and peak normalization (Materials and Methods). The merged image (right) is a composite of the forepaw (red channel; arrow), hindpaw (green), and whisker (blue) maps, and shows the convex hulls and fluorescence intensity-weighted centroids of the thresholded responses. Black cross (+) marks the bregma.
Figure 2.
Figure 2.
Anatomy of forelimb S1-related C-T-C pathways in thalamus. A, Schematic of injection strategy: both AAV-EGFP and CTB647 were injected into the forelimb S1 area of a Gad2-mCherry mouse. B, Bright-field/fluorescence images of a coronal slice containing the cortical injection site, showing the red (top) and green (middle) channels separately and merged (bottom). C, Bright-field (left) and merged fluorescence (right) images of a coronal slice at the level of the VPL and PO nuclei of the thalamus. The thalamic RTN is labeled with Gad2-mCherry signal (for clarity, displayed as blue). D, Higher-magnification views of the labeling pattern across the thalamus (series of 150 μm slices). The RTN is labeled with Gad2-mCherry signal (blue). Axons from S1 (green) pierce the RTN anteriorly and then course posteriorly, ramifying in subregions of the VPL and PO nuclei. Insets show the red and green channels separately, and their horizontal fluorescence profiles (bottom traces; peak normalized), for the labeling patterns in VPL (8) and PO (9). E, Schematic of injection strategy: in a WT mouse, both AAV-EGFP and CTB647 were injected into the forelimb S1 area, and a second retrograde tracer (red RetroBeads) was injected into the forelimb M1 area. F, The cortical injection sites (coronal slice). G, Merged fluorescence image (coronal slice) at the level of the VPL and PO nuclei of the thalamus, with the thalamic region of interest shown enlarged (right) and labeled to indicate the S1 axons (green) and the S1-projecting (blue) and M1-projecting (red) TC neurons (cyan: overlap of green and blue labeling). H, Higher-magnification views of the labeling pattern across the thalamus (series of 150 μm slices). Insets: enlarged views of PO labeling (contrast and brightness optimized). Plots: vertical fluorescence profiles (peak normalized) of labeling in PO (top; with all three channels) and VPL (bottom; green and blue channels only, as there was no labeling in the red channel).
Figure 3.
Figure 3.
S1-CT axons excite S1-projecting TC neurons in the VPL and PO. A, Schematic (left) of injections of retrograde tracers in S1 and M1, and Cre-dependent AAV-ChR2 in M1, of an Ntsr1-Cre mouse. Images (right) are from a coronal slice through the somatosensory nuclei of the thalamus showing retrograde labeling of S1-projecting and M1-projecting neurons (top left), anterograde labeling of axons (top right), and bright-field (bottom left) and merged (bottom right) images. B, Example traces showing excitatory synaptic responses (top, EPSP; bottom, EPSC) recorded in a VPLS1-proj neuron, evoked by photostimulation of ChR2-expressing S1-CT axons. Inset: responses to trains of stimuli. C, EPSCs recorded in retrogradely labeled TC neurons. Single photostimuli (blue bars above traces) were used to activate ChR2-expressing axons. Traces represent group-averaged responses (±SEM; gray lines). D, Cell-based group comparison of input to individual neurons (circles). Error bars represent the median input across cells ± m.a.d. The p value for the rank-sum test comparing the two groups is shown, along with the numbers of cells per group. E, Animal-based group comparison of input recorded in the two cell types, averaged for each animal (circles). The p value for the sign test comparing the two groups is shown along with the number of animals. F, Animal-based ratios of input to the two cell types, averaged for each animal (circles), along with the geometric mean and the geometric standard factor (bars). G, Schematic depiction of the cellular connectivity pattern.
Figure 4.
Figure 4.
S1-CT input is stronger to S1-projecting than M1-projecting PO neurons. A, Example traces showing excitatory synaptic responses (top, EPSP; bottom, EPSC) recorded in a POS1-proj neuron, evoked by photostimulation of ChR2-expressing S1-CT axons. B, EPSCs recorded in retrogradely labeled TC neurons. Single photostimuli (blue bars above traces) were used to activate ChR2-expressing axons. Traces represent group-averaged responses (±SEM; gray lines). C, Cell-based group comparison of input to individual neurons (circles). Error bars represent the median input across cells ± m.a.d. The p value for the rank-sum test comparing the two groups is shown, along with the numbers of cells per group. D, Animal-based group comparison of input recorded in the two cell types, averaged for each animal (circles). The p value for the sign test comparing the two groups is shown, along with the number of animals. E, Animal-based ratios of input to the two cell types, averaged for each animal (circles), along with the geometric mean and the geometric standard factor (bars). F, Schematic depiction of the cellular connectivity pattern.
Figure 5.
Figure 5.
S1-PT input is stronger to S1-projecting than M1-projecting PO neurons. A, Schematic (left) of injections of retrograde tracers in S1 and M1, and Cre-dependent AAV-ChR2 in S1, of an Rbp4-Cre mouse. Images (right) are from a coronal slice through the somatosensory nuclei of the thalamus showing retrograde labeling of S1-projecting and M1-projecting neurons (top left), anterograde labeling of axons (top right), and bright-field (bottom left) and merged (bottom right) images. B, Example traces showing excitatory synaptic responses (top, EPSP; bottom, EPSC) recorded in a POS1-proj neuron, evoked by photostimulation of ChR2-expressing S1-PT axons. Inset: responses to trains of stimuli. C, EPSCs recorded in retrogradely labeled TC neurons. Single photostimuli (blue bars above traces) were used to activate ChR2-expressing axons. Traces represent group-averaged responses (±SEM; gray lines). D, Cell-based group comparison of input to individual neurons (circles). Error bars represent the median input across cells ± m.a.d. The p value for the rank-sum test comparing the two groups is shown, along with the numbers of cells per group. E, Animal-based group comparison of input recorded in the two cell types, averaged for each animal (circles). The p value for the sign test comparing the two groups is shown, along with the number of animals. F, Animal-based ratios of input to the two cell types, averaged for each animal (circles), along with the geometric mean and the geometric standard factor (bars). G, Schematic depiction of the cellular connectivity pattern.
Figure 6.
Figure 6.
M1-PT input is stronger to M1-projecting than S1-projecting PO neurons. (A) Schematic (left) of injections of retrograde tracers in S1 and M1, and Cre-dependent AAV-ChR2 in M1, of an Rbp4-Cre mouse. Images (right) are from a coronal slice through the somatosensory nuclei of the thalamus showing retrograde labeling of S1-projecting and M1-projecting neurons (top left), anterograde labeling of axons (top right), and bright-field (bottom left) and merged (bottom right) images. B, Example traces showing excitatory synaptic responses (top, EPSP; bottom, EPSC) recorded in a POM1-proj neuron, evoked by photostimulation of ChR2-expressing M1-PT axons. C, EPSCs recorded in retrogradely labeled TC neurons. Single photostimuli (blue bars above traces) were used to activate ChR2-expressing axons. Traces represent group-averaged responses (±SEM; gray lines). D, Cell-based group comparison of input to individual neurons (circles). Error bars represent the median input across cells ± m.a.d. The p value for the rank-sum test comparing the two groups is shown, along with the numbers of cells per group. E, Animal-based group comparison of input recorded in the two cell types, averaged for each animal (circles). The p value for the sign test comparing the two groups is shown, along with the number of animals. F, Animal-based ratios of input to the two cell types, averaged for each animal (circles), along with the geometric mean and the geometric standard factor (bars). G, Schematic depiction of the cellular connectivity pattern.
Figure 7.
Figure 7.
Schematic of C-T-C circuits in mouse forelimb S1 and M1. Wiring-diagram depictions for relatively strong connections are arranged by cortical cell type (CT in upper row, PT in lower row) and area (S1, M1), with thalamic nuclei stratified by type (matrix-type higher, core-type lower). Relatively weak or absent connections are omitted. Connections for all circuits of S1 and PT circuits of M1 are based on results from this study; other M1 circuit connections are based on previous studies (Yamawaki and Shepherd, 2015; Guo et al., 2018).

Similar articles

Cited by

References

    1. Auffret M, Ravano VL, Rossi GMC, Hankov N, Petersen MFA, Petersen CCH (2018) Optogenetic stimulation of cortex to map evoked whisker movements in awake head-restrained mice. Neuroscience 368:199–213. 10.1016/j.neuroscience.2017.04.004 - DOI - PMC - PubMed
    1. Bortone DS, Olsen SR, Scanziani M (2014) Translaminar inhibitory cells recruited by layer 6 corticothalamic neurons suppress visual cortex. Neuron 82:474–485. 10.1016/j.neuron.2014.02.021 - DOI - PMC - PubMed
    1. Bosch-Bouju C, Hyland BI, Parr-Brownlie LC (2013) Motor thalamus integration of cortical, cerebellar and basal ganglia information: implications for normal and parkinsonian conditions. Frontiers in computational neuroscience 7:163. 10.3389/fncom.2013.00163 - DOI - PMC - PubMed
    1. Bourassa J, Pinault D, Deschênes M (1995) Corticothalamic projections from the cortical barrel field to the somatosensory thalamus in rats: a single-fibre study using biocytin as an anterograde tracer. Eur J Neurosci 7:19–30. 10.1111/j.1460-9568.1995.tb01016.x - DOI - PubMed
    1. Chevée M, Robertson JJ, Cannon GH, Brown SP, Goff LA (2018) Variation in activity state, axonal projection, and position define the transcriptional identity of individual neocortical projection neurons. Cell Rep 22:441–455. 10.1016/j.celrep.2017.12.046 - DOI - PMC - PubMed

Publication types

LinkOut - more resources