. 2020 Mar 27;295(13):4277-4288.
doi: 10.1074/jbc.RA119.012012. Epub 2020 Feb 19.

Molecular and cellular dissection of the oxysterol-binding protein cycle through a fluorescent inhibitor

Affiliations

Molecular and cellular dissection of the oxysterol-binding protein cycle through a fluorescent inhibitor

Tiphaine Péresse et al. J Biol Chem. .

Abstract

ORPphilins are bioactive natural products that strongly and selectively inhibit the growth of some cancer cell lines and are proposed to target intracellular lipid-transfer proteins of the oxysterol-binding protein (OSBP) family. These conserved proteins exchange key lipids, such as cholesterol and phosphatidylinositol 4-phosphate (PI(4)P), between organelle membranes. Among ORPphilins, molecules of the schweinfurthin family interfere with intracellular lipid distribution and metabolism, but their functioning at the molecular level is poorly understood. We report here that cell line sensitivity to schweinfurthin G (SWG) is inversely proportional to cellular OSBP levels. By taking advantage of the intrinsic fluorescence of SWG, we followed its fate in cell cultures and show that its incorporation at the trans-Golgi network depends on cellular abundance of OSBP. Using in vitro membrane reconstitution systems and cellular imaging approaches, we also report that SWG inhibits specifically the lipid transfer activity of OSBP. As a consequence, post-Golgi trafficking, membrane cholesterol levels, and PI(4)P turnover were affected. Finally, using intermolecular FRET analysis, we demonstrate that SWG directly binds to the lipid-binding cavity of OSBP. Collectively these results describe SWG as a specific and intrinsically fluorescent pharmacological tool for dissecting OSBP properties at the cellular and molecular levels. Our findings indicate that SWG binds OSBP with nanomolar affinity, that this binding is sensitive to the membrane environment, and that SWG inhibits the OSBP-catalyzed lipid exchange cycle.

Keywords: Golgi; ORPphilin; OSBP; cholesterol; lipid transport; lipid-transfer protein; phosphoinositide; protein drug interaction; schweinfurthin.


Conflict of interest statement

The authors declare that they have no conflicts of interest with the contents of this article

Figures

Figure 1.
Figure 1.
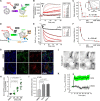
Characterization of SWG sensitivity and effects on TGN trafficking. A, structure of schweinfurthin G (SWG). B, the immunoblot shows the relative level of endogenous OSBP expression in the indicated cell lines. C and D, measurements of cell viability (IC50 values) for the different cell lines treated with SWG (C) or doxorubicin (D) are plotted as a function of the normalized OSBP expression level found in each cell line. E, the sensitivity profile for SWG is plotted as a function of that for doxorubicin for each cell line used. The indicated Pearson's correlation values (r) and p values were determined using SigmaPlot. F, RPE-1 cells cultured for 24 h were treated with DMSO or SWG as indicated. Cells were then fixed, permeabilized, and processed for immunofluorescence to assess the localization of endogenous OSBP and TGN-46. Confocal microscopy images are single optical sections. G, evolution of the Pearson's correlation coefficient between OSBP and TGN-46 upon SWG treatment over time, or DMSO as control. Measurements were performed on 15–25 cells for each condition, from 3 independent experiments with the mean values indicated by the black lines. H, time-lapse imaging of RPE-1 cells stably expressing SBP-EGFP-CD59 incubated with biotin and, as indicated, DMSO or SWG (50 nm), for the indicated time. Real-time images were acquired using a wide-field microscope at 2 frames/min. Temporal projections (right image) were performed on entire stacks of images. I, normalized intensity of SBP-EGFP-CD59 at the Golgi. Data are mean ± S.E. (n = 4). Scale bars, 20 μm.
Figure 2.
Figure 2.
SWG is a potent inhibitor of the OSBP lipid exchange cycle and affects cellular lipid distribution. A, experimental strategy for sterol-transfer assay. B, DHE transfer assay between LE (130 μm) and LG (130 μm) in the presence of OSBP ORD domain (0.2 μm) with increasing amounts of SWG. C, inhibitory effect of SWG on DHE transfer mediated by the OSBP ORD domain. The graph represents normalized rate constants obtained from fitting curves such as in B from three independent experiments, as a function of SWG concentration. The curve is fitted with a quadratic equation, which gives the Ki (see “Experimental procedures”). The inset shows an enlarged view of the curve from the boxed region, and fits for theoretical Ki of 0.1, 1, 3, 10, and 30 nm (dashed lines). D, PI(4)P transfer assay. E, PI(4)P transfer measurement between LG (300 μm) and LE (300 μm) in the presence of NBD-PHFAPP (0.3 μm) and OSBP ORD domain (0.1 μm) with increasing amounts of SWG. F, inhibitory effect of SWG on PI(4)P transfer. Results are mean ± S.E. (n = 3). G, confocal images of RPE-1 stably expressing D4-H-GFP and either treated with SWG (100 nm) or DMSO for 16 h. Thereafter, the cells were fixed and labeled with WGA-Alexa Fluor 350 (plasma membrane marker) and Lysotracker Red (lysosomal marker). H, D4-H-GFP fluorescence intensity ratio (lysosome/PM) from n = 10 measurements for each concentration condition. Significance tested with an unpaired t test. I, cholesteryl ester/cholesterol ratio measured by LC-MS from lipid extracts of RPE-1 treated with SWG (50 nm) or OSW-1 (20 nm) for 2 h. Results are mean ± S.E. (n = 3). J, time-lapse microscopy of RPE-1 stably expressing P4M-SidM-GFP and treated with SWG (50 nm) as indicated. Real-time images were acquired using a wide-field microscope at 2 frames/min. K, time course of P4M-SidM-GFP at the TGN (the specific P4M-SidM-GFP level at the TGN shown is obtained by subtracting the cytosol value from the TGN value). The arrow indicates SWG addition into the cell medium. Data are mean ± S.E. (n = 6).
Figure 3.
Figure 3.
Direct fluorescent imaging of SWG in cells provides evidence of its specificity for OSBP. A, excitation and emission spectra of SWG. B, epifluorescence images of RPE-1 cells labeled with SWG (1 μm) for 30 min in growth medium at 37 °C, fixed, permeabilized, and processed for immunofluorescence to assess the localization of endogenous OSBP and TGN-46. Scale bar: 20 μm. C, SWG fluorescence intensity at the TGN over time. Data are mean ± S.E. (n = 10). D, RPE-1 cells were treated either with control siRNA (siNT) or siRNA against OSBP, then processed as in B. Top, representative epifluorescence images of SWG. Bottom, SWG fluorescence at the TGN as a function of OSBP cellular levels, as determined by immunofluorescence quantification. Measurements were performed on more than 300 cells for each condition. E, top: epifluorescence images of RPE-1 transfected with OSBP-mCherry for 18 h, labeled with SWG (1 μm) for 30 min in the presence of OSW-1 (100 nm) or DMSO as control, then immunolabeled with anti-TGN-46. Bottom: SWG fluorescence intensity at the TGN as a function of OSBP-mCherry expression levels in the presence of the indicated amount of OSW-1. Measurements were performed on 200–325 cells for each condition. F, RPE-1 cells were transfected with ORP4-mCherry for 18 h and treated as in E. G, left: time-lapse microscopy of RPE-1 cells overexpressing OSBP-mCherry, labeled with SWG (1 μm) for 30 min, and treated with OSW-1 or DMSO as indicated. Right, normalized levels of SWG at the TGN. The arrow indicates addition of drugs into the cell medium. Data are mean ± S.E. (n = 3).
Figure 4.
Figure 4.
The fluorescence properties of SWG are influenced by its environment. A, emission spectra of SWG (200 nm) upon excitation at 330 nm in various solvents or in the presence of the indicated amount of detergent in water (green curves). B, emission spectra of SWG (200 nm) in the presence of liposomes (0.1 mg/ml), with or without the addition of ORD (200 nm) or N-PH-FFAT (200 nm) in HKM buffer. The black curve represents the signal obtained with liposomes without SWG. C, homology modeling of the ORD domain of OSBP. Tryptophan residues (represented as spheres) are colored in yellow when close to the lipid-binding cavity. The lid of the ORD is colored in pink. D, spectra analysis upon tryptophan excitation at 280 nm. The protein added was either the ORD (200 nm, left panel) or the N-PH-FFAT construct (200 nm, right panel) in HKM buffer, in the presence of liposomes (0.1 mg/ml), with or without the addition of SWG (200 nm). The dashed curves (asterisk) represent the theoretical sum of the fluorescence values from black and red curves. E, sketch summarizing the effects of the local environment on SWG fluorescence intensity. F, time course of SWG (200 nm) binding into the ORD (200 nm) as measured by FRET (excitation 280 nm; emission 410 nm). When indicated, the reaction was performed in the presence of Thesit® (0.1%, green curve), liposomes (0.1 mg/ml, black curve), or in HKM buffer alone (blue curve). In a control experiment, the ORD was replaced with N-PH-FFAT (200 nm, red curve). G, time course of SWG (200 nm) release from the ORD (200 nm) using OSW-1 (500 nm). The conditions are the same as in F. H, binding of SWG to ORD measured by FRET. The sample initially contained the ORD (200 nm) in Thesit® (0.1%), to which an increasing amount of SWG was added (green dots). When indicated, the initial sample was supplemented with 200 nm OSW-1 (red dots).

Similar articles

Cited by

References

    1. Burgett A. W., Poulsen T. B., Wangkanont K., Anderson D. R., Kikuchi C., Shimada K., Okubo S., Fortner K. C., Mimaki Y., Kuroda M., Murphy J. P., Schwalb D. J., Petrella E. C., Cornella-Taracido I., Schirle M., Tallarico J. A., and Shair M. D. (2011) Natural products reveal cancer cell dependence on oxysterol-binding proteins. Nat. Chem. Biol. 7, 639–647 10.1038/nchembio.625 - DOI - PMC - PubMed
    1. Wong L. H., Čopič A., and Levine T. P. (2017) Advances on the transfer of lipids by lipid transfer proteins. Trends Biochem. Sci. 42, 516–530 10.1016/j.tibs.2017.05.001 - DOI - PMC - PubMed
    1. Kentala H., Weber-Boyvat M., and Olkkonen V. M. (2016) OSBP-related protein family: mediators of lipid transport and signaling at membrane contact sites. Int. Rev. Cell Mol. Biol. 321, 299–340 10.1016/bs.ircmb.2015.09.006 - DOI - PubMed
    1. Antonny B., Bigay J., and Mesmin B. (2018) The oxysterol-binding protein cycle: burning off PI(4)P to transport cholesterol. Annu. Rev. Biochem. 87, 809–837 10.1146/annurev-biochem-061516-044924 - DOI - PubMed
    1. Mesmin B., Bigay J., Moser von Filseck J., Lacas-Gervais S., Drin G., and Antonny B. (2013) A four-step cycle driven by PI(4)P hydrolysis directs sterol/PI(4)P exchange by the ER-Golgi tether OSBP. Cell 155, 830–843 10.1016/j.cell.2013.09.056 - DOI - PubMed

Publication types