. 2020 Apr 16;94(9):e00119-20.
doi: 10.1128/JVI.00119-20. Print 2020 Apr 16.

The African Swine Fever Virus Transcriptome

Affiliations

The African Swine Fever Virus Transcriptome

Gwenny Cackett et al. J Virol. .

Abstract

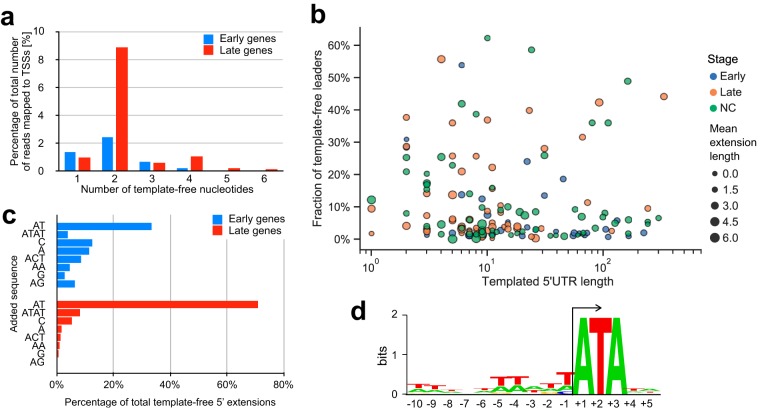
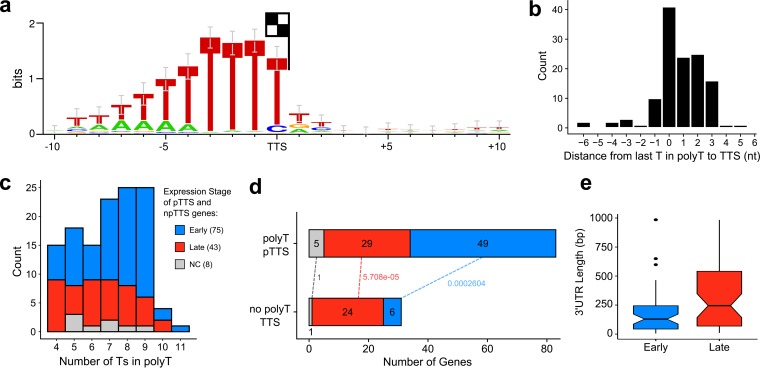
African swine fever virus (ASFV) causes hemorrhagic fever in domestic pigs, presenting the biggest global threat to animal farming in recorded history. Despite the importance of ASFV, little is known about the mechanisms and regulation of ASFV transcription. Using RNA sequencing methods, we have determined total RNA abundance, transcription start sites, and transcription termination sites at single-nucleotide resolution. This allowed us to characterize DNA consensus motifs of early and late ASFV core promoters, as well as a polythymidylate sequence determinant for transcription termination. Our results demonstrate that ASFV utilizes alternative transcription start sites between early and late stages of infection and that ASFV RNA polymerase (RNAP) undergoes promoter-proximal transcript slippage at 5' ends of transcription units, adding quasitemplated AU- and AUAU-5' extensions to mRNAs. Here, we present the first much-needed genome-wide transcriptome study that provides unique insight into ASFV transcription and serves as a resource to aid future functional analyses of ASFV genes which are essential to combat this devastating disease.IMPORTANCE African swine fever virus (ASFV) causes incurable and often lethal hemorrhagic fever in domestic pigs. In 2020, ASF presents an acute and global animal health emergency that has the potential to devastate entire national economies as effective vaccines or antiviral drugs are not currently available (according to the Food and Agriculture Organization of the United Nations). With major outbreaks ongoing in Eastern Europe and Asia, urgent action is needed to advance our knowledge about the fundamental biology of ASFV, including the mechanisms and temporal control of gene expression. A thorough understanding of RNAP and transcription factor function, and of the sequence context of their promoter motifs, as well as accurate knowledge of which genes are expressed when and the amino acid sequence of the encoded proteins, is direly needed for the development of antiviral drugs and vaccines.

Keywords: African swine fever virus; NCLDV; RNA polymerases; RNA-seq; gene expression; promoters; transcription; transcription start site; virology; zoonotic infections.


Figures

FIG 1
FIG 1
Annotated genome of ASFV-BA71V indicating transcription start sites (TSS) and early and late genes. The map includes 153 previously annotated genes as well as novel genes identified in this study and their differential expression patterns from early to late infection from DESeq2 (80) analysis. Early genes (upregulated, highlighted in dark blue) and late genes (upregulated, dark red) were differentially expressed according to both RNA-seq and CAGE-seq approaches. The pale blue and pale red markings indicate negative (early, downregulated) and positive (late, upregulated) log2 fold changes, respectively, in expression levels according to both CAGE-seq and RNA-seq data, but the change is statistically significant (adjusted P value < 0.05) only for data from CAGE-seq due to its higher sequencing depth; unlike RNA-seq, CAGE-seq is not affected by transcription readthrough. Ambivalence of early and late expression patterns (i.e., not statistically significant according to either of the methods or only according to RNA-seq) is also indicated. This group also includes 10 genes with reversed differential expression between CAGE-seq and RNA-seq results. The map was visualized with the R package gggenes.
FIG 2
FIG 2
The ASFV transcriptome including transcription start sites and termination sites. (a) Whole-genome view of normalized coverage counts per million (CPM) of RNA-seq, 5′ CAGE-seq, and 3′ RNA-seq reads. The coverage was capped at 16,000 counts per million. A total of 153 BA71V annotated ORFs are represented as arrows and colored according to strand. Peak cluster shape examples are from F1055L 5′ CAGE-seq ends (b) and 3′ RNA-seq ends (c), showing a wide multipeaked distribution, and from J64R 5′ CAGE-seq (d) and 3′ RNA-seq (e), showing a narrow peak distribution.
FIG 3
FIG 3
Transcriptome mapping aids the reannotation of the ASFV BA71V genome. (a) A summary bar graph (left) shows CAGEfightR TSS clusters and their locations relative to the 153 annotated BA71V ORFs. Types of CAGEfightR clusters detected and the distribution of their respective CAGEfightR scores are shown on the right. (b) Two examples of ORFs requiring reannotation following pTSS identification downstream of annotated start codon, encoding shorter ORFs from the pTSS (I177L, above) or during one expression stage (B169L, below). (c) Examples of two putative novel genes (pNG3 and pNG1) annotated with the normalized RNA-seq and CAGE-seq read coverage (counts per million [CPM]) and their genome neighborhood.
FIG 4
FIG 4
Analysis of alternative pTSS usage in I243L. (a) Close-up of TSSs (CAGE-seq alignments) on the minus strand at the start of the I243L ORF. Symbols indicate the TSS sites for early (▼), intermediate (•), and late (▽) gene expression according to Rodríguez et al. (26), while E, I, and L indicate, respectively, early, intermediate, and late gene pTSS positions concluded from our data. The first 21 aa residues of the annotated I243L ORF are shown; in yellow is the reannotated ORF which could be encoded in transcripts initiating from both of our annotated early pTSSs. (b) ClustalW multiple-sequence alignment colored by percentage identity between sequences at the same position from white (0%) to blue (100%), according to their agreement with the consensus sequence found below the alignment ('+' indicates positions where more than one residue is found in the modal consensus), illustrated with Jalview (84), of TFIIS homologues from ASFV (I243L; NCBI accession no. P27948), Arabidopsis thaliana (Q9ZVH8), Drosophila melanogaster (P20232), human (P23193), mouse (P10711), and Saccharomyces cerevisiae (P07273). S. cerevisiae TFIIS domain locations according to Kettenberger et al. (85) are shown below the alignment, and acidic (DE) catalytic residues are in domain III. ASFV-TFIIS start codons encoded from alternative transcription start sites are labeled as in panel a.
FIG 5
FIG 5
Gene expression of ASFV genes during early and late infection. (a) Fragments per million (FPM) values for 20 most highly expressed ASFV TUs according to CAGE-seq at 5 h (left) and 16 h (right) postinfection. Genes highlighted in dark pink indicate those encoding proteins which were also found in the 20 most abundantly expressed ASFV proteins during infection of either WSL-HP, HEK293, or Vero cells according to proteome analysis done by Keßler et al. (37). Gene functions are shown after the gene name with TR and PSP referring to predicted transmembrane region and putative signal peptide, respectively. (b) The 20 most expressed genes during early (green) and late (blue) infection according to RNA-seq data over gene TU, defined from TSS to ORF stop codon. (c) MAplot from DESeq2 analysis of CAGE-seq representing the DESeq2 baseMean counts of transcript levels versus their log2 fold change, with significantly differentially expressed genes in pink (adjusted P value of <0.05). (d) MAplot representing expression of ASFV TUs including pNGs from DESeq2 analysis of RNA-seq data.
FIG 6
FIG 6
Relative expression during infection stages and defining early and late genes. (a) Box plot mean FPM values for the early and late genes at early and late infection, respectively. Outliers are labeled with their gene names. Wilcoxon rank sum tests showed that the mean FPM values of early genes during early infection was significantly greater than that of late genes during late infection (P value of 1.865e−06). (b and c) Distribution of the least and most expressed genes during early and late infection. Genes in the 15th percentile for their mean FPM values from each time point represent those below an early FPM threshold of 7.56 (blue) and late FPM of 199.64 (red). Genes in the 85th percentile for their mean FPM values from each time point represent those above an early FPM threshold of 8148.91 (blue) and late FPM of 4706.27 (red). In dark blue and dark red are medians for the plotted expression values for early and late infection, respectively. (d) Scatter plot comparing log2 fold changes of the 101 significantly differentially expressed genes in common between RNA-seq and CAGE-seq data. Labels were colored according to their significant upregulation or downregulation from RNA-seq data. (e) Pie charts of gene functional categories downregulated from 5 h to 16 h (36 early genes) and upregulated from 5 h to 16 h (55 late genes). Fisher’s test was carried out on gene counts for functional groups between early and late infection; for this all MGF members were pooled into the MGFs functional group.
FIG 7
FIG 7
Initiator and promoter sequence signatures of ASFV genes. (a and b) WebLogo 3 (86, 87) of aligned early and late sequences, respectively, surrounding the Inr (+1) from −35 to +10, with gradients representing the base pair conservation of the EPM (blue-white), Inr (purple-white), and LPM (peach-white). (c and d) WebLogo 3 consensus motif with error bars of the 36 early and 55 late gene sequences, respectively, surrounding their respective pTSSs (5 nt up- and downstream), i.e., initiator (Inr) motif. (e) EPM located upstream of all 36 of our classified early genes according to MEME motif search (E value, 8.2e−021); FIMO with a threshold P value of <1.0e−4 then identified at least one iteration of this motif upstream of 81 ASFV genes. (f) Distances of the EPM motif 3′ end (nt 19) relative to those of the 78 pTSSs (alternative pTSSs excluded) (4). (g) Expression profiles from DESeq2 analysis (log2 fold change versus DESeq2 basemean expression) of genes with only an EPM from the FIMO search of 60 bp upstream of pTSSs. Genes for which FIMO detected both EPM and LPM upstream of pTSSs were excluded. Genes shown in blue demonstrated a negative log2 fold change (early genes), and those shown in red demonstrated a positive log2 fold change (regardless of significance). (h) Expression profiles as described for panel g for the 26 MGFs where an EPM was detected upstream. (i) Distances of the EPM motif 3′ end (nt 19) relative to those of the MGF pTSSs.
FIG 8
FIG 8
Promoter motif upstream of ASFV late genes. (a) The LPM detected upstream of 17 of our classified late genes from a MEME motif search (E value, 1.6e−003). (b) Distances from a FIMO search (threshold P value of <1.0e−4) identified the LPM upstream of 53 ASFV genes (excluding those with alternative pTSSs). Motif distances from pTSSs are represented. (c) Expression profiles as in Fig. 7g and h of genes with only an LPM from the FIMO search of 60 bp upstream of pTSSs. (d) The eukaryotic TATA box motif which was one of 28 hits in a TomTom search of the LPM. (e) 5′ UTR lengths in nucleotides of the 91 early (mean, 39; median, 14) or late (mean, 25; median, 9) classified ASFV genes, starting from the most upstream pTSS (in the case of alternating pTSSs) until the first ATG start codon nucleotide, represented. Nine genes with 5′ UTRs above 80 nt were excluded from the box plot: QP509L (92 nt long), pNG2 (105 nt), I267L (110 nt), B318L (118 nt), C44L (131 nt), DP141L (165 nt), pNG1 (223 nt), EP402R (242 nt), and A118R (332 nt). (f) Percentage AT content of early (mean, 69.0 %; median, 70.9%) and late (mean, 81.7%; median, 83.3%) 5′ UTRs, omitting those of 0 length.
FIG 9
FIG 9
Investigating ASFV-RNAP slippage. (a) Frequency of different lengths of template-free extensions in early- and late-stage samples. (b) Relationship between the length of templated 5′ UTRs and fraction of template-free extensions. Gene 5′ UTRs were split into 36 early (blue), 55 late (orange), and not classified (NC, green) groups. (c) Frequency of most common template-free extensions in the early- and late-stage samples. (d) Sequence logo of region surrounding TSSs of AU- and AUAU-extended transcripts.
FIG 10
FIG 10
ASFV transcription termination. (a) WebLogo 3 motif of 10 nt upstream and 10 downstream of all pTTS and npTTSs with a poly(T) upstream with ≥4 consecutive Ts, based on 126 TTSs. (b) Distance from 3′ terminal T in poly(T) motif to the TTS (median). (c) The distribution of poly(T) lengths among 126 poly(T) TTSs (median, 7), split into expression stages according to CAGE-seq differential expression analysis (NC, not classified), showing that late gene poly(T)s are shorter (Wilcoxon rank sum test, P value of 0.0216). (d) Distribution of gene expression types among the 83 poly(T) pTTSs and 31 non-poly(T) pTTSs. Labels on dotted lines indicate Fisher’s test P values of gene types between the two pTTS types, classified from CAGE-seq data. (e) Lengths of 55 early and 53 late gene 3′ UTRs from the stop codon to pTTS (Wilcoxon rank sum test, P value of 0.003).

References

    1. Alonso C, Borca M, Dixon L, Revilla Y, Rodriguez F, Escribano JM, Consortium IR. 2018. ICTV virus taxonomy profile: Asfarviridae. J Gen Virol 99:613–614. doi:10.1099/jgv.0.001049. - DOI - PubMed
    1. Koonin EV, Yutin N. 2010. Origin and evolution of eukaryotic large nucleo-cytoplasmic DNA viruses. Intervirology 53:284–292. doi:10.1159/000312913. - DOI - PMC - PubMed
    1. Yutin N, Koonin EV. 2012. Hidden evolutionary complexity of nucleo-cytoplasmic large DNA viruses of eukaryotes. Virol J 9:161. doi:10.1186/1743-422X-9-161. - DOI - PMC - PubMed
    1. Reteno DG, Benamar S, Khalil JB, Andreani J, Armstrong N, Klose T, Rossmann M, Colson P, Raoult D, La Scola B. 2015. Faustovirus, an asfarvirus-related new lineage of giant viruses infecting amoebae. J Virol 89:6585–6594. doi:10.1128/JVI.00115-15. - DOI - PMC - PubMed
    1. Gogin A, Gerasimov V, Malogolovkin A, Kolbasov D. 2013. African swine fever in the North Caucasus region and the Russian Federation in years 2007–2012. Virus Res 173:198–203. doi:10.1016/j.virusres.2012.12.007. - DOI - PubMed

Publication types

MeSH terms

LinkOut - more resources