. 2020 Feb 19;11(1):960.
doi: 10.1038/s41467-020-14518-3.

A molecular gradient along the longitudinal axis of the human hippocampus informs large-scale behavioral systems

Affiliations

A molecular gradient along the longitudinal axis of the human hippocampus informs large-scale behavioral systems

Jacob W Vogel et al. Nat Commun. .

Abstract

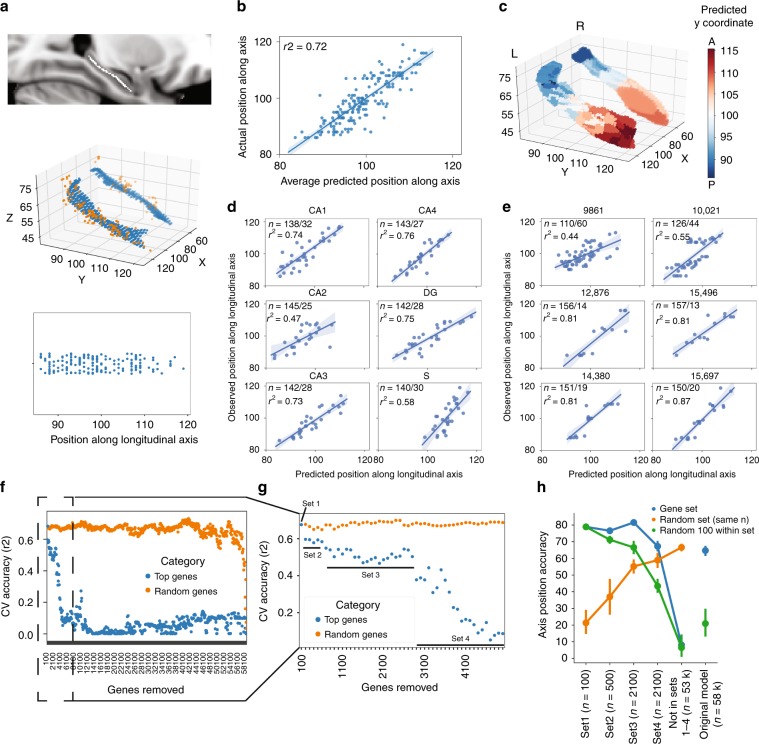
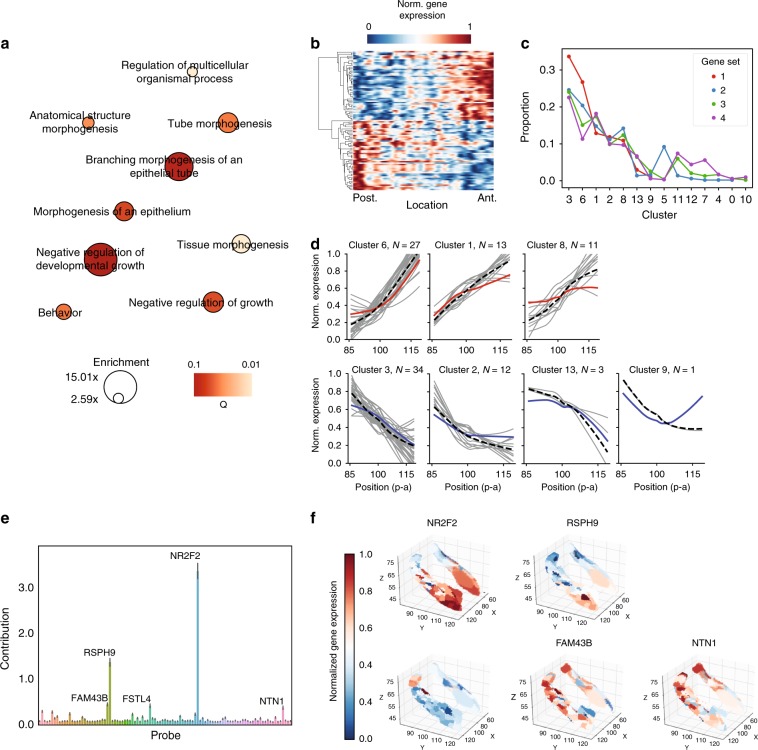
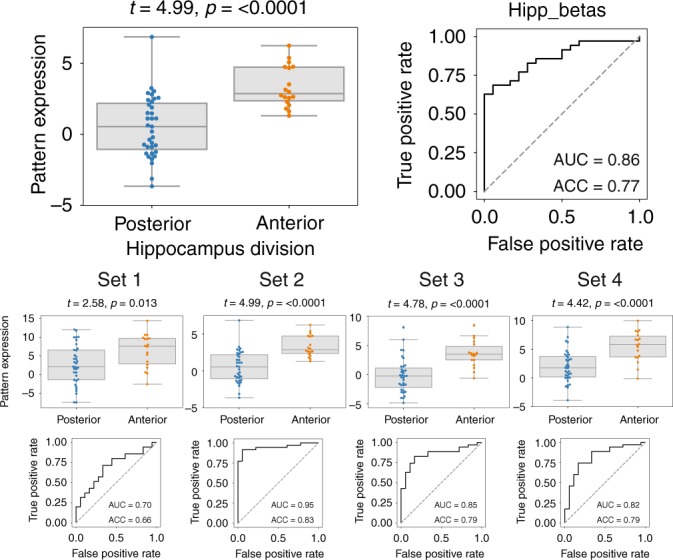
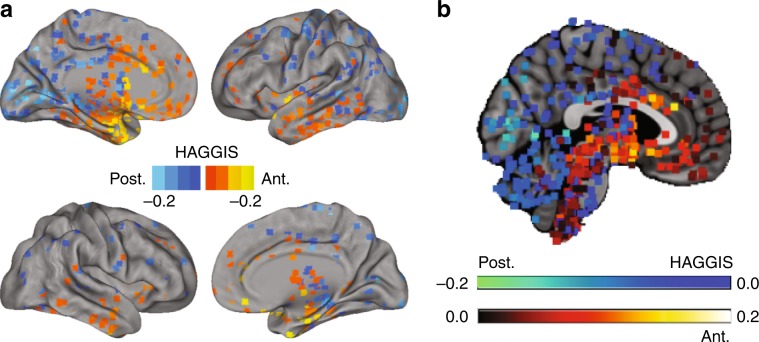
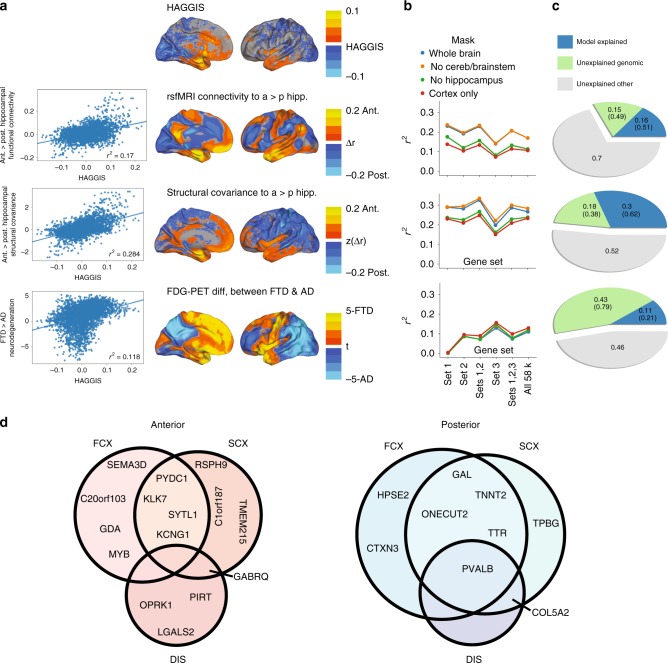
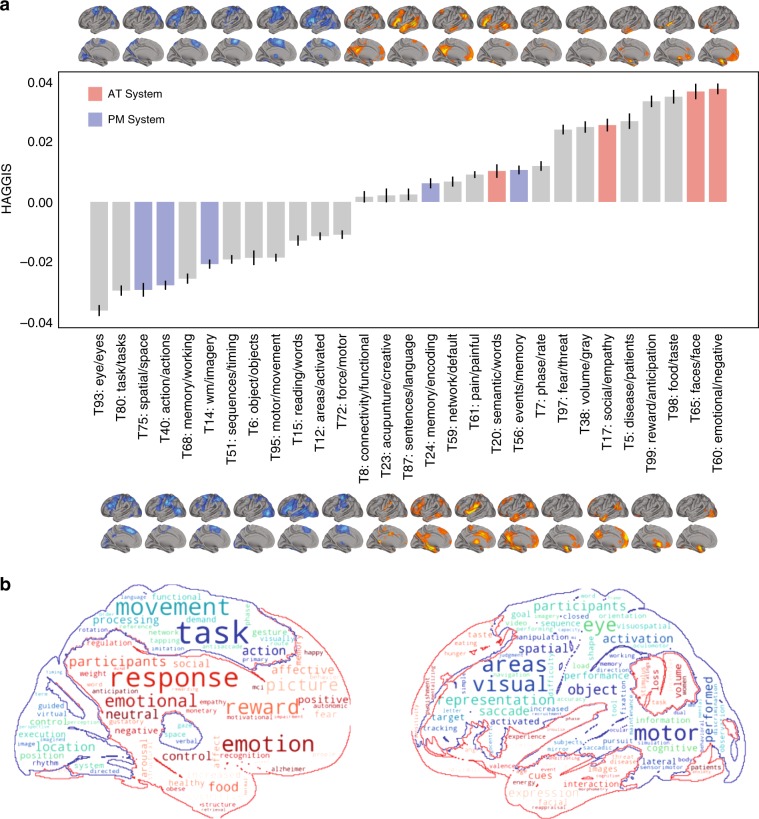
The functional organization of the hippocampus is distributed as a gradient along its longitudinal axis that explains its differential interaction with diverse brain systems. We show that the location of human tissue samples extracted along the longitudinal axis of the adult human hippocampus can be predicted within 2mm using the expression pattern of less than 100 genes. Futhermore, this model generalizes to an external set of tissue samples from prenatal human hippocampi. We examine variation in this specific gene expression pattern across the whole brain, finding a distinct anterioventral-posteriodorsal gradient. We find frontal and anterior temporal regions involved in social and motivational behaviors, and more functionally connected to the anterior hippocampus, to be clearly differentiated from posterior parieto-occipital regions involved in visuospatial cognition and more functionally connected to the posterior hippocampus. These findings place the human hippocampus at the interface of two major brain systems defined by a single molecular gradient.


Conflict of interest statement

The authors declare no competing interests.

Figures

Fig. 1
Fig. 1. Gene expression predicts the location of tissue samples along the long axis of the hippocampus.
a (top) A curved skeleton of voxels was fitted along the center of mass of the hippocampal volume. (middle) Tissue samples (orange) were matched to the closest skeleton voxels (blue). (bottom) A sample's position along the longitudinal axis was represented as the y-axis coordinate of the sample's matched skeleton-voxel. b Average predicted sample position (using gene expression) across ten separate 10-fold cross-validated LASSO-PCR models, compared to the actual position. c Render of the hippocampal surface where each vertex shows the predicted location of the closest (surface projected) sample to that vertex. The smooth appearance of the right hippocampus is related to the fact that less samples were available for this structure. d Predicted vs. observed sample locations for leave-one-subfield-out models. For example, subpanel CA1 shows the predicted vs. observed position of samples extracted from CA1 (test set) when the model was trained without CA1 samples (training set). In each plot, N represents the number of samples in the training and test sets. e Predicted vs. observed sample locations for leave-one-donor-out models. f The 100 most important probes in the LASSO-PCR model were iteratively removed and, after each removal, 10-fold cross-validation accuracy predicting sample position along the longitudinal axis was recorded (blue dots). As a control, the same process was repeated but removing 100 random probes (orange). g The first 50 rounds of 100-probe removal from Panel F. Inflection points were identified after removing 100, 600, and 2700 genes. h Accuracy in predicting sample position was recorded for models using different gene sets identified by the inflection points in panel G (blue), samples of 100 random within-set probes (green), and samples of random probes (orange) as input. Each model was run ten times with different bootstrap samples to calculate confidence intervals (represented by error bars).
Fig. 2
Fig. 2. Candidate genes associated with the longitudinal axis of the human hippocampus.
a Enriched Gene Ontology terms (Q < 0.1) associated with Gene Set 1. Circle size indicates enrichment, whereas color indicates Q value (lighter = lower Q value). b Matrix showing gene expression for probes in Gene Set 1 (y-axis) across each hippocampal sample, ordered most posterior to most anterior (x-axis). Values were smoothed with a 3 mm gaussian kernel across the x-dimension only and then clustered so that anterior–posterior patterns can be clearly visualized. c Relative proportion of features belonging to each expression pattern cluster, for each Gene Set. d Each subpanel represents an expression pattern cluster, and the subpanel heading includes the number of probes from Set 1 assigned to that cluster. For each cluster, the posterior-anterior normalized expression pattern is shown for each Gene Set 1 feature belonging to that cluster (gray), the mean of Set 1 features belonging to that cluster (black dashed), and the mean of features across all sets belonging to that cluster (colored). e Average absolute local feature importances (and by extension, model contribution) of probes in Gene Set 1 measured using a Random Forest-based feature explainer across all samples. Error bars = standard error of mean. f Surface rendering of the expression patterns of each of the five genes identified as locally important features to predicting position along the longitudinal axis.
Fig. 3
Fig. 3. Model trained on adult hippocampus predicts location of samples from prenatal hippocampus.
The pattern of gene expression used to predict the location of adult hippocampus samples along the longitudinal axis were applied to samples extracted from the prenatal human hippocampus. Boxplots compare this normalized pattern of expression between samples extracted from the rostral and caudal hippocampus. Statistics are calculated using t-tests. ROC curves were generated using logistic regression. The top figures correspond to models fit using all features, whereas the bottom figures correspond to models fit using the smaller gene sets. ACC Accuracy. AUC Area Under the Curve. For boxplots, the center line, boxes and whiskers represent the median, inner quartiles, and rest of the data distribution (except outliers), respectively.
Fig. 4
Fig. 4. Spatial distribution of the HAGGIS across the brain.
a Each sample was projected onto a cortical surface based on its MNI coordinates. Warm colors indicate the sample has a gene expression pattern more similar to the anterior hippocampus (higher HAGGIS), while cool colors represent the sample is more genomically similar to the posterior hippocampus (lower HAGGIS). b A medial slice inclusive of brainstem and cerebellum. Each dot represents a sample, and warm colors indicate higher HAGGIS, while cool colors represent lower HAGGIS. HAGGIS Hippocampal Axis Genomic Gradient Index of Similarity.
Fig. 5
Fig. 5. HAGGIS predicts hippocampus–brain relationships.
a From top to bottom: The spatial distribution of (smoothed) HAGGIS across samples, differential functional connectivity to the anterior vs. posterior hippocampus measured with rsfMRI, differential structural covariance with the anterior vs. posterior hippocampus, differential vulnerability to AD or FTD measured with FDG-PET. Graphs on the left visualize the relationship between these spatial patterns by comparing the HAGGIS of each sample with the mean value from the respective map within a 5-voxel cube around the sample coordinate. b Each of the above associations was re-calculated using three other brain masks, and using a HAGGIS formed from each gene set identified in the section (genes associated with the long axis of the human hippocampus in Results). The r2 of each of these associations is visualized. c Pie charts indicating the proportion of genomic and total variance explained by each model. Numbers in parentheses indicate percentage of total genomic variance. d Genes involved in both the longitudinal axis of the hippocampus, and hippocampus–brain interactions. All genes pictured are among the top 50 anterior (red; left) or posterior (blue; right) features of the hippocampus longitudinal axis model. Each also participates in one or more hippocampus–brain interactions, indicated by the circles within the Venn diagrams. FCX Differential functional connectivity between anterior and posterior hippocampus; SCX Differential structural covariance between anterior and posterior hippocampus; DIS Differential vulnerability between AD and FTD.
Fig. 6
Fig. 6. Variation in genomic signature predicts involvement in distributed cognitive networks.
a Maps were downloaded from neurosynth representing greater than chance meta-analytic functional activation in studies with different topic-sets mentioned in their text. Mean HAGGIS (represented by bars) was calculated for samples inside maps encompassing  >500 samples (visualized either directly above or directly below each bar). Error bars represent standard deviation. Topics hypothesized to belong to the AT or PM system are shown in red and blue respectively. b A word cloud summarizing the regions and topics most associated with the genomic signal of the anterior (red) and posterior (blue) hippocampus. Larger words are more associated with networks with higher (red) or lower (blue) HAGGIS.

References

    1. Andersen, P., Morris, R., Amaral, D., Bliss, T. and O’Keefe, J. The Hippocampus Book (Oxford University Press, 2006) 10.1093/acprof:oso/9780195100273.001.0001/acprof-9780195100273.
    1. Bienkowski MS, et al. Integration of gene expression and brain-wide connectivity reveals the multiscale organization of mouse hippocampal networks. Nat. Neurosci. 2018;21:1628–1643. doi: 10.1038/s41593-018-0241-y. - DOI - PMC - PubMed
    1. Strange BA, Witter MP, Lein ES, Moser EI. Functional organization of the hippocampal longitudinal axis. Nat. Rev. Neurosci. 2014;15:655–669. doi: 10.1038/nrn3785. - DOI - PubMed
    1. Fanselow MS, Dong H-w. Review are the dorsal and ventral hippocampus functionally distinct structures? Neuron. 2010;65:7–19. doi: 10.1016/j.neuron.2009.11.031. - DOI - PMC - PubMed
    1. Poppenk J, Evensmoen HR, Moscovitch M, Nadel L. Long-axis specialization of the human hippocampus. Trends Cogn. Sci. 2013;17:230–240. doi: 10.1016/j.tics.2013.03.005. - DOI - PubMed

Publication types

MeSH terms