. 2020 Feb 19;11(1):955.
doi: 10.1038/s41467-020-14561-0.

Cellular deconvolution of GTEx tissues powers discovery of disease and cell-type associated regulatory variants

Affiliations

Cellular deconvolution of GTEx tissues powers discovery of disease and cell-type associated regulatory variants

Margaret K R Donovan et al. Nat Commun. .

Erratum in

Abstract

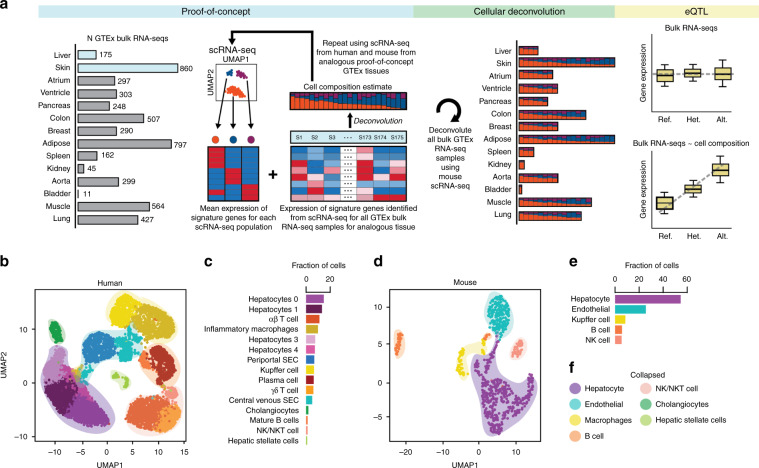
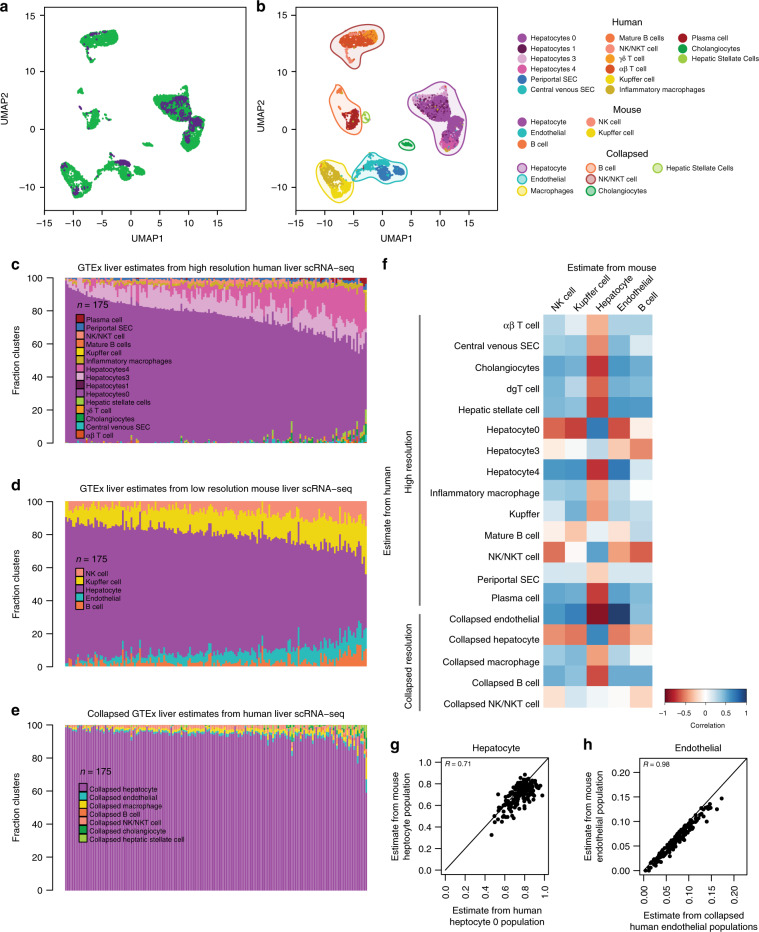
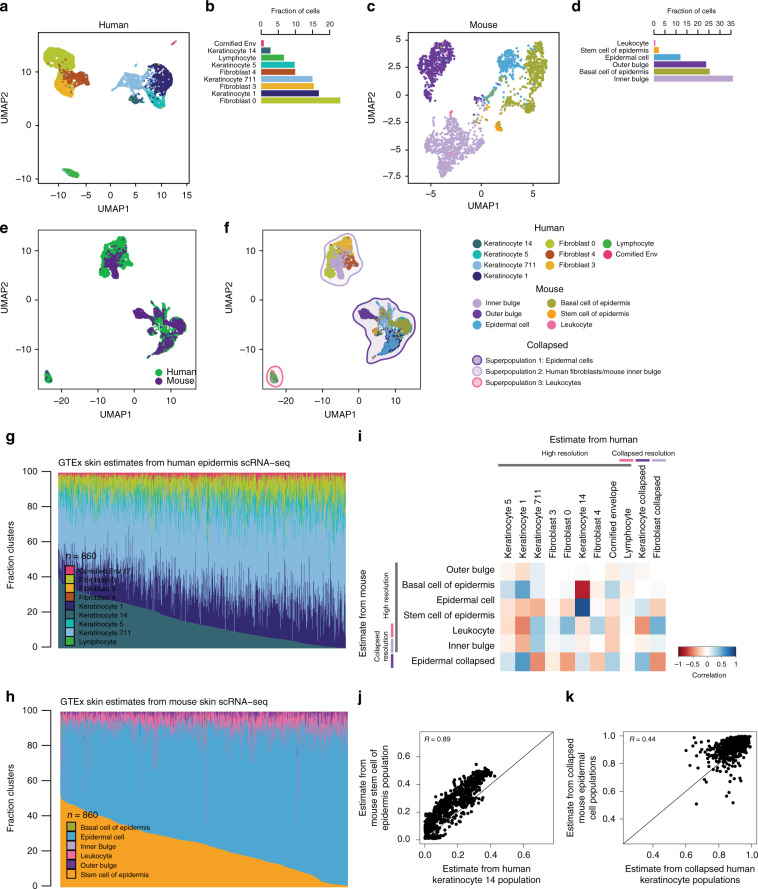
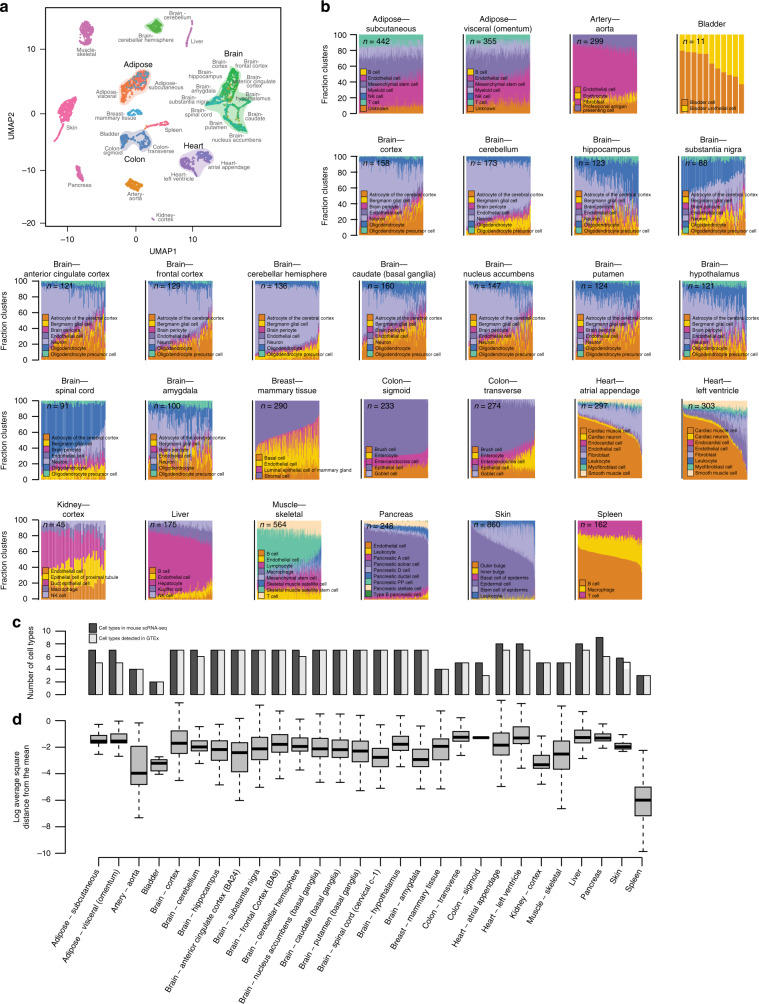
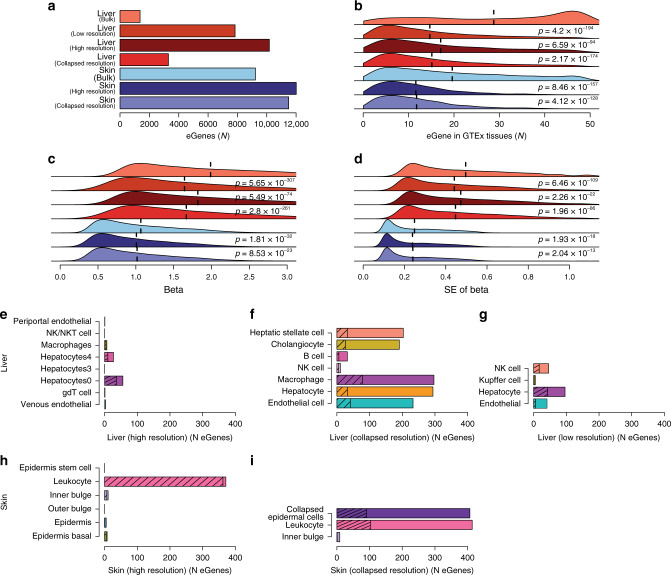
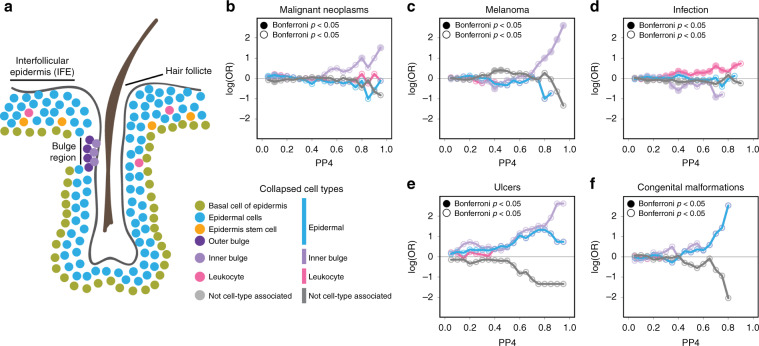
The Genotype-Tissue Expression (GTEx) resource has provided insights into the regulatory impact of genetic variation on gene expression across human tissues; however, thus far has not considered how variation acts at the resolution of the different cell types. Here, using gene expression signatures obtained from mouse cell types, we deconvolute bulk RNA-seq samples from 28 GTEx tissues to quantify cellular composition, which reveals striking heterogeneity across these samples. Conducting eQTL analyses for GTEx liver and skin samples using cell composition estimates as interaction terms, we identify thousands of genetic associations that are cell-type-associated. The skin cell-type associated eQTLs colocalize with skin diseases, indicating that variants which influence gene expression in distinct skin cell types play important roles in traits and disease. Our study provides a framework to estimate the cellular composition of GTEx tissues enabling the functional characterization of human genetic variation that impacts gene expression in cell-type-specific manners.


Conflict of interest statement

The authors declare no competing interests.

Figures

Fig. 1
Fig. 1. Human and mouse liver scRNA-seq contains similar cell types.
a Overview of the study design, which was to deconvolute the cellular composition of 28 GTEx tissues from 14 organs using mouse scRNA-seq to identify cell-type-associated eQTLs. We first conducted proof-of-concept analyses, where we compared cellular estimates of two proof-of-concept GTEx tissues (liver and skin) deconvoluted using both mouse and human signature genes obtained from scRNA-seq. We then performed cellular deconvolution of the 28 GTEx tissues from 14 organs using CIBERSORT and characterized both the heterogeneity in cellular composition between tissues and the heterogeneity in relative distributions of cell populations between RNA-seq samples from a given tissue. Finally, we used the cell type composition estimates as interaction terms for eQTL analyses to determine if we could detect cell-type-associated genetic associations. b UMAP plot of clustered scRNA-seq data from human liver. Each point represents a single cell and color coding of cell type populations are shown adjacent c. Similar cell types can be collapsed to single cell type classifications and are noted with colored, transparent shading f. c Bar plots showing the fraction of each cell type from human liver scRNA-seq data. Color-coding of cell types correspond to the colors of the single cells in b. d UMAP plot of clustered scRNA-seq data from mouse liver. Each point represents a single cell and color coding of cell type populations are shown adjacent e. Each cell type has a corresponding collapsed cell type in human liver and is noted with colored, transparent shading f. e Bar plots showing the fraction of each cell type from mouse liver scRNA-seq data. Color-coding of cell types correspond to the colors of the single cells in d. f showing the colors of collapsed similar cell types from human liver (transparent shading in UMAP b, d; Supplementary Table 2). All cell types from mouse liver have a corresponding collapsed cell type in human liver (hepatocyte, endothelial, macrophages, B cell, NK/NKT cell) and human liver also contains two additional cell types not present in mouse (cholangiocytes and hepatic stellate cells).
Fig. 2
Fig. 2. Comparison of GTEx liver cell estimates using mouse versus human signature gene.
a UMAP plot of integrated scRNA-seq data from human and mouse liver. Each point represents a single cell and color coding of cells indicates the species the cells were obtained from (human = green; mouse = purple). b UMAP plot of integrated scRNA-seq data from human and mouse liver. Each point represents a single cell and color coding of cell type populations are shown in the adjacent legend. The collapsed populations are the same as those shown in Fig. 1f. ce Bar plots showing the fraction of cell types estimated in the 175 GTEx liver RNA-seq samples deconvoluted using gene expression profiles from high-resolution human liver scRNA-seq c, low-resolution mouse liver scRNA-seq d, and GTEx estimates generated by collapsing high-resolution human cell types within each of the seven distinct cell classes e. f Heatmap showing the correlation of GTEx liver cell population estimates from human liver scRNA-seq at high and collapsed resolutions (rows) and mouse liver (columns) at low resolution. Color coding of heatmap scales from red, indicating negative correlation in estimates, to blue, indicating positive correlation in estimates. Most correlations were significant (p-values are reported in Supplementary Data 2A). g, h Scatter plots of estimated cell compositions across 175 GTEx livers deconvoluted using human scRNA-seq for human hepatocyte 0 population d and human collapsed endothelial cells e versus estimated cell populations deconvoluted using mouse scRNA-seq.
Fig. 3
Fig. 3. Comparison of GTEx skin cell estimates using mouse versus human signature genes.
a UMAP plot of clustered scRNA-seq data from human epidermis. Each point represents a single cell and color coding of cell type populations are shown adjacent b. b Bar plots showing the fraction of each cell type from the scRNA-seq data from human epidermis. Color-coding of cell types correspond to the colors of the single cells in a. c UMAP plot of clustered scRNA-seq data from mouse skin. Each point represents a single cell and color coding of cell type populations are shown adjacent in d. d Bar plots showing the fraction of each cell type from the scRNA-seq data from mouse skin. Color-coding of cell types correspond to the colors of the single cells in c. e UMAP plot of integrated scRNA-seq data from human epidermis and mouse skin. Each point represents a single cell and color coding of cells indicates the species the cells were obtained from (human = green; mouse = purple). f UMAP plot of integrated scRNA-seq data from human epidermis and mouse skin. Each point represents a single cell and color coding of cell type populations and collapsed superpopulations are shown in the adjacent legend. g, h Bar plots showing the fraction of cell types estimated in GTEx skin RNA-seq samples from human epidermis scRNA-seq g and mouse skin scRNA-seq h. i Heatmap showing the correlation of GTEx skin cell population estimates from mouse skin scRNA-seq at high and collapsed resolutions (rows) and human skin (columns). Color coding of heatmap scales from red, indicating negative and low correlation in estimates, to blue, indicating positive and high correlation in estimates. Most correlations were significant (p-values are reported in Supplementary Data 2B). j, k Scatter plots of estimated cell compositions across 860 GTEx skin samples deconvoluted using human scRNA-seq for human keratinocyte 14 population versus mouse stem cell of epidermis population j and keratinocyte 1, 5, 14, 711 population versus collapsed mouse epidermal cell populations k.
Fig. 4
Fig. 4. Cellular deconvolution of 28 GTEx tissues.
a UMAP using the expression of all scRNA-seq-derived signature genes across the 28 GTEx tissues. b Stacked bar plots showing the fraction of cell types estimated in GTEx RNA-seq samples from mouse scRNA-seq. A colorblind-friendly version of this figure is shown in Supplementary Fig. 5. c Bar plots comparing the number of cell types discovered in mouse scRNA-seq (light gray) vs. the number of these cell types that were estimable for each GTEx tissue. d Box plots showing per RNA-seq sample the distribution of the log2 average square distance from the mean estimated cellular compositions for each GTEx tissue. The thick, black line indicates the median and the dashed lines indicate the bounds of the upper and lower whiskers.
Fig. 5
Fig. 5. Using cellular deconvolution to discover cell-type-associated eQTLs.
a Bar plot showing the number of eGenes detected in each eQTL analysis from liver (shades of red) and skin (shades of blue). bd Distributions of b number of GTEx tissues where each eGene has significant eQTLs, c effect size β, and d standard error of β in liver and skin. Colors are as in panel a. Vertical dashed lines represent mean values. p-values were calculated in comparison with the bulk resolution analysis for each tissue using Mann–Whitney U test. ei Bar plots showing the number of eGenes significantly associated with each cell population considering cell estimates for: liver high resolution e, liver collapsed resolution f, liver low resolution g, skin high resolution h, and skin collapsed resolution i. Total number of eGenes for each cell type indicates the cell type is significantly associated and the hashed number of eGenes for each cell type indicates the association is cell-type-specific (e.g. only significant in that cell type). In cases where a given cell type had no significant association, the bar is not shown.
Fig. 6
Fig. 6. Colocalization of cell-type-associated skin eQTLs with skin GWAS traits.
a Cartoon describing the approximate organization of cell types identified in scRNA-seq from skin. Colors used for each cell type are used throughout figure and described in the adjacent legend. bf Line plots showing the enrichment of cell-type-associated eQTLs in various GWAS traits: malignant neoplasms c, melanoma d, infection e, ulcers f, and congenital malformations g. Enrichment is plotted as the log(OR) (y-axis) over all probabilities of the eQTL signal overlapping (0 = not overlapping–1 = completely overlapping) with the GWAS signal (x-axis). Lines are colored following color coding of each cell type from Fig. 5a.

References

    1. Consortium GT, et al. Genetic effects on gene expression across human tissues. Nature. 2017;550:204–213. doi: 10.1038/nature24277. - DOI - PMC - PubMed
    1. Glastonbury CA, Couto Alves A, El-Sayed Moustafa JS, Small KS. Cell-type heterogeneity in adipose tissue is associated with complex traits and reveals disease-relevant cell-specific eQTLs. Am. J. Hum. Genet. 2019;104:1013–1024. doi: 10.1016/j.ajhg.2019.03.025. - DOI - PMC - PubMed
    1. Newman AM, et al. Robust enumeration of cell subsets from tissue expression profiles. Nat. Methods. 2015;12:453–457. doi: 10.1038/nmeth.3337. - DOI - PMC - PubMed
    1. Zhong Y, Wan YW, Pang K, Chow LM, Liu Z. Digital sorting of complex tissues for cell type-specific gene expression profiles. BMC Bioinforma. 2013;14:89. doi: 10.1186/1471-2105-14-89. - DOI - PMC - PubMed
    1. Baron M, et al. A. Cell Syst. 2016;3:346–360 e344. doi: 10.1016/j.cels.2016.08.011. - DOI - PMC - PubMed

Publication types