. 2020 Feb 19;11(1):951.
doi: 10.1038/s41467-020-14562-z.

Predicting clinical benefit of immunotherapy by antigenic or functional mutations affecting tumour immunogenicity

Affiliations

Predicting clinical benefit of immunotherapy by antigenic or functional mutations affecting tumour immunogenicity

Kwoneel Kim et al. Nat Commun. .

Abstract

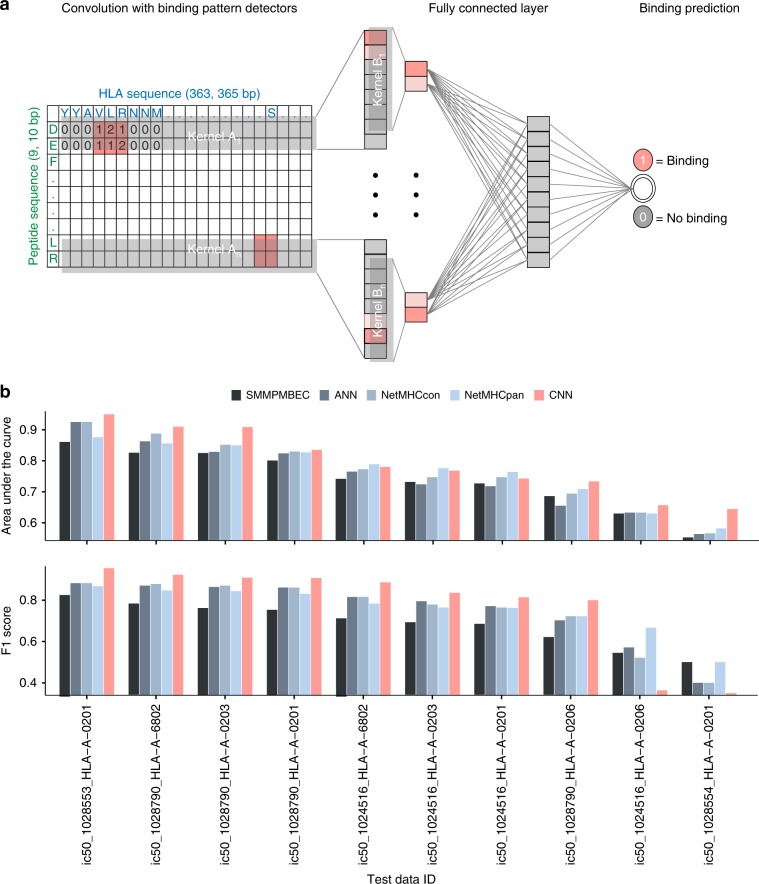
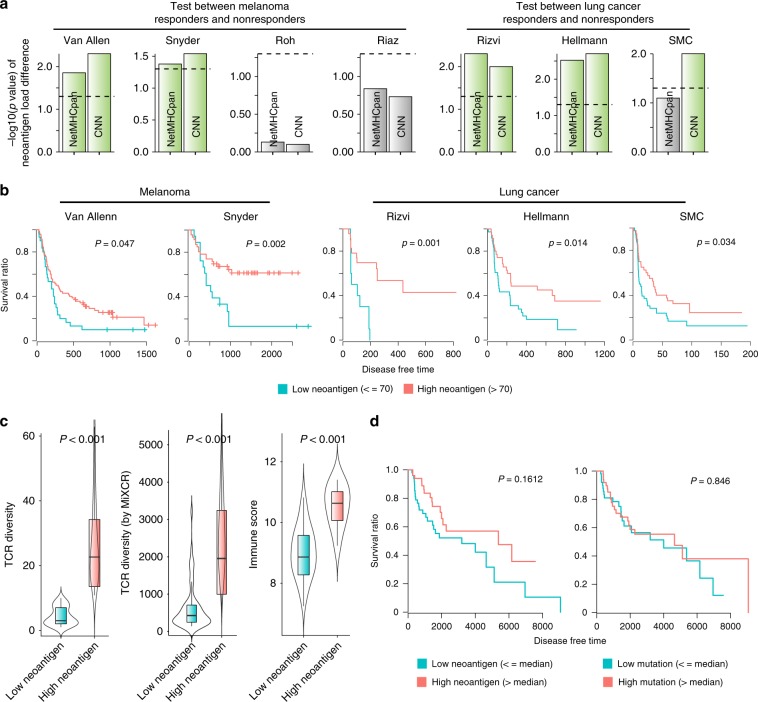
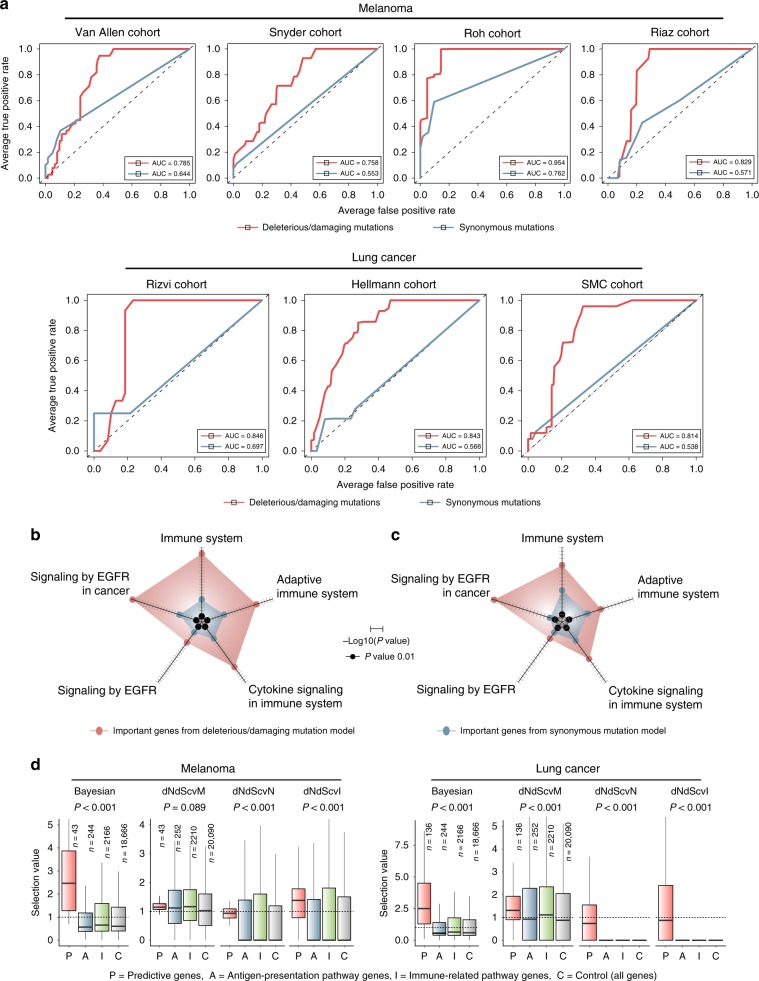
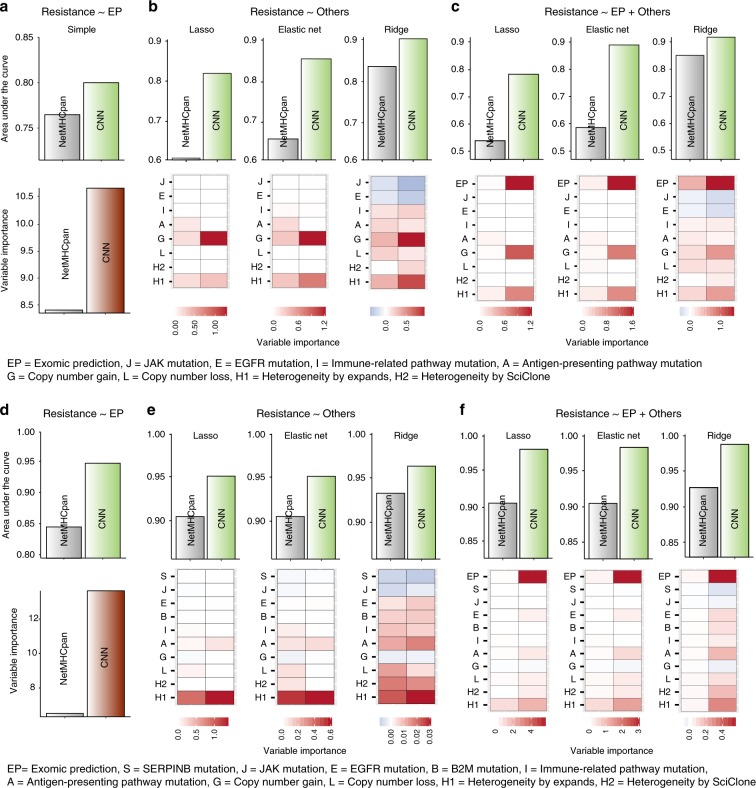
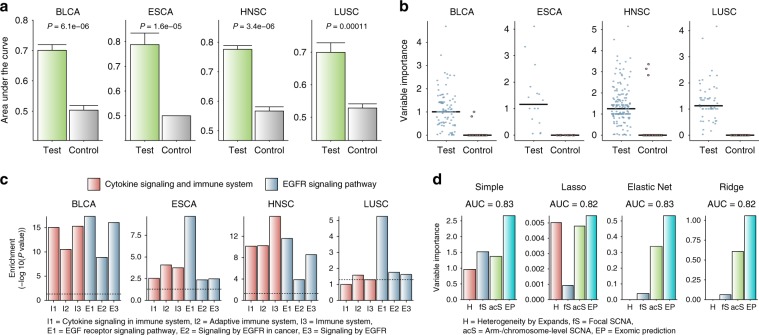
Neoantigen burden is regarded as a fundamental determinant of response to immunotherapy. However, its predictive value remains in question because some tumours with high neoantigen load show resistance. Here, we investigate our patient cohort together with a public cohort by our algorithms for the modelling of peptide-MHC binding and inter-cohort genomic prediction of therapeutic resistance. We first attempt to predict MHC-binding peptides at high accuracy with convolutional neural networks. Our prediction outperforms previous methods in > 70% of test cases. We then develop a classifier that can predict resistance from functional mutations. The predictive genes are involved in immune response and EGFR signalling, whereas their mutation patterns reflect positive selection. When integrated with our neoantigen profiling, these anti-immunogenic mutations reveal higher predictive power than known resistance factors. Our results suggest that the clinical benefit of immunotherapy can be determined by neoantigens that induce immunity and functional mutations that facilitate immune evasion.


Conflict of interest statement

The authors declare no competing interests.

Figures

Fig. 1
Fig. 1. Prediction model for peptide-MHC class I binding and performance evaluation.
a CNN architecture was used to predict binding between peptides and MHC class I molecules. The two-dimensional map of interactions between amino acids in peptide-MHC class I complex was used as the input matrix. A set of kernels, A1,…An, covering the entire HLA sequence were applied on the input matrix. The output convolution scores in the first layer were scanned by the second set of kernels, B1,…, Bn. A fully connected layer attached to the second layer integrated the convoluted patterns for classification. b Comparison of prediction performance with SMMPMBEC, artificial neural network (ANN), NetMHCcon, and NetMHCpan on the basis of weekly updated test datasets of IEDB. In terms of AUC, our method was superior to SMMPMBEC, ANN, NetMHCcon, and NetMHCpan for 100%, 100%, 90%, and 70% of the test cases. With regards to the F1 score, our CNN was superior to all the methods for 80% of the test cases. Source data are provided as a Source Data file.
Fig. 2
Fig. 2. Clinical relevance of neoantigen load predicted by the CNN model.
a Neoantigen load was estimated by the CNN and NetMHCpan method for four melanoma cohort (Van allen, Snyder, Roh, and Riaz) and three lung cancer cohort (Rizvi, Hellmann, and SMC) samples divided according to the clinical benefit to checkpoint blockade. The Wilcoxon rank-sum test was used to calculate the statistical significance of the difference in neoantigen load between the two groups. -log10(P value) was plotted with the significant cases highlighted in green. b Survival analysis was performed for samples with high versus low neoantigen load in the two melanoma and three lung cancer cohorts that exceeded a given threshold in a. The same threshold of neoantigen load as the previous study was used. c, d To test clinical relevance on TCGA melanoma samples (SKCM), we computed TCR diversity and immune score for SKCM and compared them between high-neoantigen (n = 52 for TCR diversity, n = 52 for TCR diversity by MiXCR, and n = 11 for Immune score, respectively) and low-neoantigen groups (n = 51 for TCR diversity, n = 51 for TCR diversity by MiXCR, and n = 10 for Immune score, respectively). The centre line and bottom/upper bounds indicate the median and 1st/3rd quartile, respectively. c Also, survival analysis was performed for samples with high (n = 52) versus low (n = 51) neoantigen load (d). The median level of neoantigen load was used as the threshold to divide the neoantigen groups. Source data are provided as a Source Data file.
Fig. 3
Fig. 3. Exomic prediction of therapeutic resistance.
a We trained random forests using genes that harbour deleterious or damaging mutations in > 5% of the samples. For each cohort, we used the other cohorts of the same tumour type as training data. For example, we trained random forests with Hellman and Rizvi cohorts and tested performance on SMC cohort. Shown here are the ROC curves comparing the original data (red curves) and negative controls generated by training the classifier on synonymous mutations (blue curves). The same number of features and samples were used between the original and negative control model. b, c Functional enrichment of genes with high explanatory power (variable importance > 3) and their interaction partners in b melanoma and c lung cancer. The radar plots present the statistical significance of enrichment. The axis length scales with -log10(P value). d Selection values based on the Bayesian inference and covariate model (dNdScv) for the genes with high variable importance from our random forest classifier. Shown are the selection values obtained for skin cutaneous melanoma (SKCM) and lung squamous cell carcinoma (LUSC) samples from TCGA. dNdScvM and dNdScvN are the normalised ratio of nonsynonymous to synonymous mutations (dN/dS) for missense and nonsense mutations, respectively. dNdScvI indicates the observed to expected ratio for indels. The centre line and bottom/upper bounds indicate the median and 1st/3rd quartile, respectively. Source data are provided as a Source Data file.
Fig. 4
Fig. 4. Comparison of exomic prediction with other resistance markers.
ac Results for SMC cohort. df Results for Roh cohort. a, d AUC (upper) and variable importance (lower) for the regression of therapeutic resistance on the exomic prediction scores when resistance was defined with neoantigen load estimated by CNN or NetMHCpan. b, e AUC (upper) and variable importance (lower) for the regression of therapeutic resistance on the known resistance parameters when resistance was defined based on neoantigen load estimated by CNN or NetMHCpan. c, f AUC (upper) and variable importance (lower) for the regression of resistance on the known resistance parameters and exomic prediction scores when resistance was defined based on neoantigen load estimated by CNN or NetMHCpan. Source data are provided as a Source Data file.
Fig. 5
Fig. 5. Immunogenic mutations as determinants of immune evasion of tumours.
a We trained random forest on TCGA samples of different tumour types using genes that harbour deleterious or damaging mutations. Tumours with immune evasion were defined by high neoantigen load and low activity of selected immune markers for each tumour type. Performance was evaluated using an independent test dataset that was separated from the training processes. Shown here are AUC values resulted from 100 repetitions that compared the original model (green) and negative control model (grey) generated by training the classifier on synonymous mutation patterns. In each repetition, the same number of features and samples were selected for the test and control model. The error bars indicate the standard error of the AUC values from the 100 classifiers. b Variable importance estimated by the test and control random forest models for the genes (n = 99 for BLCA, n = 16 for ESCA, n = 160 for HNSC, and n = 52 for LUSC, respectively) used as input features. c Functional enrichment of genes with high explanatory power and their interacting partners in the protein interactome. d Variable importance from the multiple regression of immune evasion status on neoantigen load and resistance parameters including the exomic prediction score. For the regression analyses, we obtained the mutation prediction scores from a leave-one-sample-out cross validation approach. Therefore, the prediction score was assigned to each sample from the classifier that did not include the given sample for training. Source data are provided as a Source Data file.

References

    1. Sharma P, Allison JP. The future of immune checkpoint therapy. Science. 2014;348:56–61. doi: 10.1126/science.aaa8172. - DOI - PubMed
    1. Schumacher TN, Schreiber RD. Neoantigens in cancer immunotherapy. Science. 2015;348:69–74. doi: 10.1126/science.aaa4971. - DOI - PubMed
    1. Gubin MM, Schreiber RD. The odds of immunotherapy success. Science. 2015;350:158–159. doi: 10.1126/science.aad4140. - DOI - PubMed
    1. Trolle T, et al. Automated benchmarking of peptide-MHC class i binding predictions. Bioinformatics. 2015;31:2174–2181. doi: 10.1093/bioinformatics/btv123. - DOI - PMC - PubMed
    1. The problem with neoantigen prediction. Nat. Biotechnol. 35, 97–97 (2017). https://www.ncbi.nlm.nih.gov/pubmed/28178261. - PubMed

Publication types

MeSH terms