Observational Study
. 2020 Feb 19;10(1):2967.
doi: 10.1038/s41598-020-59443-z.

Inhibition of bone morphogenetic protein 6 receptors ameliorates Sjögren's syndrome in mice

Affiliations
Observational Study

Inhibition of bone morphogenetic protein 6 receptors ameliorates Sjögren's syndrome in mice

Hongen Yin et al. Sci Rep. .

Abstract

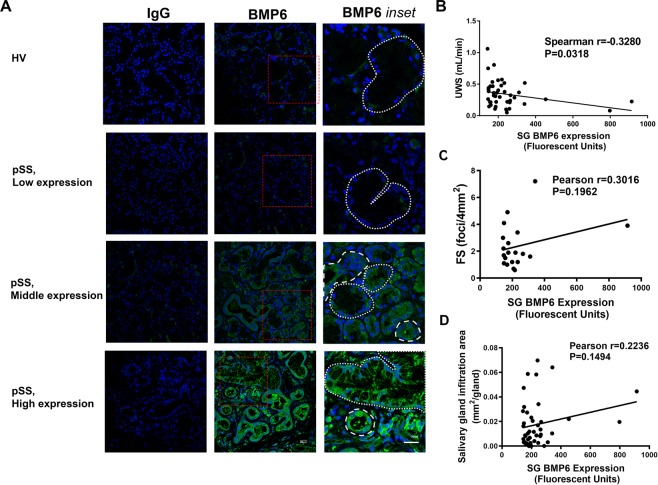
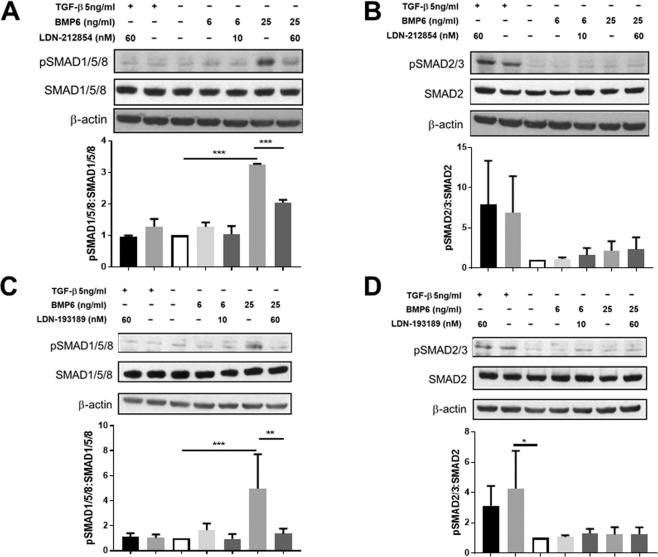
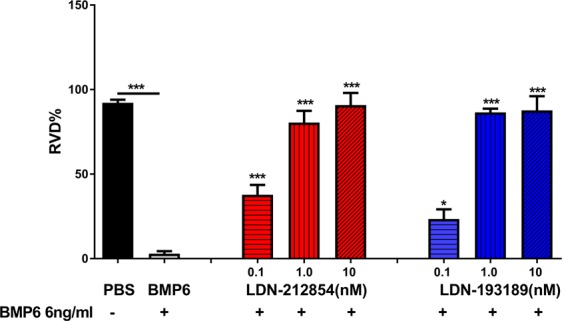
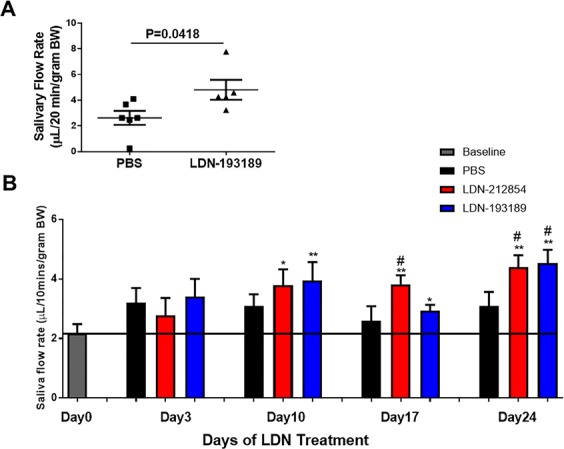
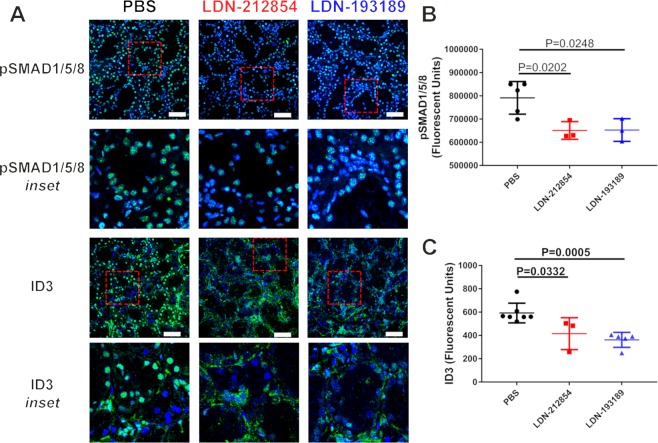
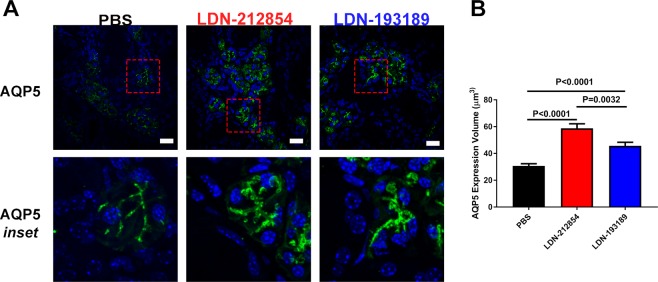
Primary Sjögren's syndrome (pSS) is a chronic autoimmune disease, with only palliative treatments available. Recent work has suggested that increased bone morphogenetic protein 6 (BMP6) expression could alter cell signaling in the salivary gland (SG) and result in the associated salivary hypofunction. We examined the prevalence of elevated BMP6 expression in a large cohort of pSS patients and tested the therapeutic efficacy of BMP signaling inhibitors in two pSS animal models. Increased BMP6 expression was found in the SGs of 54% of pSS patients, and this increased expression was correlated with low unstimulated whole saliva flow rate. In mouse models of SS, inhibition of BMP6 signaling reduced phosphorylation of SMAD1/5/8 in the mouse submandibular glands, and led to a recovery of SG function and a decrease in inflammatory markers in the mice. The recovery of SG function after inhibition of BMP6 signaling suggests cellular plasticity within the salivary gland and a possibility for therapeutic intervention that can reverse the loss of function in pSS.


Conflict of interest statement

The authors declare no competing interests.

Figures

Figure 1
Figure 1
BMP6 expression in minor salivary glands of primary Sjögren’s syndrome patients and correlation with xerostomia and sialadenitis. (A) Confocal images demonstrating expression of bone morphogenetic protein 6 (BMP6) in minor salivary glands (SGs) of three representative patients with primary Sjögren’s syndrome (pSS), with either low, middle or high expression (134.0, 261.3, and 797.5 fluorescence units, rows 2–4) and of one healthy volunteer (HV) (112.3 fluorescence units, row 1). Left column: slides labeled with isotype control antibody (mouse IgG) were used as background control (40× objective). Middle column: slides labeled with anti-BMP6 antibody (40× objective). Right row: Inset of the marked areas in the middle row (red dashed box). White large and small dashes were used to mark the ducts and acini tissues, respectively. (B) In minor SG, BMP6 positive pSS patients (BMP6 expression ≥142.3 fluorescence units, N = 43), BMP6 expression was negatively correlated with their unstimulated whole saliva (UWS) flow rate (Spearman’s r = −0.328, P = 0.0318). (C) In minor SG of BMP6 positive pSS patients, BMP6 expression has a trend of positive correlation with focus score (FS) but was not statistically significant (N = 20, only minor SG BMP6 positive patients whose FS data was reported by SICCA were selected. Pearson’s r = 0.3016, P = 0.1962). (D) In minor SG of BMP6 positive pSS patients, BMP6 expression has a trend of positive correlation with lymphocytic infiltration area (N = 43, Pearson’s r = 0.2236, P = 0.1494).
Figure 2
Figure 2
Effect of ALK2/3 inhibitors on increased phosphorylated SMAD1/5/8 and SMAD2/3 expression induced by BMP6 and TGF-β in HSG cells. Phosphorylated SMAD1/5/8 (pSMAD1/5/8), pSMAD2/3, SMAD1/5/8, SMAD2 and β-actin (internal control) expression in HSG cells subjected to bone morphogenetic protein 6 (BMP6) or transforming growth factor-beta (TGF-β) with/without LDN treatment, as measured by Western blot (WB). To determine expression level, fold change of protein expression relative to control cell lysate (HSG cells treated with culture media and diluent for each BMP signaling inhibitor and diluent for LDN only) was used. (A) Effect of LDN-212854 on pSMAD1/5/8:SMAD1/5/8 ratio. Upper panel: representative WB of pSMAD1/5/8:SMAD1/5/8 ratio after HSG cells were cultured with 5 ng/mL TGF-β + 60 nM LDN-212854 (lane 1), 5 ng/mL TGF-β (lane 2), control medium (lane 3), 6 ng/mL BMP6 (lane 4), 6 ng/mL BMP6 + 10 nM LDN-212854 (lane 5), 25 ng/mL BMP6 (lane 6), or 25 ng/mL BMP6 + 60 nM LDN-212854 (lane 7). Lower panel: 25 ng/mL BMP6 significantly increased pSMAD1/5/8:SMAD1/5/8 ratio (P < 0.0001), but 60 nM LDN-212854 significantly reversed this effect (P < 0.0001); 5 ng/mL TGF-β did not change pSMAD1/5/8:SMAD1/5/8 ratio. (B) Effect of LDN-212854 on pSMAD2/3:SMAD2 ratio. Upper panel: representative WB of pSMAD2/3:SMAD2 ratio after HSG cells were cultured with different reagents as labeled (see legend A). Lower panel: 5 ng/mL TGF-β increased pSMAD2/3:SMAD2 ratio and 60 nM LDN-212854 did not change this effect; BMP6 with/without LDN-212854 did not alter pSMAD2/3:SMAD2 ratio. (C) Effect of LDN-193189 on pSMAD1/5/8:SMAD1/5/8 ratio. Upper panel: representative WB of pSMAD1/5/8:SMAD1/5/8 ratio after HSG cells were cultured with different reagents as labeled (see legend A). Lower panel: 25 ng/mL BMP6 significantly increased pSMAD1/5/8:SMAD1/5/8 ratio (P < 0.0001), but 60 nM LDN-193189 significantly reversed this effect (P = 0.0004); 5 ng/mL TGF-β did not change pSMAD1/5/8:SMAD1/5/8 ratio. (D) Effect of LDN-193189 on pSMAD2/3:SMAD2 ratio. Upper panel: representative WB of pSMAD2/3:SMAD2 ratio after HSG cells were cultured with different reagents as labeled (see legend A). Lower panel: 5 ng/mL TGF-β significantly increased pSMAD2/3:SMAD2 ratio (P = 0.0113), but 60 nM LDN-193189 did not change this effect; BMP6 with/without LDN-212193 did not alter pSMAD2/3:SMAD2 ratio. Data shown are means ± SEM from N = 5 (A&C) or N = 2 experiments (B&D). One-way ANOVA followed by Tukey’s multiple comparison was used to compare the seven groups; *P ≤ 0.05, **P ≤ 0.01 and ***P ≤ 0.0001 when compared with control group.
Figure 3
Figure 3
Effect of ALK2/3 inhibitors on regulatory volume decrease in HSG cells. HSG cells were placed in hypotonic solution in absence (black column) or presence of 6 ng/mL bone morphogenetic protein 6 (BMP6) (gray column), 6 ng/mL BMP6 + 0.1, 1.0 or 10 nM LDN-212854 (red columns), or 6 ng/mL BMP6 + 0.1, 1.0 or 10 nM LDN-193189 (blue columns). BMP6 significantly inhibited recovery of cell volume change (as indicated by reduced regulatory volume decrease [RVD%]), but LDN treatment reversed this effect in a dose-dependent manner. Data shown are means ± SEM from N = 3 experiments. One-way ANOVA followed by Tukey’s multiple comparison was used for comparison; *P ≤ 0.05, **P ≤ 0.01 and ***P ≤ 0.0001 when compared with control BMP6-treated group (column 2).
Figure 4
Figure 4
Saliva secretion in BMP6-overexpressing C57BL/6J mice and C57BL/6.NOD-Aec1Aec2 mice after ALK2/3 inhibitor treatment. (A) Submandibular glands (SMGs) of female C57BL/6J mice were cannulated and AAV5 vector encoding bone morphogenetic protein 6 (BMP6) was instilled to promote local BMP6 expression. Twenty-four months post-cannulation, mice were treated with citrate saline or 2.5 mg/kg LDN-193189 administered i.p. twice daily for 3 days. LDN-193189–treated mice showed a significant increase of salivary flow rate (SFR) compared with saline-treated mice. Data shown are means ± SEM and were analyzed with unpaired Student’s t test. (B) Male (M) and female (F) C57BL/6.NOD-Aec1Aec2 mice with established disease were treated daily with PBS (black columns, N = 13, 7M6F), 2.5 mg/kg LDN-212854 (red columns, N = 13, 6M7F), or 2.5 mg/kg LDN-193189 (blue columns, N = 14, 8M6F) for 24 days. SFR was determined in all mice prior to LDN treatment (day 0, baseline), and on day 3, 10, 17 and 24 thereafter. SFR significantly increased in LDN-treated mice compared with PBS-treated mice (control group) from day 10 to 24. Data shown are means ± SEM. Unpaired Student’s t test was used to compare two groups. *P < 0.05 and **P < 0.01 compared with baseline, #P < 0.05 compared with PBS-treated group at same time point.
Figure 5
Figure 5
pSMAD1/5/8 and ID3 expression in submandibular glands of C57BL/6.NOD-Aec1Aec2 mice after ALK2/3 inhibitor treatment. Confocal images demonstrating expression of pSMAD1/5/8 and ID3 in submandibular glands (SMGs) of LDN-treated C57BL/6.NOD-Aec1Aec2 mice. (A) Representative images of pSMAD1/5/8 and ID3 expression in SMGs of mice daily treated with PBS (control, left panels), 2.5 mg/kg LDN-212854 (middle panels), or 2.5 mg/kg LDN-193189 (right panels) for 24 days. Row 1 & 3: slides labeled with pSMAD1/5/8 and ID3 antibodies, respectively (40× objective, white bar: 50 µm). Row 2 & 4: Inset for the marked area in row 1 and 3, respectively (red-dashed box). (B,C) Statistical analysis showed a significant decrease in (B) pSMAD1/5/8 and (C) ID3 expression in LDN-treated mice compared with PBS-treated (control) mice (P < 0.05). Data shown are means ± SEM from N ≥3 mice respectively. Statistical significance was determined with unpaired Student’s t test.
Figure 6
Figure 6
Expression of aquaporin 5 in submandibular glands of C57BL/6.NOD-Aec1Aec2 mice. Confocal images of submandibular gland (SMG) tissue of LDN-treated C57BL/6.NOD-Aec1Aec2 mice. (A) Representative Z-stack images from SMG slides labeled with isotype control antibody anti-mouse AQP5 antibody for mice treated with PBS (left column), LDN-212854 (middle column) or LDN-193189 (right column). Row 1: slides labeled with AQP5 antibody (40× objective, white bar: 20 µm). Row 2: Inset for the marked area in row 1 (red-dashed box) (N ≥ 3). (B) Statistical analysis of AQP5 expression measured by total volume from Z-stack images in panel A showed a significant increase in AQP5 expression in LDN-treated mice compared with control mice (P < 0.0001). Data shown are means ± SEM. Statistical significance was determined with unpaired Student’s t test.

Similar articles

Cited by

References

    1. Brandt JE, Priori R, Valesini G, Fairweather D. Sex differences in Sjogren’s syndrome: a comprehensive review of immune mechanisms. Biol. Sex. Differ. 2015;6:19. doi: 10.1186/s13293-015-0037-7. - DOI - PMC - PubMed
    1. Fox RI. Sjogren’s syndrome. Lancet. 2005;366:321–331. doi: 10.1016/S0140-6736(05)66990-5. - DOI - PubMed
    1. Yin H, et al. Association of bone morphogenetic protein 6 with exocrine gland dysfunction in patients with Sjogren’s syndrome and in mice. Arthritis rheumatism. 2013;65:3228–3238. doi: 10.1002/art.38123. - DOI - PMC - PubMed
    1. Lai Z, et al. Aquaporin gene therapy corrects Sjogren’s syndrome phenotype in mice. Proc. Natl Acad. Sci. United States of America. 2016;113:5694–5699. doi: 10.1073/pnas.1601992113. - DOI - PMC - PubMed
    1. Xu J, et al. Effect of Bone Morphogenetic Protein 6 on Immunomodulatory Functions of Salivary Gland-Derived Mesenchymal Stem Cells in Sjogren’s Syndrome. Stem Cell Dev. 2018;27:1540–1548. doi: 10.1089/scd.2017.0161. - DOI - PMC - PubMed

Publication types

MeSH terms