Comparative Study
. 2020 Feb 19;10(1):2949.
doi: 10.1038/s41598-020-59826-2.

Automated Quantitative Extraction and Analysis of 4D flow Patterns in the Ascending Aorta: An intraindividual comparison at 1.5 T and 3 T

Affiliations
Comparative Study

Automated Quantitative Extraction and Analysis of 4D flow Patterns in the Ascending Aorta: An intraindividual comparison at 1.5 T and 3 T

Sebastian Ebel et al. Sci Rep. .

Abstract

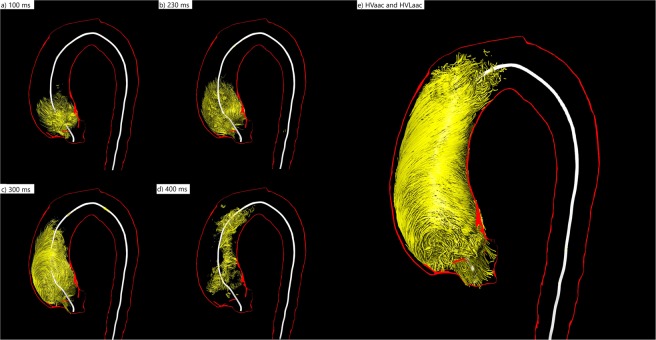
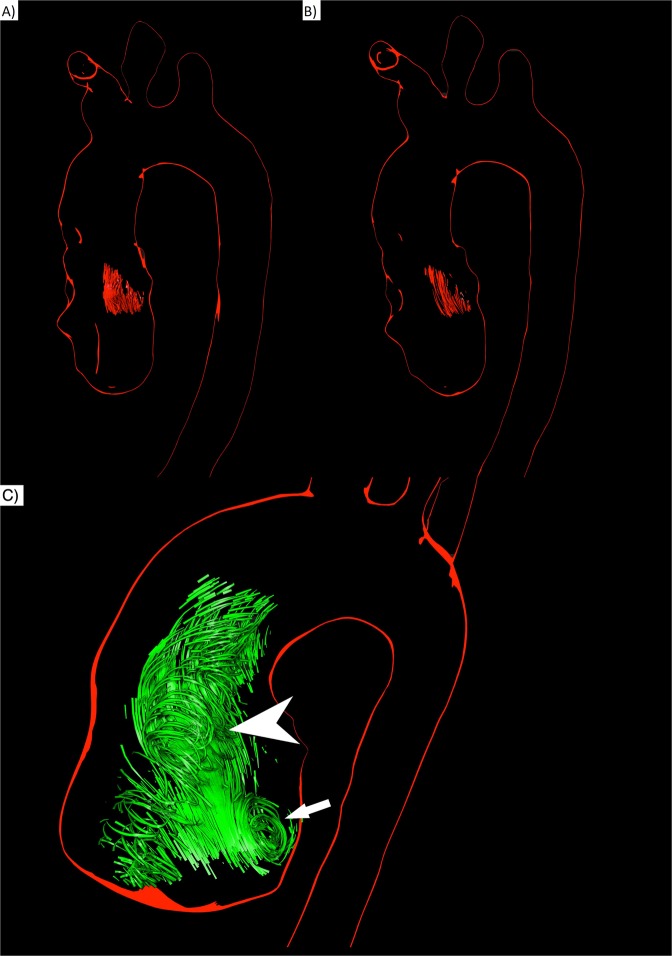
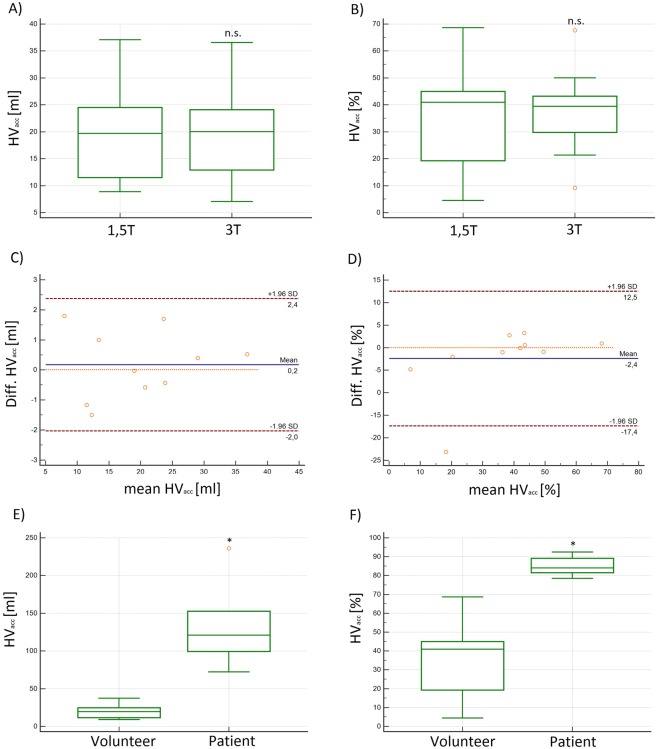
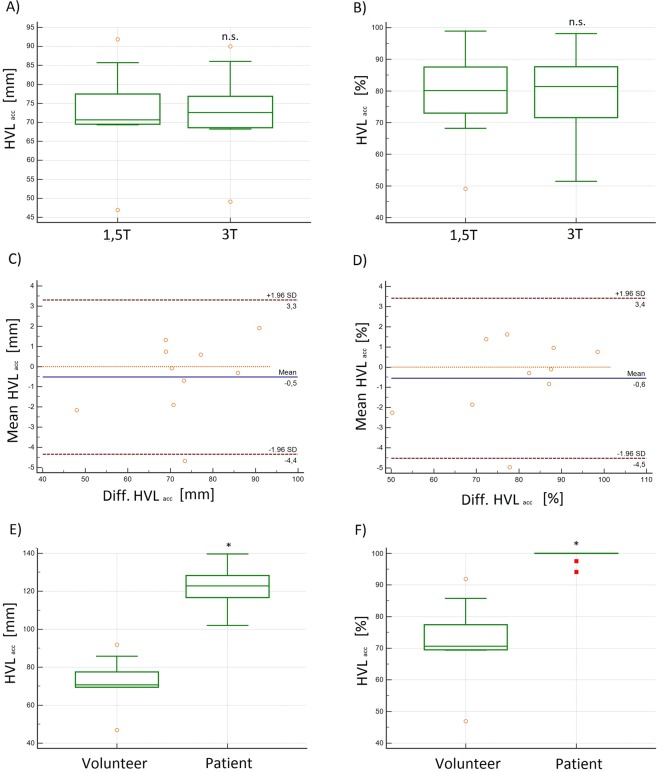
4D flow MRI enables quantitative assessment of helical flow. Current methods are susceptible to noise. To evaluate helical flow patterns in healthy volunteers and patients with bicuspid aortic valves (BAV) at 1.5 T and 3 T using pressure-based helix-extraction in 4D flow MRI. Two intraindividual 4D flow MRI examinations were performed at 1.5 T and 3 T in ten healthy volunteers (5 females, 32 ± 3 years) and 2 patients with BAV using different acceleration techniques (kt-GRAPPA and centra). Several new quantitative parameters for the evaluation of volumes [ml], lengths [mm] as well as temporal parameters [ms] of helical flow were introduced and analyzed using the software tool Bloodline. We found good correlations between measurements in volunteers at 1.5 T and 3 T regarding helical flow volumes (R = 0.98) and temporal existence (R = 0.99) of helices in the ascending aorta. Furthermore, we found significantly larger (11.7 vs. 77.6 ml) and longer lasting (317 vs. 769 ms) helices in patients with BAV than in volunteers. The assessed parameters do not depend on the magnetic field strength used for the acquisition. The technique of pressure-based extraction of 4D flow MRI pattern is suitable for differentiation of normal and pathological flow.


Conflict of interest statement

The authors declare no competing interests.

Figures

Figure 1
Figure 1
3D visualization of the evolution of a helix in the ascending aorta during the entire cardiac cycle of a patient with BAV (female, 39 years old) (a) At 100 ms the helix occupies only the very proximal part of the ascending aorta. (b) At 230 ms it has grown in volume and length and occupies almost half of the ascending aorta. (c) At 300 ms the very proximal part of the helix vanishes while the distal parts proceed towards the aortic arch. (d) At 400 ms only some remnants of the helix can be seen in the mid-ascending aorta. (e) The summation of all volumes that contributed to the helix during the entire cardiac cycle is the accumulated Helical Volume (HVacc). The absolute (relative) HVmax in this BAV patient was 44.81 ml (57.41%) of the ascending aorta volume. The absolute HVacc was 118.44 ml, the relative HVacc 92.44% of the ascending aorta volume. The temporal helical existence (THex) was 89% of the cardiac cycle, indicating that it persists almost throughout the entire systole and diastole. The absolute HVLacc in this patient was 107.8 mm, the relative HVLacc 100% of the ascending aorta length. HV(I)max was 22.32 ml/m2. HV(I)acc was 89.04 ml/m2.
Figure 2
Figure 2
Three examples for the determination of the rotation direction in the cross-section. The lines from the blue point (first) to the red point (second) are pathline segments that are projected into a plane. (a) The successive points are in the first and second quadrant, they represent a right-handed segment. (b) The successive points are in the fourth and third segment, they represent a left-handed segment. (c) The points are in diagonal quadrants, in this case they represent a right-handed segment.
Figure 3
Figure 3
Comparison of 3D visualizations of helices in a healthy volunteer (male, 31 years old) at 1.5 T (A) and 3 T (B) HVmax 10.3 ml (A) vs. 11.0 ml (B); HVacc 16.9 ml (A) vs. 17.4 ml (B) (C) 3D visualizations of systolic helical and vortical flow in the ascending aorta of a patient with BAV (45 years old male) at 1.5 T. A large formation of vortical flow is located behind the opened aortic valve at the site of the aortic sinus (arrow). A formation of helical flow evolves through the ascending aorta (arrow head).
Figure 4
Figure 4
(A,B) Box plots of the absolute and relative temporal helical existence (THEx) in [ms] and [%] of all volunteers demonstrated no significant differences at 1.5 T and 3 T. (C,D) Box plots of the absolute and relative temporal helical existence (THEx) in [ms] and [%] demonstrated significantly higher values in patients as compared to volunteers. n.s. = no significant differences; *significant differences.
Figure 5
Figure 5
(A,B) Box plots of the absolute and relative maximum helical volume (HVmax) in [ml] and [%] demonstrated no significant differences at 1.5 T and 3 T in volunteers. (C,D) Box plots of the absolute and relative maximum helical volume (HVmax) in [ml] and [%] demonstrated significantly higher values in patients as compared to volunteers. The difference of the relative HVmax is less pronounced as with the absolute values. n.s. = no significant differences; *significant differences.
Figure 6
Figure 6
(A,B) Box plots and (C,D) Bland-Altman plots of the absolute and relative accumulated helical volume (HVacc) in [ml] and [%] at 1.5 T and 3 T demonstrating no significant differences in volunteers. (E,F) Box plots of the absolute and relative accumulated helical volume (HVacc) in [ml] and [%] in patients and volunteers. The difference of the relative accumulated HVacc is less pronounced as with the absolute values, but still significant. n.s. = no significant differences; *significant differences.
Figure 7
Figure 7
(A) Box plot and (B) Bland-Altman plot of the absolute and relative maximum Helical-Volume-Index (HV(I)acc) demonstrated no significant differences at 1.5 T and 3 T in volunteers. (C) Box plot of the absolute HV(I)acc demonstrating significantly higher values in patients as compared to volunteers in [ml/m2]. n.s. = no significant differences; *significant differences.
Figure 8
Figure 8
(A,B): Box plots and (C,D) Bland-Altman plots of the absolute and relative accumulated helical volume length (HVLacc) in [mm] and [%] demonstrated no significant differences at 1.5 T and 3 T in volunteers. (E,F) Box plots of the absolute and relative accumulated helical volume length (HVLacc) in [mm] and [%] demonstrating significantly higher values in patients as compared to volunteers. n.s. = no significant differences; *significant differences.

References

    1. van der Geest RJ, Garg P. Advanced Analysis Techniques for Intra-cardiac Flow Evaluation from 4D Flow MRI. Curr. Radiol. Rep. 2016;4:38. doi: 10.1007/s40134-016-0167-7. - DOI - PMC - PubMed
    1. Lorenz R, et al. 4D Flow MRI in aortic valve disease demonstrates altered distribution of aortic blood flow helicity. Magn Reson Med. 2012;31:2012. - PMC - PubMed
    1. Markl M, Frydrychowicz A, Kozerke S, Hope M, Wieben O. 4D flow MRI. J. Magn. Reson. Imaging. 2012;36:1015–1036. doi: 10.1002/jmri.23632. - DOI - PubMed
    1. Dyverfeldt P, et al. 4D flow cardiovascular magnetic resonance consensus statement. J. Cardiovasc. Magn. Reson. 2015;17:72. doi: 10.1186/s12968-015-0174-5. - DOI - PMC - PubMed
    1. Stankovic Z, Allen BD, Garcia J, Jarvis KB, Markl M. 4D flow imaging with MRI. Cardiovasc. Diagn. Ther. 2014;4:173–92. - PMC - PubMed

Publication types