
Investigation of the fine structure of antihydrogen

ALPHA Collaboration. Nature. 2020 Feb.

Erratum in

Abstract

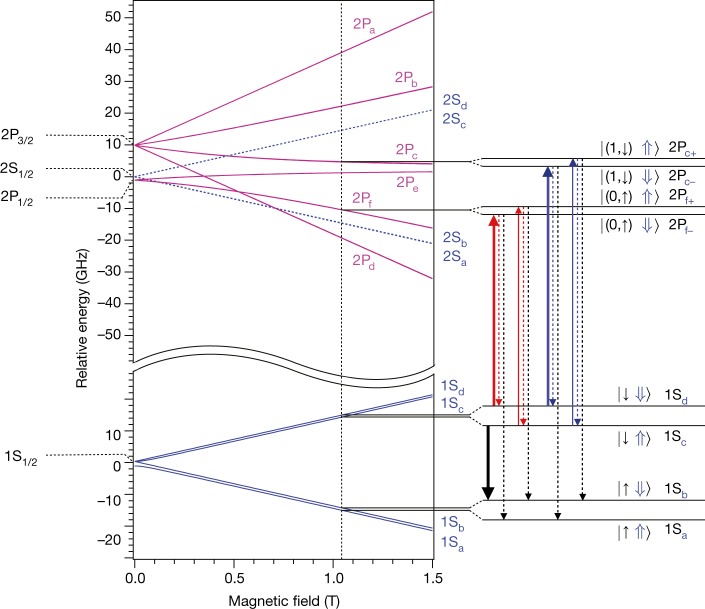
At the historic Shelter Island Conference on the Foundations of Quantum Mechanics in 1947, Willis Lamb reported an unexpected feature in the fine structure of atomic hydrogen: a separation of the 2S1/2 and 2P1/2 states1. The observation of this separation, now known as the Lamb shift, marked an important event in the evolution of modern physics, inspiring others to develop the theory of quantum electrodynamics2-5. Quantum electrodynamics also describes antimatter, but it has only recently become possible to synthesize and trap atomic antimatter to probe its structure. Mirroring the historical development of quantum atomic physics in the twentieth century, modern measurements on anti-atoms represent a unique approach for testing quantum electrodynamics and the foundational symmetries of the standard model. Here we report measurements of the fine structure in the n = 2 states of antihydrogen, the antimatter counterpart of the hydrogen atom. Using optical excitation of the 1S-2P Lyman-α transitions in antihydrogen6, we determine their frequencies in a magnetic field of 1 tesla to a precision of 16 parts per billion. Assuming the standard Zeeman and hyperfine interactions, we infer the zero-field fine-structure splitting (2P1/2-2P3/2) in antihydrogen. The resulting value is consistent with the predictions of quantum electrodynamics to a precision of 2 per cent. Using our previously measured value of the 1S-2S transition frequency6,7, we find that the classic Lamb shift in antihydrogen (2S1/2-2P1/2 splitting at zero field) is consistent with theory at a level of 11 per cent. Our observations represent an important step towards precision measurements of the fine structure and the Lamb shift in the antihydrogen spectrum as tests of the charge-parity-time symmetry8 and towards the determination of other fundamental quantities, such as the antiproton charge radius9,10, in this antimatter system.


Conflict of interest statement

The authors declare no competing interests.

Figures

Fig. 1
Fig. 1. Expected antihydrogen energy levels.
Calculated energies of the fine structure and the hyperfine sublevels of the 1S1/2, 2S1/2, 2P3/2 and 2P1/2 states are shown as functions of magnetic-field strength. The spin orientations for antihydrogen are shown; they are reversed for hydrogen. The centroid energy difference, E1S–2S = 2.4661 × 1015 Hz, has been suppressed on the vertical axis. Details of the energy levels relevant to this work at a magnetic field of B = 1.0329 T are shown on the right. Each state is labelled using conventional notation. For the 1S and 2S states, the hyperfine states are labelled with subscripts a–d in order of increasing energy (see, for example, ref. ); namely, Sa=|, Sb=|, Sc=| and Sd=|, where the ket notation represents the positron spin (left; ↓ or ↑) and antiproton spin (right; ⇓ or ⇑) states in the high-field limit. The labels Sab and Scd are used when the antiproton spins are unpolarized. For the 2P states, the fine-structure splittings are labelled with subscripts a–f in order of decreasing energy at low magnetic fields, whereas the hyperfine splitting due to the antiproton spin is specified by subscripts + and − for spin parallel (⇑) and anti-parallel (⇓) to the magnetic field in the high-field limit, respectively. The symbol (↓,↑) in the figure indicates that the positron spin states are mixed for the 2Pc and 2Pf states. The vertical solid arrows indicate the one-photon laser transitions probed here: 1Sd → 2Pf− (bold red), 1Sc → 2Pf+ (thin red), 1Sd → 2Pc− (bold blue) and 1Sc → 2Pc+ (thin blue). The dashed red and blue arrows indicate relaxation to the same trappable level, which is not detectable in the present experiment, and the dashed black arrows indicate relaxation to untrappable levels, which is detectable via annihilation signals (see text). The bold black arrow shows the microwave transition used to eliminate 1Sc state atoms to prepare a doubly spin-polarized antihydrogen sample.
Fig. 2
Fig. 2. The ALPHA-2 central apparatus.
A cylindrical trapping volume for neutral antimatter with a diameter of 44.35 mm and an axial length of 280 mm is located inside several Penning trap electrodes and surrounded by an octupole coil, five mirror coils and two solenoids, all superconducting. The three-layer silicon vertex annihilation detector is shown schematically in green. Laser light (purple line) enters from the positron (e+) side (right) and is transmitted to the antiproton (p¯) side (left) through vacuum-ultraviolet-grade MgF2 ultrahigh-vacuum windows. The laser beam crosses the trap axis at an angle of 2.3°. The transmitted 121.6-nm pulses are detected by a solar-blind photomultiplier tube (PMT) at the antiproton side. Microwaves used to prepare the doubly spin-polarized samples are introduced from the positron side through a waveguide, shown in blue. The external solenoid magnet for the Penning traps is not shown here. THG, third-harmonic generation.
Fig. 3
Fig. 3. 1S–2P fine-structure spectrum of antihydrogen.
a, b, Experimental data (filled circles) and fitted lineshapes for singly spin-polarized (a) and doubly spin-polarized (b) antihydrogen samples. The data points were obtained from the detected spin-flip events, normalized to the total number of trapped antihydrogen atoms, for a laser pulse energy of 0.5 nJ. The error bars are 1σ counting uncertainties. The frequency is offset by 2,466,036.3 GHz. We note that no data were taken between the two peaks (~2–12 GHz). The red fit curves were obtained via our standard fitting procedure (Model 1), and the blue curves were derived from an alternative fitting model (Model 2), illustrating the sensitivity of our results to the fitting procedure. See text and Methods for detailed discussion.
Fig. 4
Fig. 4. Comparison of antihydrogen and hydrogen transition frequencies.
The experimentally measured frequencies for the 1S–2P transitions in antihydrogen fres(exp) are compared with those theoretically expected for hydrogen fres(th) (Table 2). All four measurements are consistent with hydrogen, and their average gives a combined test of CPT invariance at 16 parts per billion (ppb). The error bars are 1σ, and the calculation of the error bar for the average takes into account correlated uncertainties (Methods).
Extended Data Fig. 1
Extended Data Fig. 1. Determination of transition frequencies.
ad, For each series, the experimental data (filled black circles with error bars) are plotted with fits of various models (red lines) discussed in Methods. The experimental data are normalized to the total number of the detected antihydrogen atoms and a laser power of 5 nW. Also shown are the results of standard simulations (open blue squares with error bars), similarly normalized to the total number of simulated atoms, illustrating the degree of agreement between the data and the simulations, without any tuning parameters. Some discrepancies in the amplitudes can be observed, which may point to errors in our laser power estimates. We note that because our frequency-fitting procedure allows variations in the relative amplitudes, the fits are largely insensitive to the amplitude differences (Methods). Error bars represent 1σ.

Comment in

References

    1. Lamb WE, Jr, Retherford RC. Fine structure of the hydrogen atom by a microwave method. Phys. Rev. 1947;72:241–243. doi: 10.1103/PhysRev.72.241. - DOI
    1. Tomonaga S. On a relativistically invariant formulation of the quantum theory of wave fields. Prog. Theor. Phys. 1946;1:27–42. doi: 10.1143/PTP.1.27. - DOI
    1. Schwinger J. On quantum-electrodynamics and the magnetic moment of the electron. Phys. Rev. 1948;73:416–417. doi: 10.1103/PhysRev.73.416. - DOI
    1. Feynman RP. Space–time approach to quantum electrodynamics. Phys. Rev. 1949;76:769–789. doi: 10.1103/PhysRev.76.769. - DOI
    1. Schweber, S. S. QED and the Men who Made it: Dyson, Feynman, Schwinger, and Tomonaga (Princeton Univ. Press, 1994).