. 2020 Mar;579(7797):106-110.
doi: 10.1038/s41586-020-2026-1. Epub 2020 Feb 19.

Caveolae in CNS arterioles mediate neurovascular coupling

Affiliations

Caveolae in CNS arterioles mediate neurovascular coupling

Brian W Chow et al. Nature. 2020 Mar.

Abstract

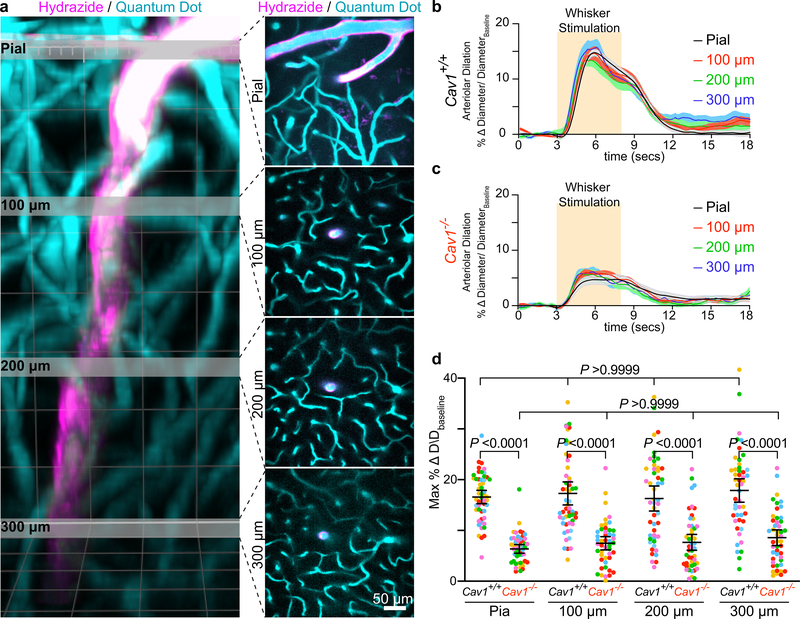
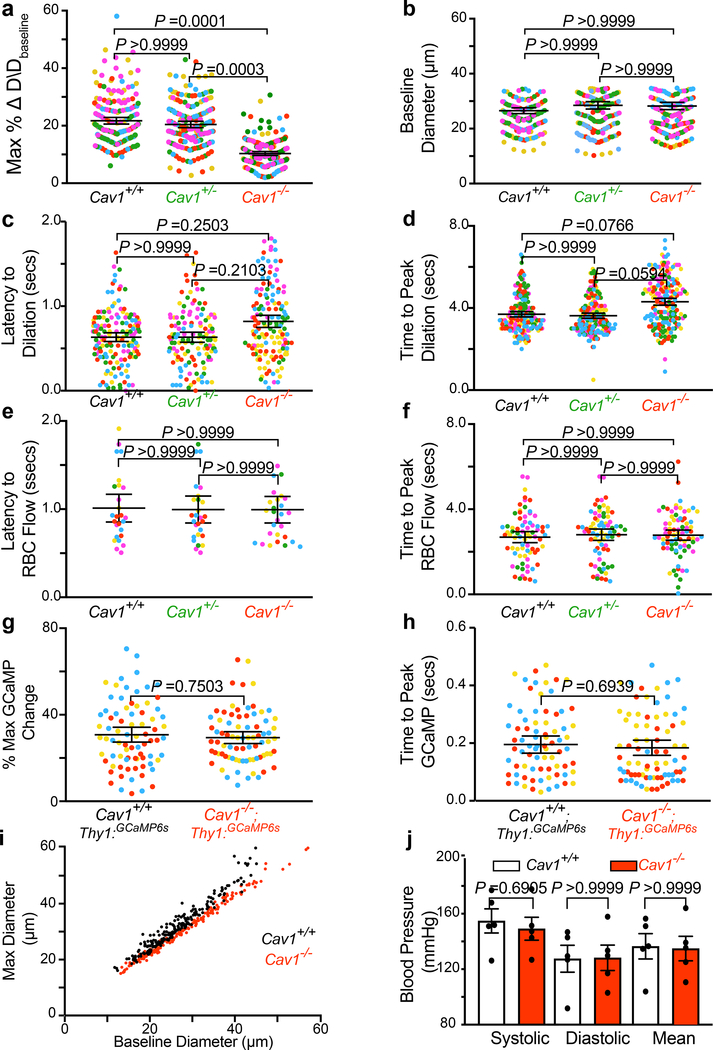
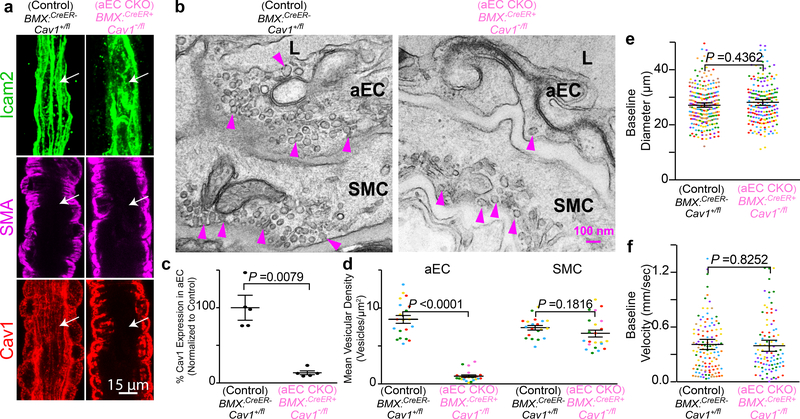
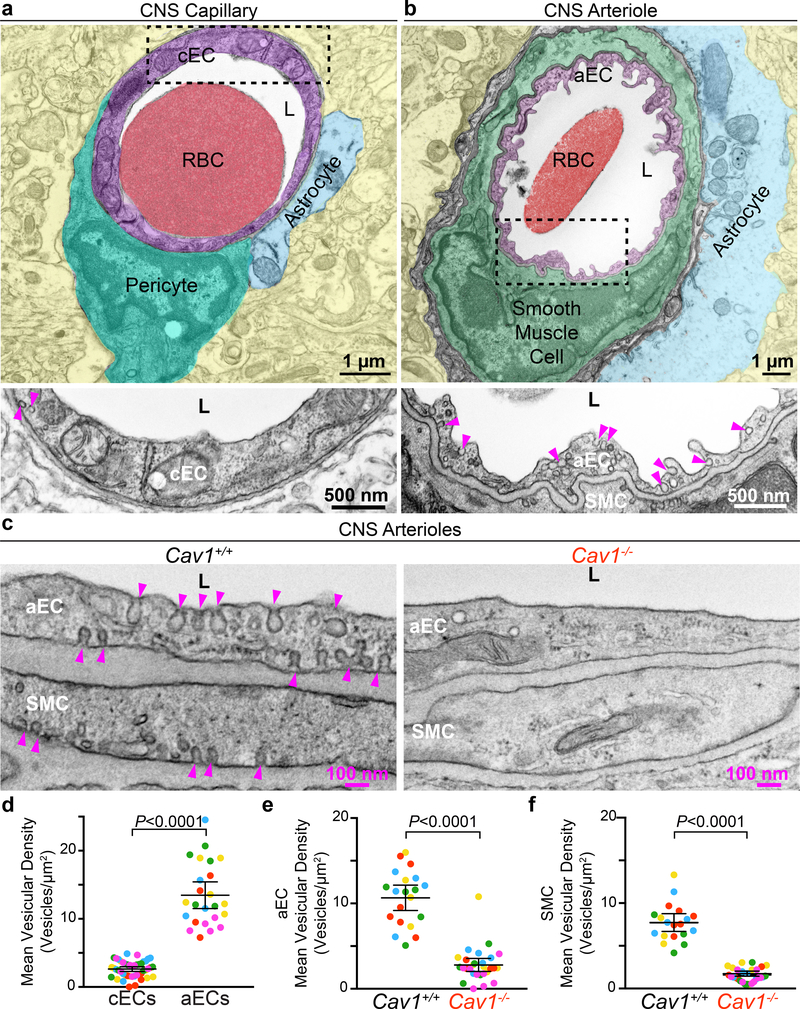
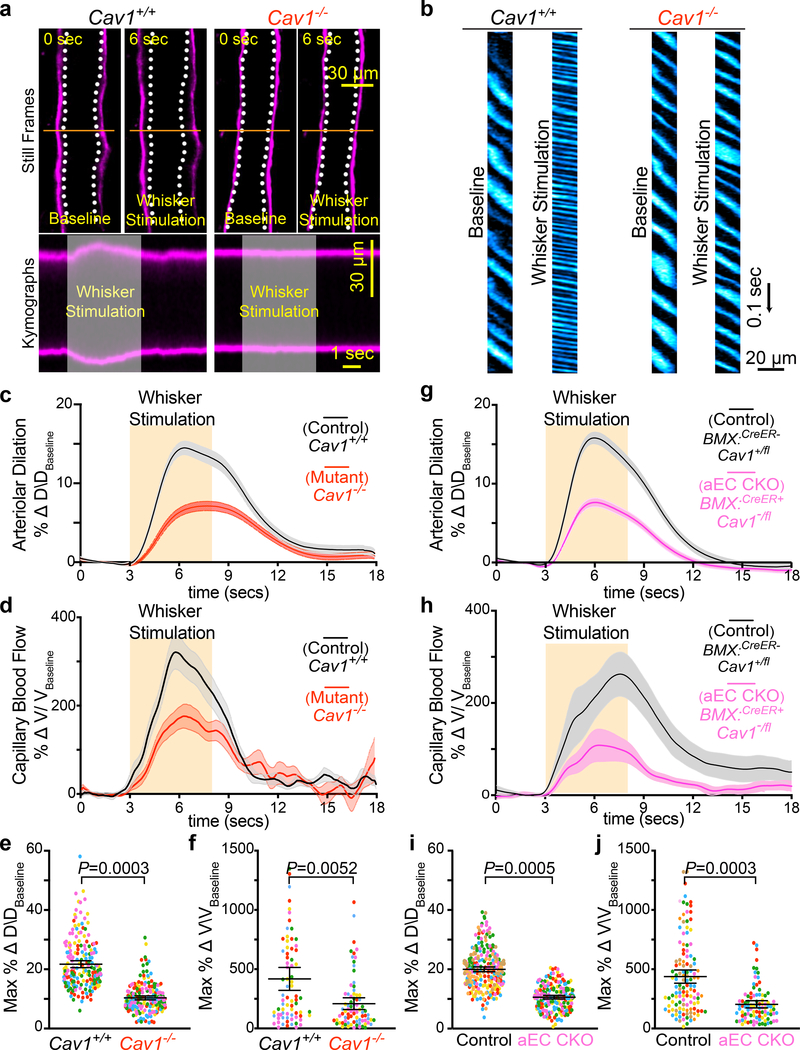
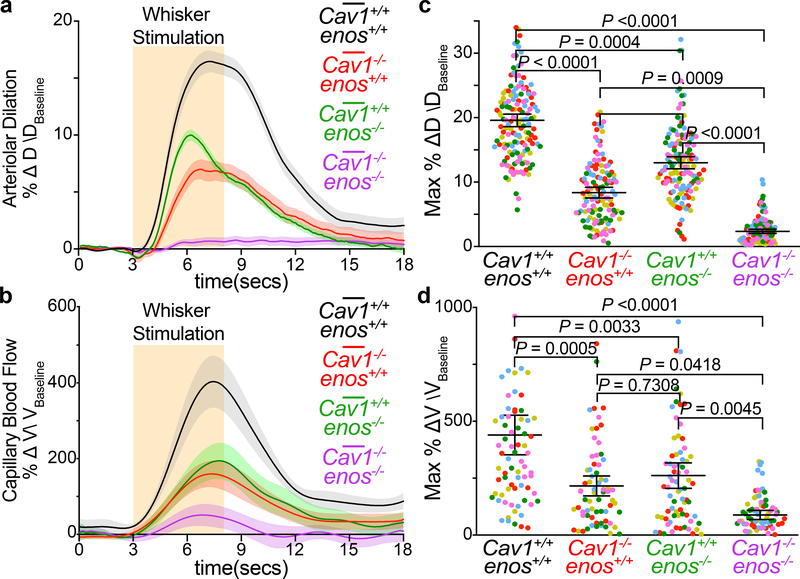
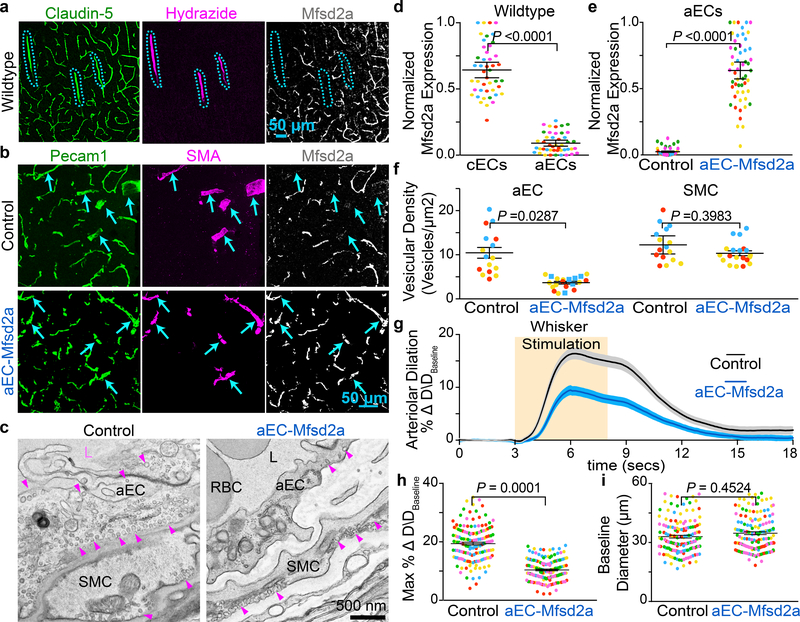
Proper brain function depends on neurovascular coupling: neural activity rapidly increases local blood flow to meet moment-to-moment changes in regional brain energy demand1. Neurovascular coupling is the basis for functional brain imaging2, and impaired neurovascular coupling is implicated in neurodegeneration1. The underlying molecular and cellular mechanisms of neurovascular coupling remain poorly understood. The conventional view is that neurons or astrocytes release vasodilatory factors that act directly on smooth muscle cells (SMCs) to induce arterial dilation and increase local blood flow1. Here, using two-photon microscopy to image neural activity and vascular dynamics simultaneously in the barrel cortex of awake mice under whisker stimulation, we found that arteriolar endothelial cells (aECs) have an active role in mediating neurovascular coupling. We found that aECs, unlike other vascular segments of endothelial cells in the central nervous system, have abundant caveolae. Acute genetic perturbations that eliminated caveolae in aECs, but not in neighbouring SMCs, impaired neurovascular coupling. Notably, caveolae function in aECs is independent of the endothelial NO synthase (eNOS)-mediated NO pathway. Ablation of both caveolae and eNOS completely abolished neurovascular coupling, whereas the single mutants exhibited partial impairment, revealing that the caveolae-mediated pathway in aECs is a major contributor to neurovascular coupling. Our findings indicate that vasodilation is largely mediated by endothelial cells that actively relay signals from the central nervous system to SMCs via a caveolae-dependent pathway.


Conflict of interest statement

Competing Interests:

The authors declare no competing financial interests.

Figures

Extended Data Fig. 1.
Extended Data Fig. 1.. In vivo two photon imaging of neurovascular coupling in the barrel cortex and retrosplenial cortex.
a, Setup of the in vivo microscopy. Awake mice with cranial windows over the barrel cortex are head-fixed and allowed to move on a foam ball. Whisker stimulator (arrow) is used for brushing whiskers to evoke neural activity in the barrel cortex. (b-g) Imaging in the barrel cortex. b, Hydrazide injection in Thy1:GCaMP6s mice allows for simultaneous imaging of neural activity (green) and arteriolar dilation (magenta). Two-photon imaging of arterioles and neural activity before (left) and after (right) whisker stimulation. Hashes indicate the baseline diameter at time = 0 sec. c, Time-course of change in arteriolar dilation (magenta) and GCaMP6s fluorescence (green). Orange bar signifies the period of whisker stimulation. d, Two-photon imaging of arterioles (magenta) and capillary blood flow (blue). After intravenous injection of quantum dots, the plasma is bright whereas the red blood cells are dark. e, High magnification of a capillary outlined by the red box in (d). Minimizing the image size increases the temporal resolution to ~610 Hz or 1.6 msec per frame. f, Kymographs of capillary blood flow during baseline (left) and whisker stimulation (right). Kymographs were generated from the parallel line scan (red line) of the capillary blood flow in (e). g, Time-course of change in red blood cell velocity. h. Time-course of change in arteriolar dilation in the barrel cortex (black, n= 78 arterioles; 3 mice) and in the retrosplenial cortex (red, n=54, 3 mice). (i) max % change in arteriolar dilation upon whisker stimulus in these two brain regions upon whisker stimulus. The orange bar signifies the period of whisker stimulation. All data is mean ± s.e.m. Statistical significance was determined by a nested unpaired, two-tailed t-test for (i).
Extended Data Fig. 2.
Extended Data Fig. 2.. Cav1 knockout mice have impaired vasodilation in both pial arteries and penetrating arterioles diving deep into the parenchyma.
a, 3D volume rendering of a two-photon imaged site in Cav1+/+ mouse barrel cortex—from the pial surface to a depth of ~400 μm. The lumen of all vessels is filled with quantum dots (blue) and arterioles are labeled with Hydrazide (magenta). The reason the deepest imaged bin is at 300 μm because we see the appearance of the Hydrazide start at 300μm, indicating this is at the start of the arteriolar vessels. This observation is also consistent with a previous publication that characterized Hydrazide as an arteriolar vessel marker. Gray slices correspond to z cross-sections shown per depth. Independent replications for (a) are performed in 5 wildtype mice. b,c, Time-course of change in arteriolar dilation in the barrel cortex from Cav1+/+ (n= 5 mice, 10–15 arterioles per depth) (b) and Cav1−/− mice (n= 5 mice, 10–15 arterioles per depth) (c). d, Max % change in arteriolar dilation upon whisker stimulation between in Cav1+/+ and Cav1−/− mice at the indicated depth. Statistical significance was determined by two-way ANOVA with a post hoc Bonferroni multiple comparison adjustment for (d). All data is mean ± s.e.m. We compared the max % change in arteriolar dilation upon whisker stimulation between Cav1+/+ and Cav1−/− mice at each depth and also compared the responses across depth within the same genotype.
Extended Data Fig. 3.
Extended Data Fig. 3.. Cav1 knockout mice have attenuated vasodilation but normal neural activity and neurovascular coupling kinetics.
a,b,c,d, max % change in dilation response (a), and baseline diameter (b) latency to max change in arteriolar dilation (c), time to peak dilation (d) in Cav1+/+ (n=193 arteries, 40 capillaries, 5 mice), Cav1+/− (n= 123 arteries, 40 capillaries, 5 mice), Cav1−/− mice (n=153 arteries, 31 capillaries, 5 mice). e,f, Latency to max RBC flow velocity (e) and time to peak RBC flow (f) in Cav1+/+ (n=193 arteries, 40 capillaries, 5 mice), Cav1+/− (n= 123 arteries, 40 capillaries, 5 mice), Cav1−/− mice (n=153 arteries, 31 capillaries, 5 mice). g,h, max % change in GCaMP6s (g) and latency to peak change in GCaMPs (h) in Cav1+/+; Thy1:GCaMP6s (n=78 field of views of the neuropils, 5 mice) and Cav1−/−; Thy1:GCaMP6s (n=78 neuropils, 5 mice). Each circle represents an individual trial of GCaMP6s signal. i, Baseline diameter to absolute max diameter response during whisker stimulation in Cav1+/+ and Cav1−/− mice. j, Tail-cuff blood pressure measurements between Cav1+/+ (n= 5 mice) and Cav1−/− mice (n= 5 mice). Statistical significance was determined by a one-way nested ANOVA with a post hoc Bonferroni multiple comparison adjustment for (a,b,c,d,e,f), a nested unpaired, two-tailed t-test for (g,h), and two-tailed Mann–Whitney U test for (j). All data is mean ± s.e.m.
Extended Data Fig. 4.
Extended Data Fig. 4.. Cav1 mutant mice exhibit normal smooth muscle cell integrity and function.
a, In vivo two-photon microscopy images of Hydrazide (magenta) and DsRed (red) from Cav1+/+, NG2:DsRED+ and Cav1−/−, NG2:DsRED+ mice. b, Quantification of DsRED+ smooth muscle cells per 100 μm as shown in (a) in Cav1+/+ (n= 3 mice, 27 arterioles) and Cav1−/− (n= 3 mice, 28 arterioles). c, Immunostaining for SMC contractile proteins, including SMA, Myh11, Tagln and Desmin on brain arterioles from Cav1+/+ and Cav1−/− mice. d-g, Normalized fluorescence quantification of the various contractile proteins from Cav1+/+ and Cav1−/− mice. h, Still frame images of arterioles labeled with Hydrazide (magenta) in ex vivo acute brain slices from Cav1+/+ and Cav1−/− mice using two-photon microscopy. Left image shows arterioles during baseline, middle image shows during U46619 (thromboxane agonist) treatment and right image shows during DEA-NONOate (NO donor) treatment. White hashes outline the arterioles during baseline based on time = 0 min. i,j, Quantification of max arteriolar contraction by U46619 (i) and max arteriolar dilation by DEA-NONOate (j) on acute brain slices from Cav1+/+ (n= 5 mice, 19 arterioles) and Cav1−/− (n= 5 mice, 22 arterioles). k, in vivo images of arterioles labeled with Hydrazide (magenta) from Cav1+/+ and Cav1−/− mice using two-photon microscopy. Left image shows arterioles during baseline and right shows during DEA-NONOate superfusion. White hashes outline the arterioles during baseline based on time =0 sec. l, Quantification of max arteriolar dilation during DEA-NONOate superfusion in vivo (n= 5 mice for both genotypes). Statistical significance was determined by nested, unpaired, two-tailed t-test for (b,d,e,f,g,i,j) and by two-tailed Mann–Whitney U test for (l). Data shown as mean ± s.e.m.
Extended Data Fig. 5.
Extended Data Fig. 5.. Caveolae in CNS aECs are abolished in aEC conditional Cav1 knockout mice.
a, Immunostaining of adult brain sections for endothelial cells (Icam2, green), smooth muscle cells (SMA, magenta) and Cav1 (red) from control (BMX:CreER−; Cav1+/fl) and aEC-specific conditional Cav1 mutant (BMX:CreER+; Cav1−/fl) mice. Arrows point to aECs. b, EM images of CNS aECs and SMCs from control and aEC-specific conditional Cav1 mutant mice. Arrowheads point to caveolae. L, Lumen. aEC, arteriolar endothelial cells, SMC, smooth muscle cells. c, Quantification of mean normalized immunofluorescence of Cav1 in aECs from control (n= 5 mice) and aEC-specific conditional Cav1 mutant mice (n=5 mice). d, Quantification of the mean vesicular density in aECs and smooth muscle cells between control (n= 4 mice, 20 arterioles) and aEC-specific conditional Cav1 mutant mice (n=5 mice, 22 arterioles). Statistical significance was determined by Mann Whitney test for (c) and nested, unpaired, two-tailed t-test for (d,e,f). Data are shown as mean ± s.e.m.
Extended Data Fig. 6.
Extended Data Fig. 6.. Conditional aEC-specific and SMC Cav1 knockout mice have normal neurovascular coupling kinetics.
a, Baseline diameter to absolute max diameter response during whisker stimulation in control, BMX:CreER-; Cav1+/fl; and mutant, BMX:CreER+; Cav1−/fl mice. b, Quantification of time to peak arteriolar dilation in (BMX:CreER-; Cav1+/fl; n=7 mice, 234 arterioles) and aEC-specific conditional Cav1 mutant (BMX:CreER+; Cav1−/fl; n=5 mice; 202 arterioles) mice. c, Quantification of latency to peak RBC flow velocity in (BMX:CreER−; Cav1+/fl; n n=7 mice; 58 capillaries) and aEC-specific conditional Cav1 mutant (BMX:CreER+; Cav1-/fl; n=5 mice; 25 capillaries) mice. d, Quantification of time to peak RBC flow velocity in (BMX:CreER−; Cav1+/fl; n=7 mice, 127 capillaries) and aEC-specific conditional Cav1 mutant (BMX:CreER+; Cav1−/fl; n=5 mice; 94 capillaries) mice. e, Baseline diameter to absolute max diameter response during whisker stimulation in control, Myh11:CreER-; Cav1+/fl; and mutant, Myh11:CreER+; Cav1−/fl mice. f, Quantification of time to peak arteriolar dilation in (Myh11:CreER−; Cav1+/fl; n=5 mice, 193 arterioles) and SMC conditional Cav1 mutant (Myh11:CreER+; Cav1−/fl; n=5 mice; 180 arterioles) mice. g, Quantification of latency to RBC flow in (Myh11:CreER−; Cav1+/fl; n=5 mice; 36 capillaries) and SMC conditional Cav1 mutant (Myh11:CreER+; Cav1−/fl; n=5 mice; 26 capillaries) mice. h, Quantification time to peak RBC flow velocity in (Myh11:CreER−; Cav1+/fl; n=5 mice; 75 capillaries) and SMC conditional Cav1 mutant (Myh11:CreER+; Cav1−/fl; n=5 mice; 75 capillaries) mice. Statistical significance was determined by a nested unpaired, two-tailed t-test for (b-d and f-h ).
Extended Data Fig. 7.
Extended Data Fig. 7.. Conditional SMC-specific Cav1 knockout mice have normal neurovascular coupling.
a, Immunostaining on brain sections for endothelial cells (Icam2, green), smooth muscle cells (SMA, magenta) and Cav1 (red) from control and SMC conditional Cav1 mutant mice. b, EM images of CNS aECs and SMCs from control and SMC conditional Cav1 mutant mice. Arrowheads point to caveolae. L, Lumen. aEC, arteriolar endothelial cells. SMC, smooth muscle cells. c, Quantification of mean normalized immunofluorescence of Cav1 in SMCs from control (n= 5 mice) and SMC-specific conditional Cav1 mutant mice (n=5 mice). d, Quantification of the mean vesicular density in aECs and smooth muscle cells between control (n= 5 mice, 23 arterioles) and SMC conditional Cav1−/− mutant mice (n=5 mice, 22 arterioles). e,f,g, Time-course of change in arteriolar dilation (e), max % change in arteriolar dilation (f) and baseline diameter (g) in control (n= 7 mice, 193 arterioles) and SMC conditional Cav1 mutant mice (n= 5 mice, 176 arterioles). h,i,j, Time-course of change in red blood cell velocity (h), max % change in red blood cell velocity (i) and baseline velocity (j) in control (n= 7 mice, 75 capillaries) and SMC conditional Cav1 mutant mice (n=5 mice, 64 capillaries). Statistical significance was determined by unpaired, two-tailed Mann–Whitney U test for (c) and a nested, unpaired, two-tailed t-test for (d,f,g,i,j). Data shown as mean ± s.e.m.
Extended Data Fig. 8.
Extended Data Fig. 8.. Cav1 mutant mice have normal levels of eNOS protein and NO in CNS aECs and Cav1, eNOS double knockout have normal baseline diameter and red blood cell flow.
a, Immunostaining on adult brain sections for endothelial cells (Pecam1, green), arterioles (SMA, magenta) and eNOS (cyan) from Cav1+/+, enos+/+, Cav1−/−, enos+/+ and Cav1+/+, enos−/− mice. Independent replications were performed on 3 mice per genotype. b, Immunostaining for (Pecam1, green) and arterioles (SMA, magenta) on brain sections from Cav1+/+, enos+/+, Cav1−/−, enos+/+ and Cav1+/+, enos−/− mice after in vivo perfusion of NO sensitive dye- DAF-2, yellow. Independent replications were performed on 4 mice per genotype. c, Quantification of eNOS immunofluorescence intensity as shown in (a) in aECs from Cav1+/+, enos+/+ (n= 3 mice, 35 images), Cav1−/−, enos+/+ (n= 3 mice, 35 images), and Cav1+/+, enos−/− (n= 3 mice, 37 images). d, Quantification of DAF-2 intensity in aECs as shown in (b) from Cav1+/+, enos+/+ (n= 4 mice, 73 images), Cav1−/−, enos+/+ (n= 4 mice, 71 images), and Cav1+/+, enos−/− (n= 4 mice, 64 images). e,f, Quantification of baseline diameter (e) and baseline velocity (f) in Cav1+/+, enos+/+ (n= 5 mice, 148 arterioles, 76 capillaries), Cav1−/−, enos+/+ (n= 5 mice, 128 arterioles, 68 capillaries), Cav1+/+, enos−/− (n= 5 mice, 137 arterioles, 73 capillaries) and Cav1−/−, enos−/− mice (n=5 mice, 139 arterioles, 74 capillaries). Statistical significance was determined by nested, unpaired, two-tailed t-test for (c,d) and nested, one-way ANOVA with a post hoc Bonferroni multiple comparison adjustment for (e,f). Data shown as mean ± s.e.m.
Extended Data Fig. 9.
Extended Data Fig. 9.. Mfsd2a is undetected in CNS arterioles in brain and retina.
a.b, Immunostaining on P5 (a) and adult (b) brain sections for endothelial cells (Pecam1, green), smooth muscle cells (SMA, magenta) and Mfsd2a (white) from wildtype mice. Blue hashes outline SMA+ arterioles. c,d, Immunostaining on P5 (c) and adult (d) retina for endothelial cells (Claudin-5, green), smooth muscle cells (SMA, magenta) and Mfsd2a (white) from wildtype mice. A- arterioles. Note that Mfsd2a is absent in nascent, distal vessel (arrows) in P5 retina in (c). e,f, Tamoxifen-treated, adult knock-in Mfsd2a:CreER+; Ai14+/fl reporter mice demonstrates that tdTomato is absent in SMA+ arterioles but present in SMA- capillaries in brain (e) and retina (f). Blue hashes and “A” indicate SMA+ arterioles. Independent replications for (a-f) were done on 5 wildtype mice.
Extended Data Fig. 10.
Extended Data Fig. 10.. Generation of a Cre-dependent Mfsd2a overexpression transgenic mouse (R26:LSL-Mfsd2a).
a, Construct of the Cre-dependent Mfsd2a overexpression knocked-in to the ROSA26 locus. Mating with ROSA26: ΦC31 recombinase mice removes the neomycin selection cassette. Subsequent mating with BMX:CreER and tamoxifen injection allows ectopic overexpression of Mfsd2a in aECs. b, PCR genotyping of Cre-dependent Mfsd2a overexpression mice. c, Quantification of latency to changes in arteriolar dilation in control (BMX:CreER−; R26:LSL-Mfsd2a/+; n=5 mice, 149 arterioles) and aEC-specific Mfsd2a overexpression (BMX:CreER+; R26:LSL-Mfsd2a/+;n=5 mice; 138 arterioles) mice. d, Quantification of time to peak arteriolar dilation in (BMX:CreER−; R26:LSL-Mfsd2a/+; n=5 mice, 149 arterioles) and aEC-specific conditional Cav1 mutant (BMX:CreER+; R26:LSL-Mfsd2a/+; n=5 mice; 138 arterioles) mice. e, Baseline diameter to absolute max diameter response during whisker stimulation in control, (BMX:CreER−; R26:LSL-Mfsd2a/+; n=5 mice, 149 arterioles); and (BMX:CreER+; R26:LSL-Mfsd2a/+; n=5 mice; 138 arterioles) mice. f, Immunostaining on adult retinas for endothelial cells (isolectin, green), smooth muscle cells (SMA, magenta) and Mfsd2a (white) from control and aEC-specific Mfsd2a overexpression mice. Independent replications for (f) were done on 3 mice per genotype. Statistical significance was determined by a nested unpaired, two-tailed t-test for (c and d).
Fig 1.
Fig 1.. CNS arterioles have abundant caveolae.
a, EM image of a CNS capillary. Pseudocolors highlight different cells: capillary endothelial cell (cEC) (purple), pericyte (teal), astrocyte end-foot (blue), red blood cell (RBC, red), lumen (L, white) and neuropil (yellow). Bottom shows an inverted, zoomed image of the boxed area in cEC. b, EM image of a CNS arteriole. Pseudocolors highlight different cells: aEC (purple), smooth muscle cell (SMC, green), astrocyte end-foot (blue) and neuropil (yellow). Bottom shows a zoomed image of boxed area in aEC. Arrowheads point to vesicles in (a,b). c, EM images of aECs and SMCs from Cav1+/+ and Cav1−/− mice. Arrowheads point to caveolae. d, Quantification of the mean vesicular density between cECs and aECs from wildtype mice (n = 5 mice, 46 capillaries and 24 arterioles). e,f, Quantification of the mean vesicular density in aECs (e) and SMCs (f) between Cav1+/+ (n=5 mice, 20 arterioles) and Cav1−/− mice (n=5 mice, 28 arterioles). Statistical significance was determined by nested, unpaired, two-tailed t-test for (d,e,f). Data are shown as mean ± s.e.m.
Fig 2.
Fig 2.. Caveolae in CNS aECs specifically are required for neurovascular coupling.
a, Still frame images of pial arteries during neurovascular coupling in Cav1+/+ and Cav −/− mice using in vivo two-photon microscopy. Top images show Hydrazide-stained arterioles during baseline and whisker stimulation. White hashes outline the arterioles during baseline period. Bottom images show the kymographs of the arteriolar dilation, which were generated by transverse line scans (orange lines in top images). The gray rectangle in the kymograph represents the whisker stimulation period. b, Kymographs of RBC flow in capillaries for Cav1+/+ and Cav1−/− mice. Dark streaks represent red blood cells, blue streaks represent the fluorescent tracer-filled capillary lumen. Left and right kymographs show RBC flow during baseline and whisker stimulation, respectively. Independent replications for (a) and (b) are listed in (c) and (d) respectively. c,d,e,f, Time-course of change in arteriolar dilation (c), change in red blood cell velocity (d), max % change in arteriolar dilation (e) and red blood cell velocity (f) in in Cav1+/+ (n= 5 mice, 196 arterioles, 77 capillaries) and Cav1−/− mice (n=5 mice, 194 arterioles, 79 capillaries). g,h,i,j, Time-course of change in arteriolar dilation (g), change in red blood cell velocity (h), max % change in arteriolar dilation (i) and red blood cell velocity (j) in control (BMX:CreER−;Cav1+/fl; n= 7 mice, 260 arterioles, 122 capillaries) and aEC conditional Cav1 knockout mice (BMX:CreER+;Cav1−/fl; n= 5 mice, 193 arterioles, 94 capillaries). Statistical significance was determined by nested, unpaired, two-tailed t-test for for (e,f,i,j). Data are shown as mean ± s.e.m.
Figure 3.
Figure 3.. Caveolae in aECs mediate neurovascular coupling independently of eNOS.
Time-course of change in arteriolar dilation (a), change in red blood cell velocity (b), max % change in arteriolar dilation (c) and red blood cell velocity (d) in Cav1+/+, enos+/+ (n= 5 mice, 148 arterioles, 76 capillaries), Cav1−/−, enos+/+ (n= 5 mice, 128 arterioles, 68 capillaries), Cav1+/+, enos−/− (n= 5 mice, 137 arterioles, 73 capillaries) and Cav1−/−, enos−/− mice (n=5 mice, 139 arterioles, 74 capillaries). Statistical significance was determined by nested, one-way ANOVA with a post hoc Bonferroni multiple comparison adjustment for (c,d). Data shown as mean ± s.e.m.
Fig 4.
Fig 4.. CNS arterioles lack Mfsd2a expression and ectopic expression of Mfsd2a in aECs downregulates caveolae and attenuates neurovascular coupling.
a, Immunostaining for Claudin-5, Hydrazide, and Mfsd2a on wild type adult brain sections demonstrates that Mfsd2a is not detectable in CNS arterioles. Blue hashes outline the Hydrazide+ arterioles. b, Immunostaining on adult brain sections for Pecam1, SMA, and Mfsd2a from control (BMX:CreER−; R26:LSL-Mfsd2a/+) and aEC-specific Mfsd2a overexpression mice (BMX:CreER+; R26:LSL-Mfsd2a/+). Arrowsheads point to SMA+ arteries. d, Quantification of the normalized immunofluorescence of Mfsd2a in cECs (Hydrazide-, Claudin-5+) and aECs (Hydrazide+, Claudin-5+) (n= 5 mice, 45 images) as shown in (a). e, Quantification of normalized immunofluorescence of Mfsd2a in aECs from control (n= 4 mice, 40 images) and aEC-specific Mfsd2a overexpression mice (n=5 mice, 51 images) as shown in (b). c,f, EM images of CNS aECs and SMCs (c) and quantification of the mean vesicular density (f) in aECs and SMCs from control (n= 3 mice, 20 arterioles) and aEC-specific Mfsd2a overexpression mice (n=3 mice, 22 arterioles). L, Lumen. SMC, smooth muscle cell, arrowheads point to caveolae. g,h,i, Time-course of change in arteriolar dilation (g) and max % change in arteriolar dilation (h) and baseline diameter (i) in control (n= 7 mice, 260 arterioles) and aEC-specific Mfsd2a overexpression mice (n= 5 mice, 193 arterioles. Statistical significance was determined by nested, unpaired, two-tailed t-test for (d,e,f,h,i). Data shown as mean ± s.e.m.

References

    1. Iadecola C The Neurovascular Unit Coming of Age: A Journey through Neurovascular Coupling in Health and Disease. Neuron 96, 17–42 (2017). - PMC - PubMed
    1. Hillman EMC Coupling mechanism and significance of the BOLD signal: a status report. Annu. Rev. Neurosci. 37, 161–181 (2014). - PMC - PubMed
    1. Sweeney MD, Sagare AP & Zlokovic BV Blood-brain barrier breakdown in Alzheimer disease and other neurodegenerative disorders. Nat Rev Neurol 14, 133–150 (2018). - PMC - PubMed
    1. Kleinfeld D et al. A guide to delineate the logic of neurovascular signaling in the brain. Frontiers in neuroenergetics 3, 1 (2011). - PMC - PubMed
    1. Shen Z, Lu Z, Chhatbar PY, O’Herron P & Kara P An artery-specific fluorescent dye for studying neurovascular coupling. Nat. Methods 9, 273–276 (2012). - PMC - PubMed

Method References

    1. Pu W et al. Mfsd2a+ hepatocytes repopulate the liver during injury and regeneration. Nat Commun 7, 13369 (2016). - PMC - PubMed
    1. Madisen L et al. A robust and high-throughput Cre reporting and characterization system for the whole mouse brain. Nat. Neurosci 13, 133–140 (2010). - PMC - PubMed
    1. Madisen L et al. A toolbox of Cre-dependent optogenetic transgenic mice for light-induced activation and silencing. Nat. Neurosci 15, 793–802 (2012). - PMC - PubMed
    1. Quina LA, Harris J, Zeng H & Turner EE Specific connections of the interpeduncular subnuclei reveal distinct components of the habenulopeduncular pathway. Journal of Comparative Neurology 525, 2632–2656 (2017). - PMC - PubMed
    1. Chen T-W et al. Ultrasensitive fluorescent proteins for imaging neuronal activity. Nature 499, 295–300 (2013). - PMC - PubMed

Publication types

Substances