. 2020 Mar;579(7797):130-135.
doi: 10.1038/s41586-020-2015-4. Epub 2020 Feb 19.

ILC2s amplify PD-1 blockade by activating tissue-specific cancer immunity

Affiliations

ILC2s amplify PD-1 blockade by activating tissue-specific cancer immunity

John Alec Moral et al. Nature. 2020 Mar.

Abstract

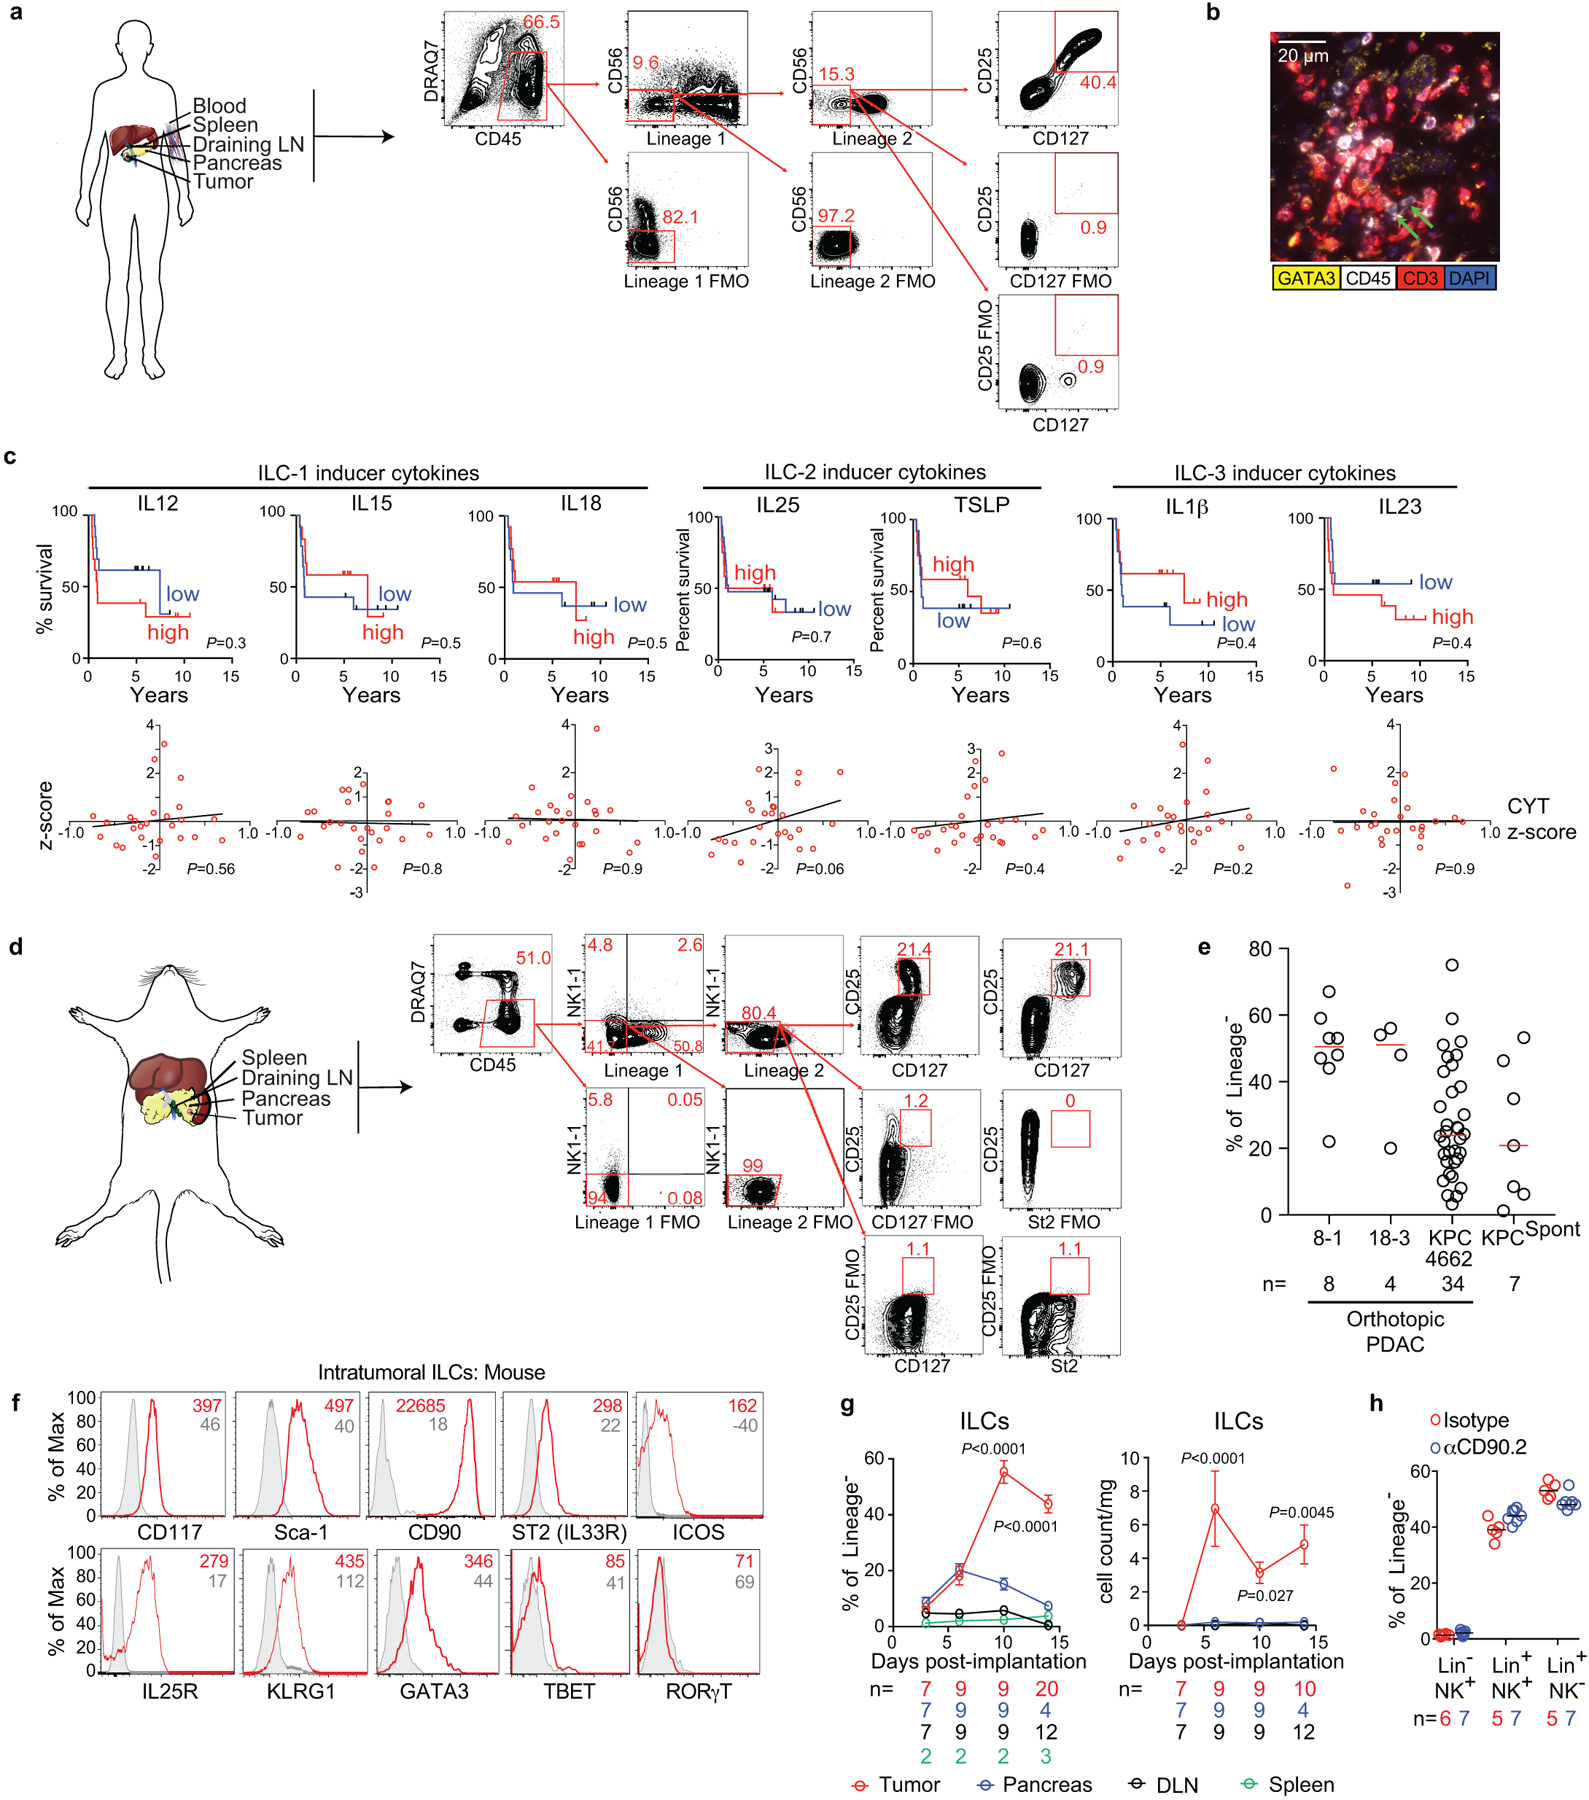
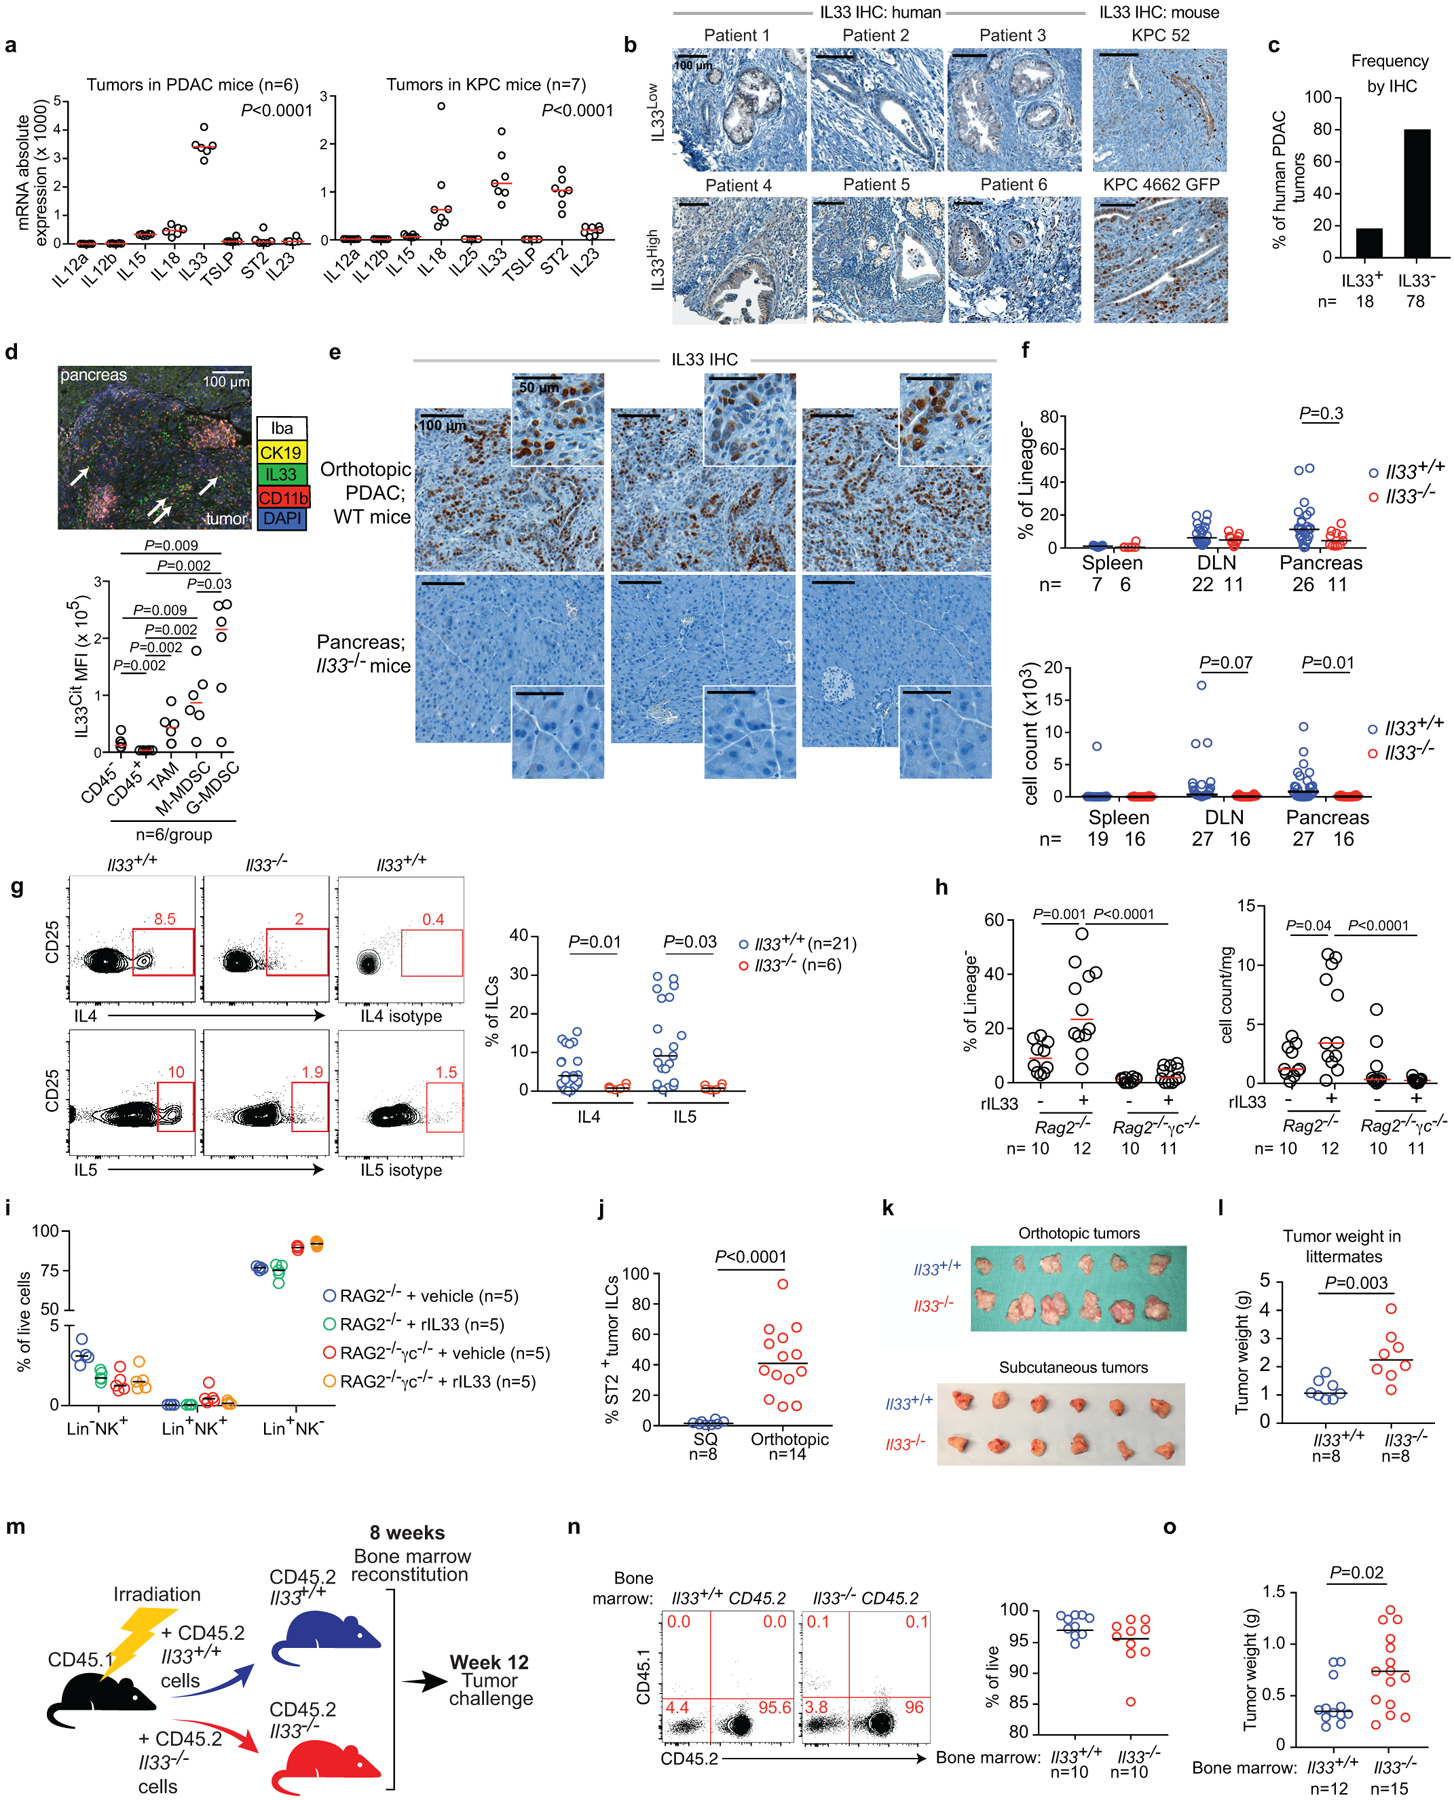
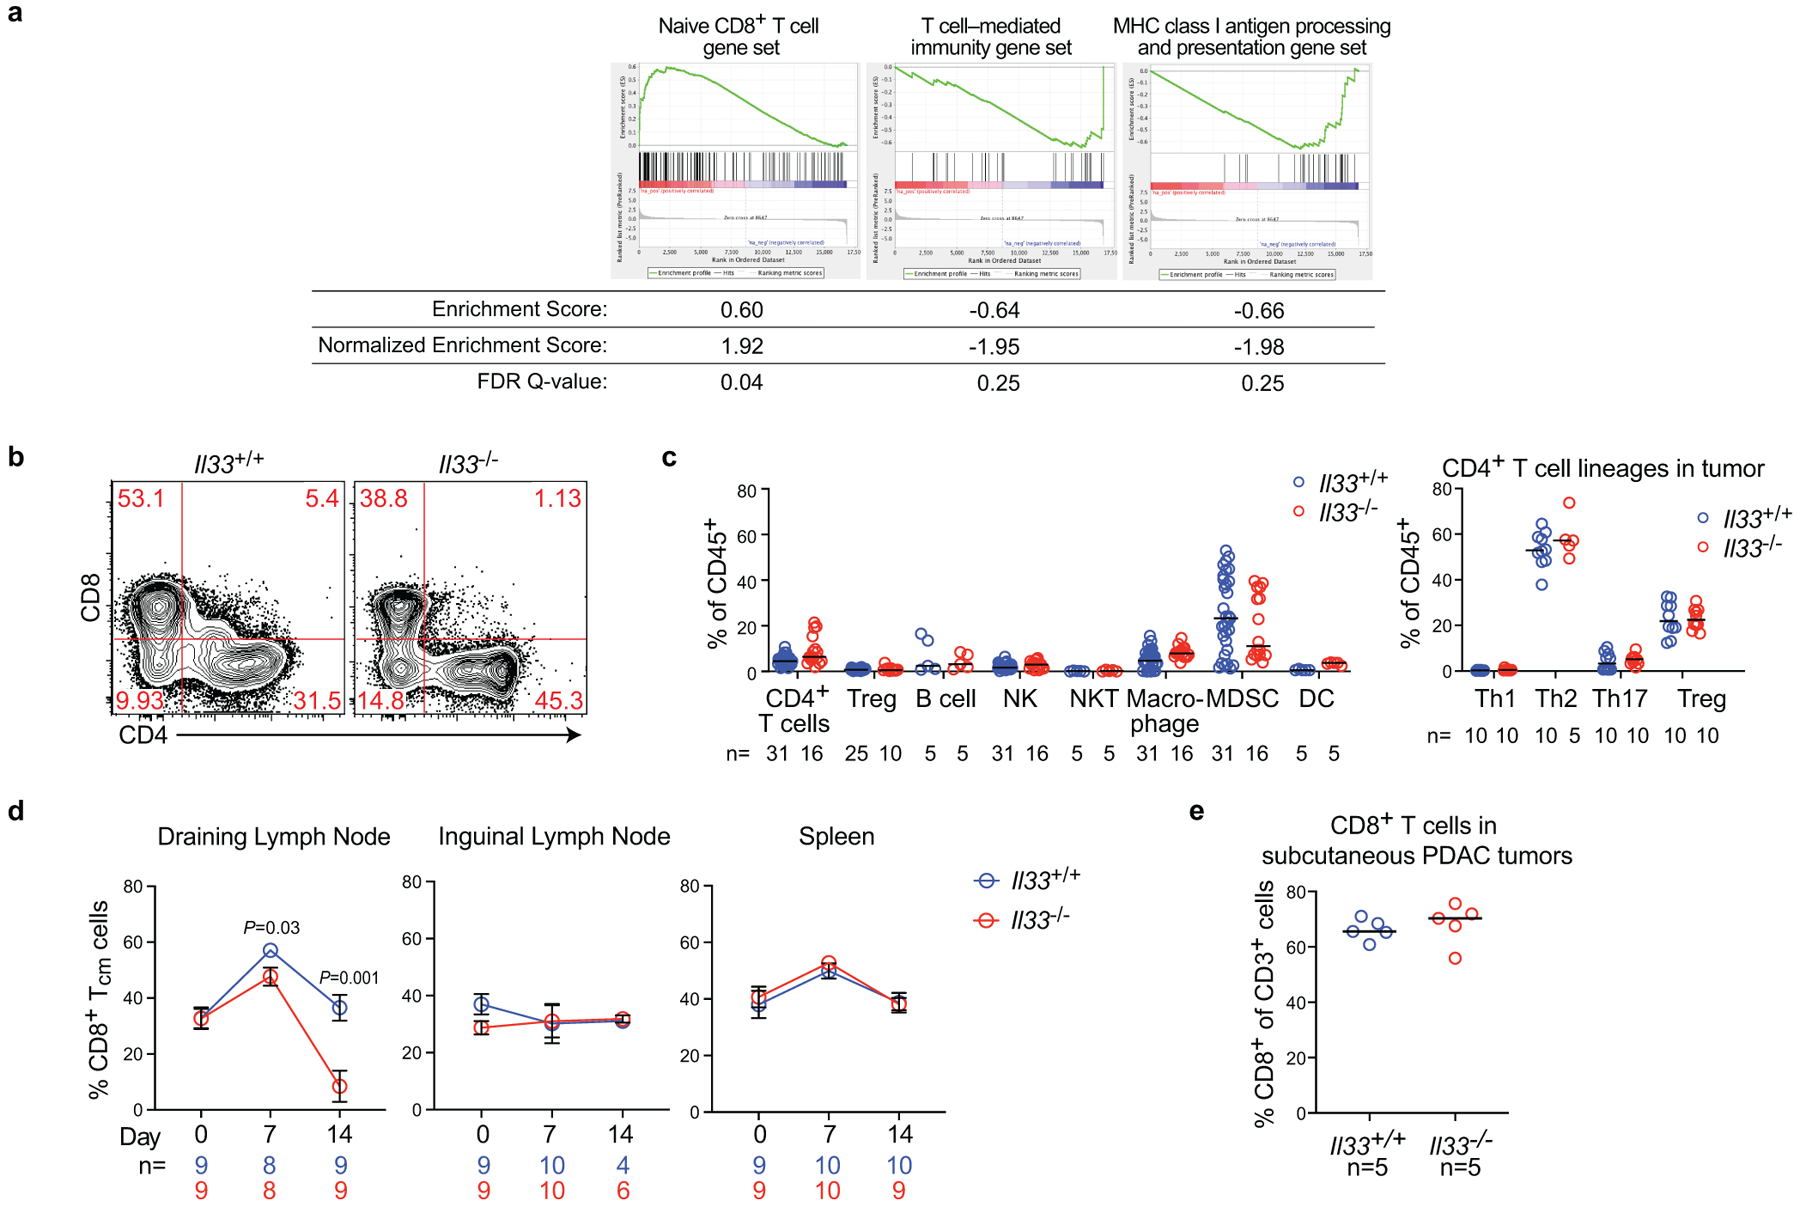
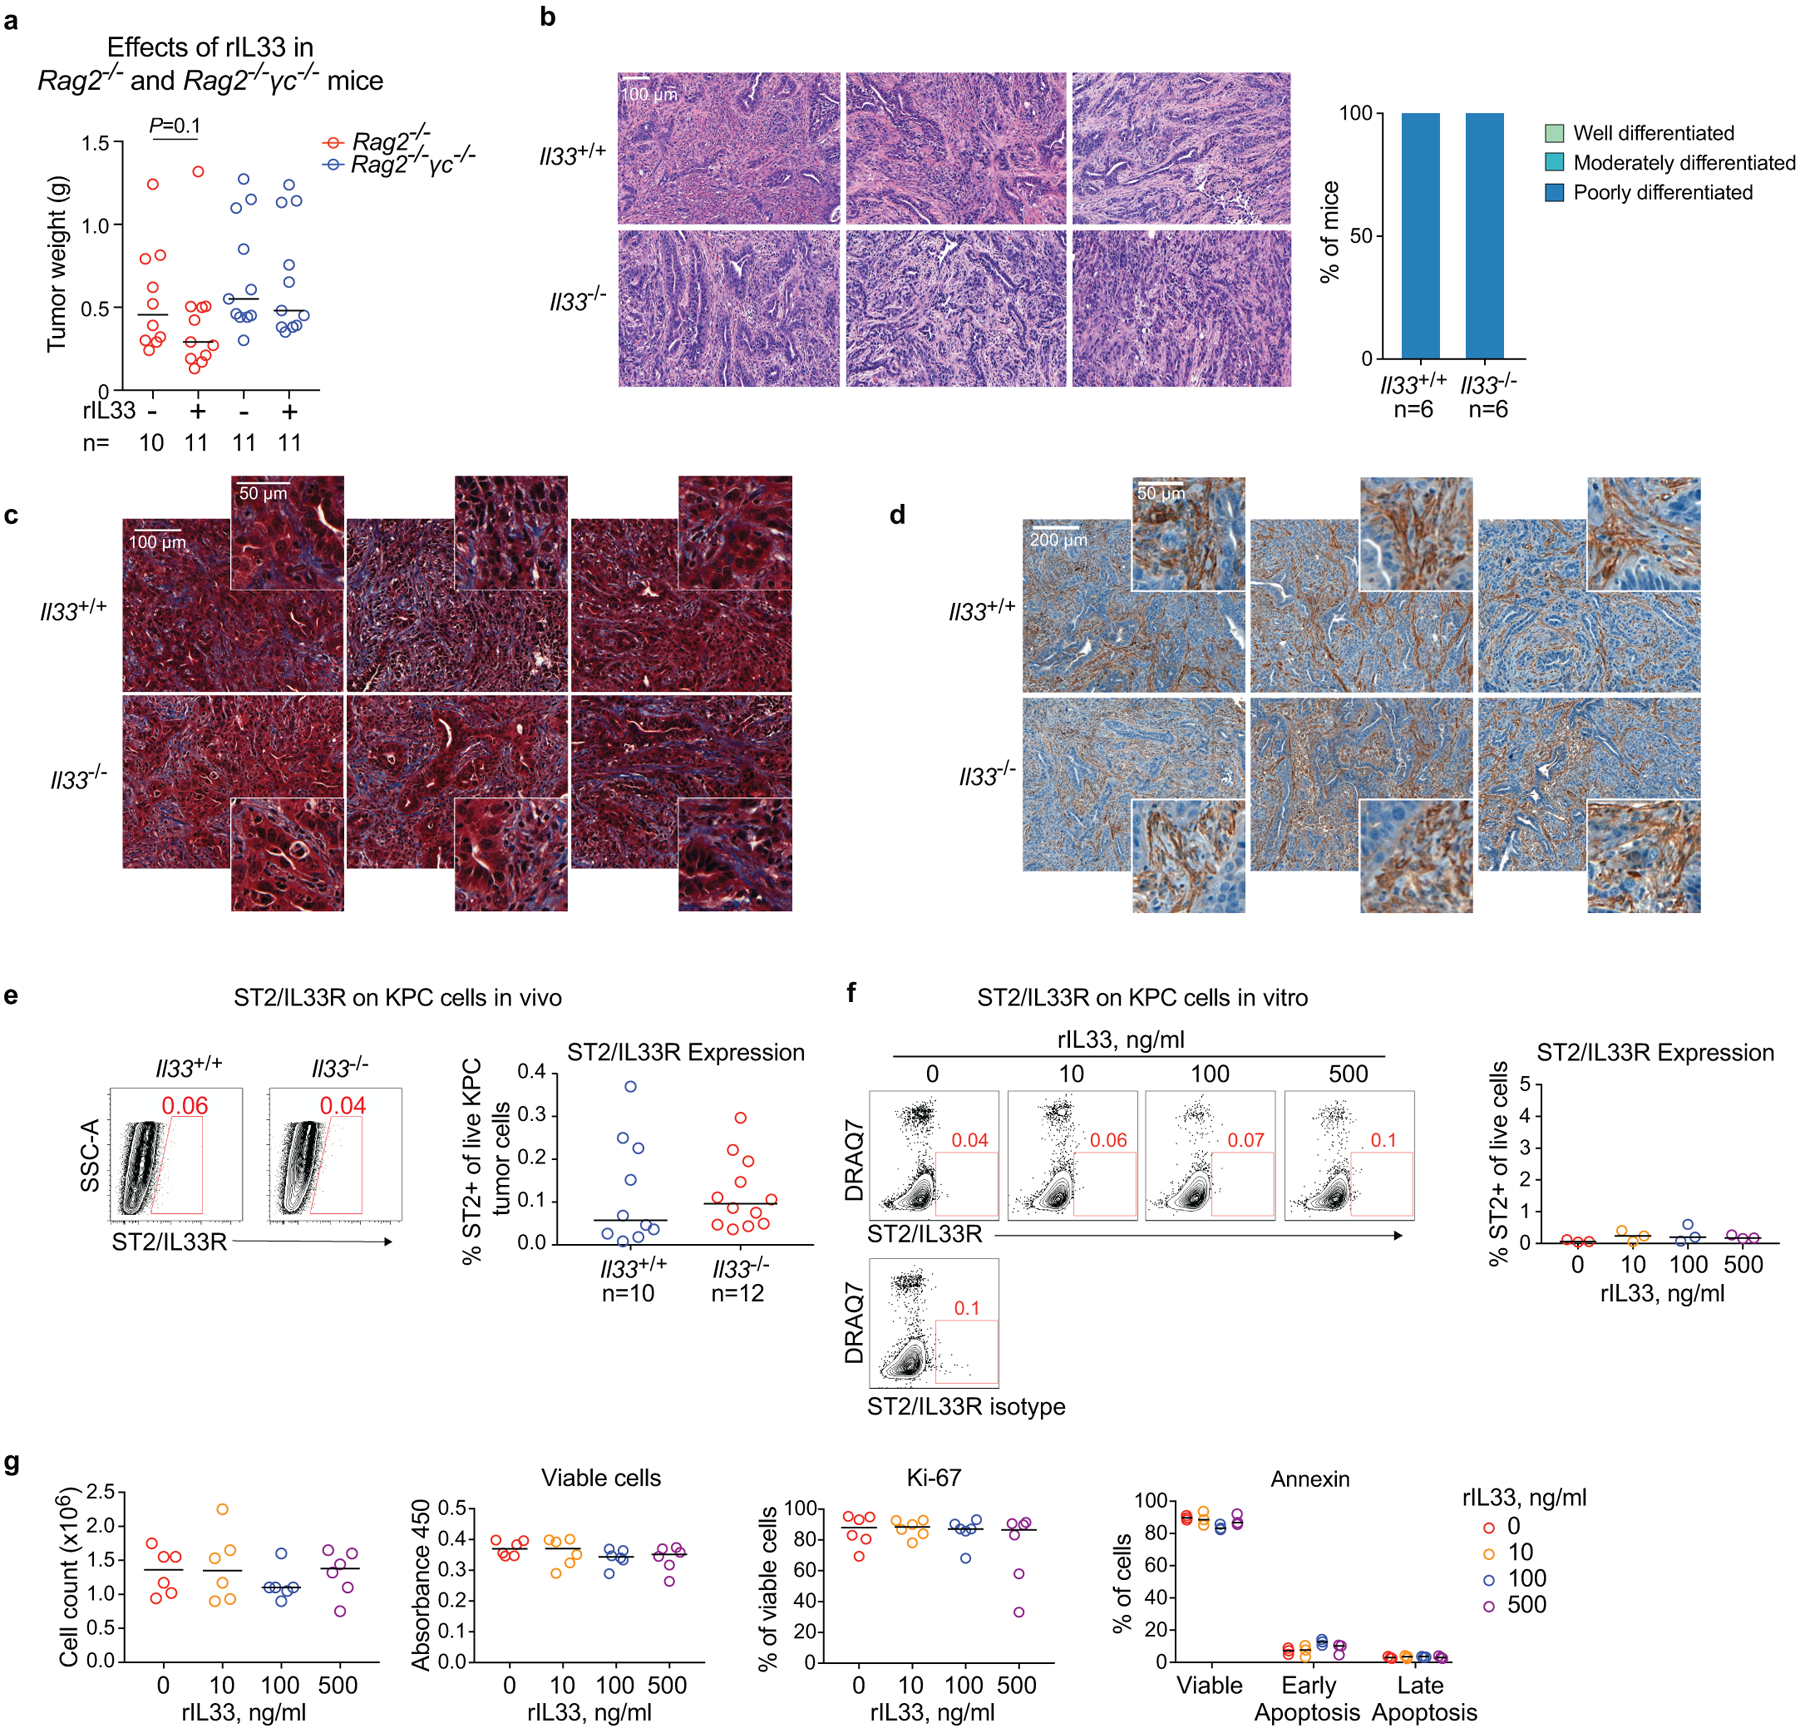
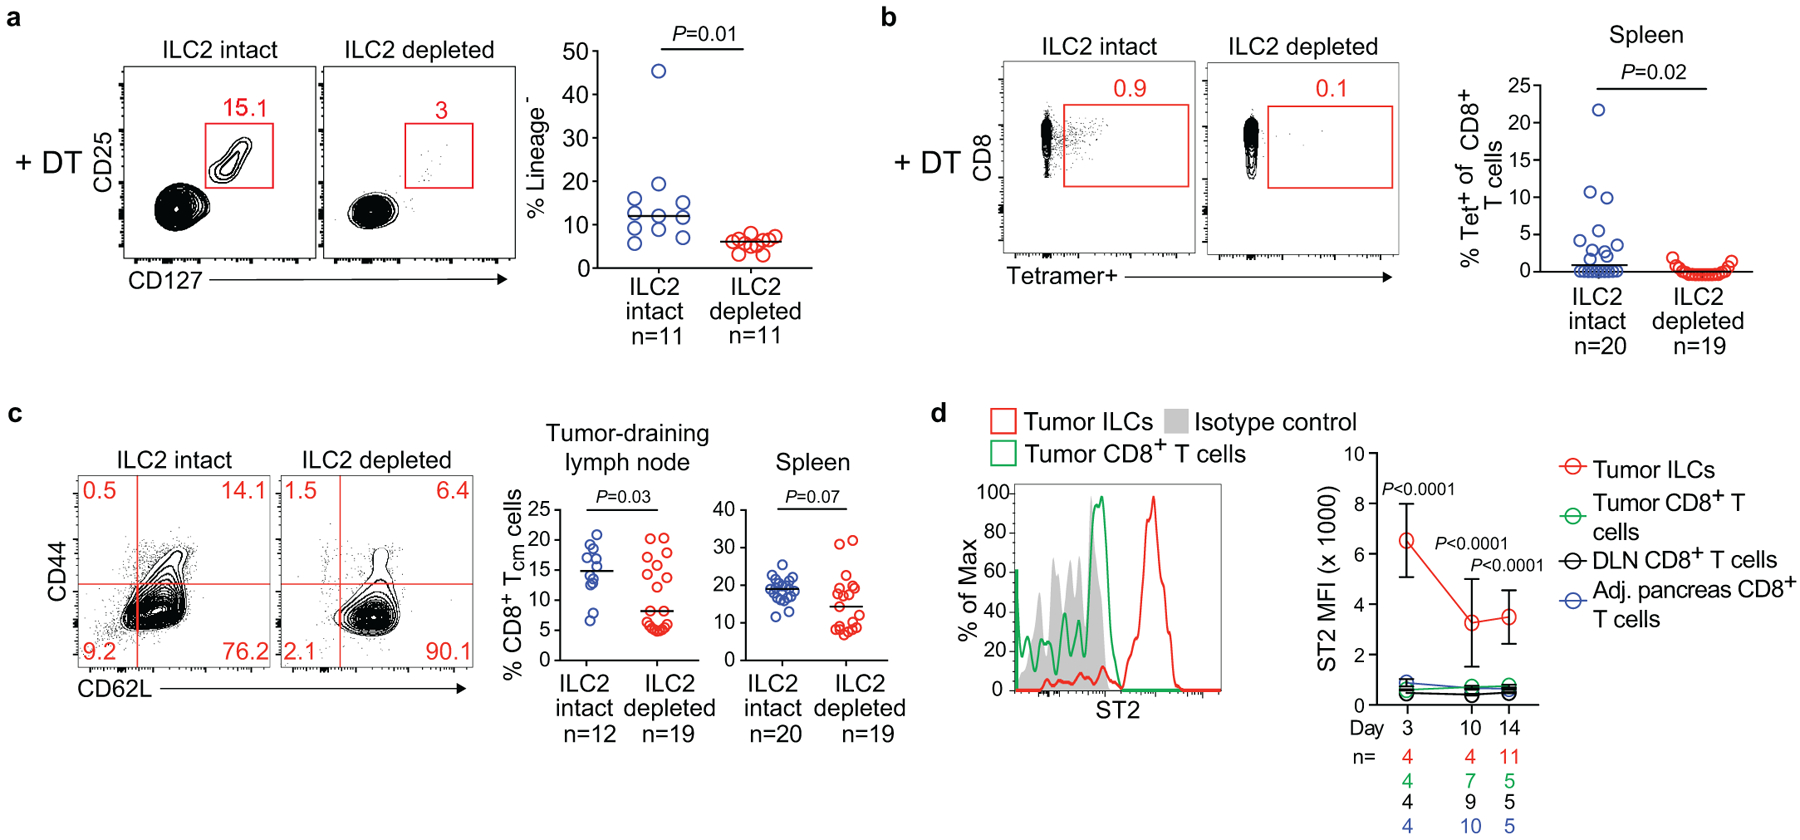
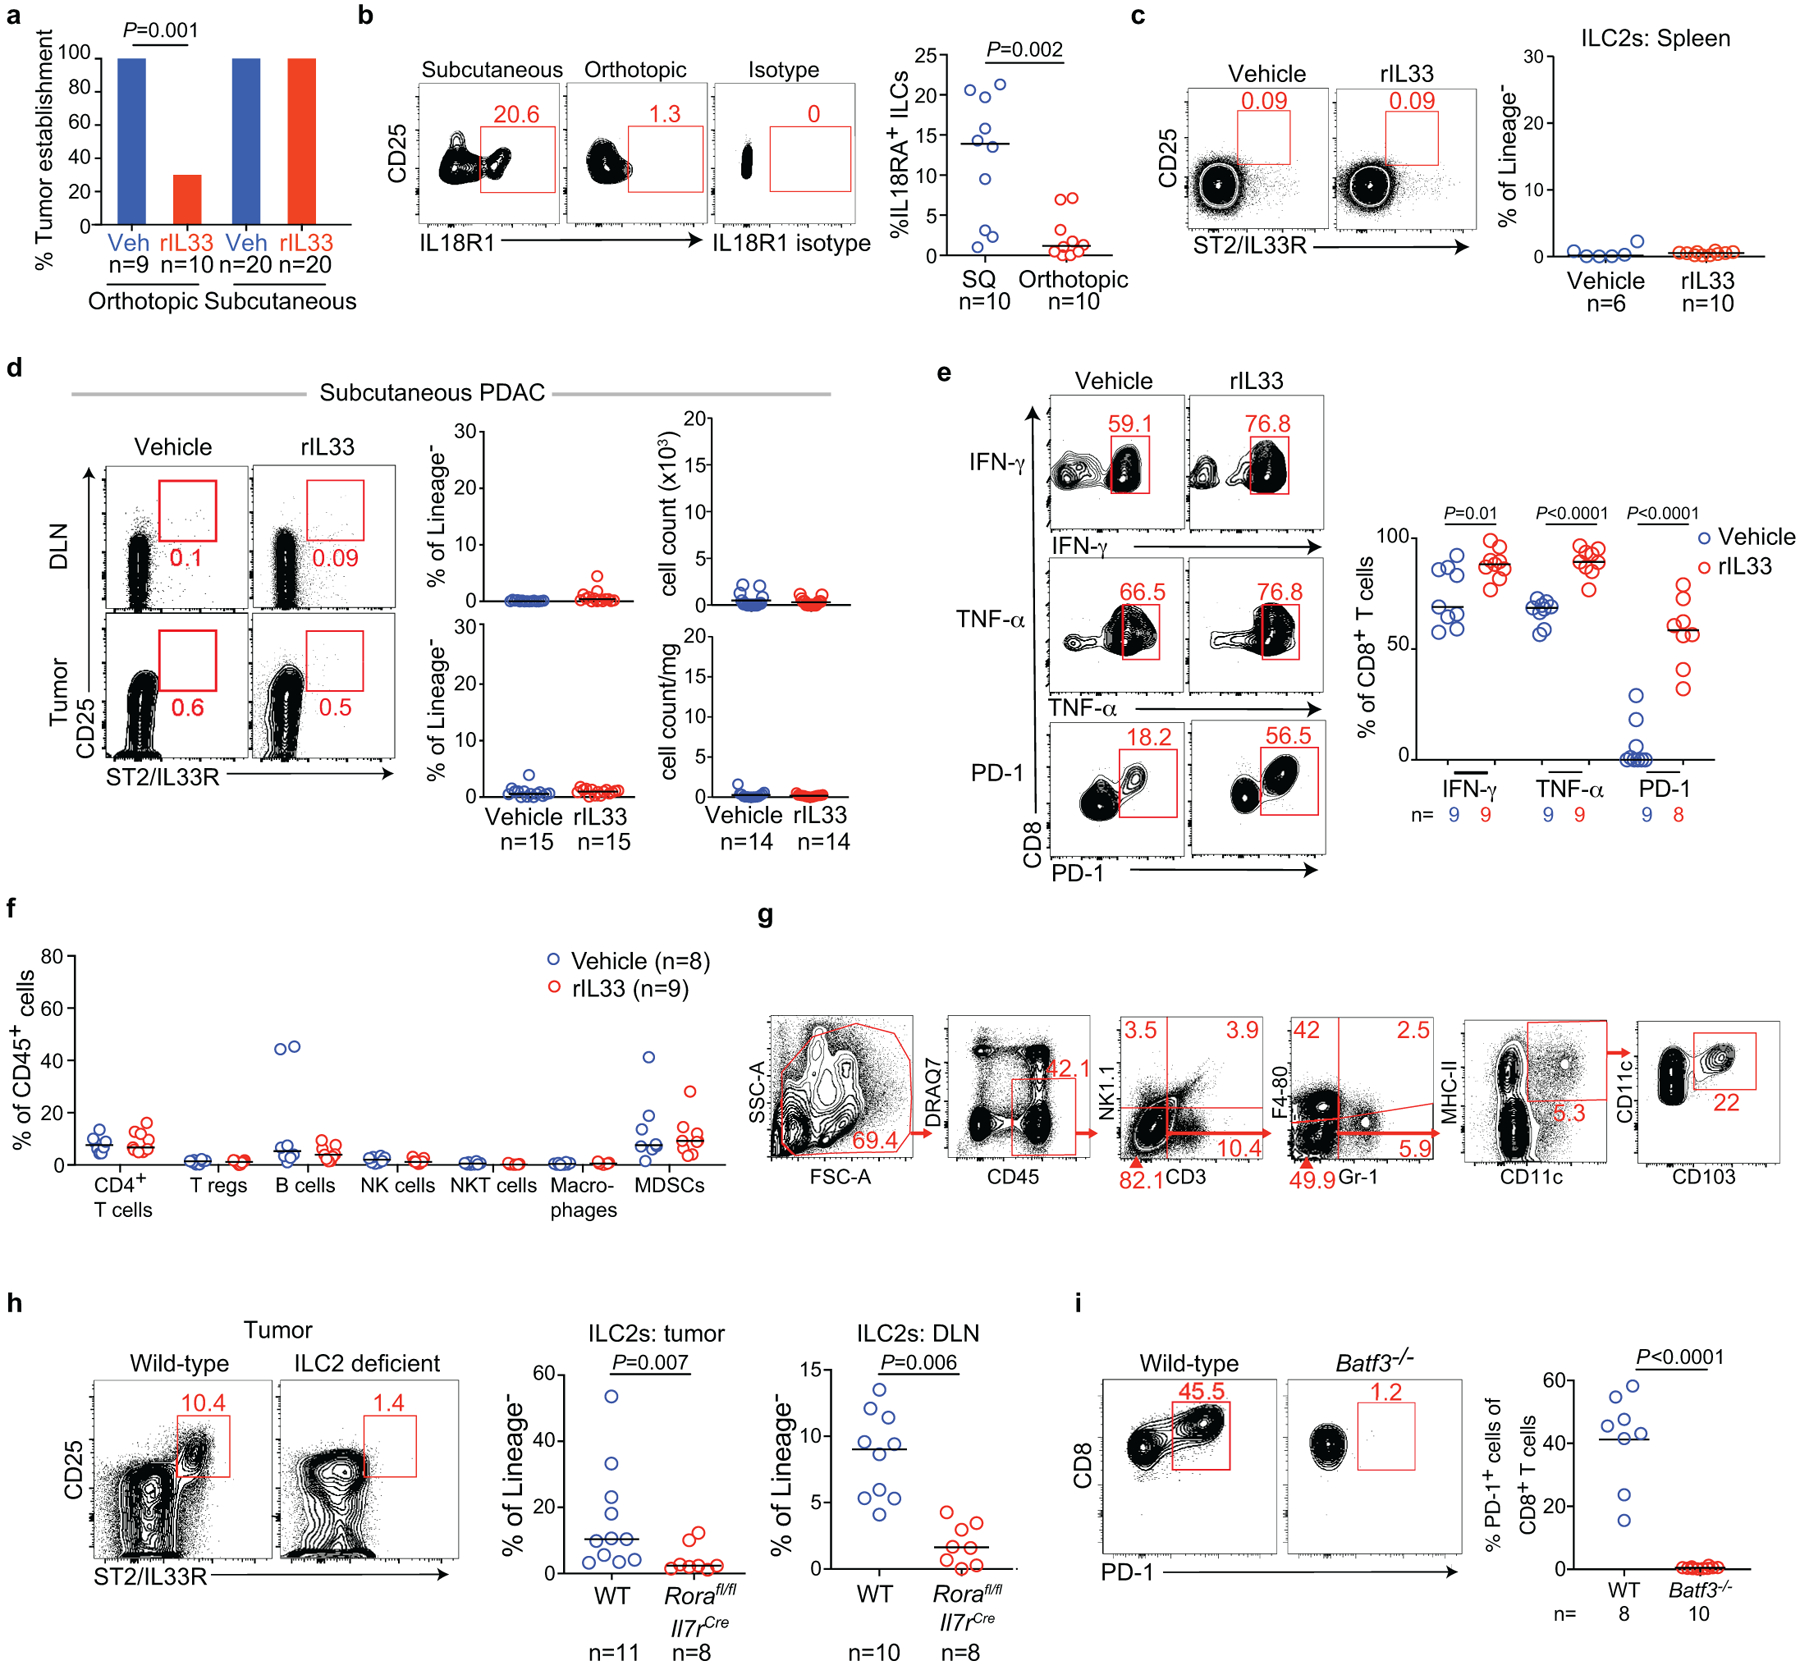
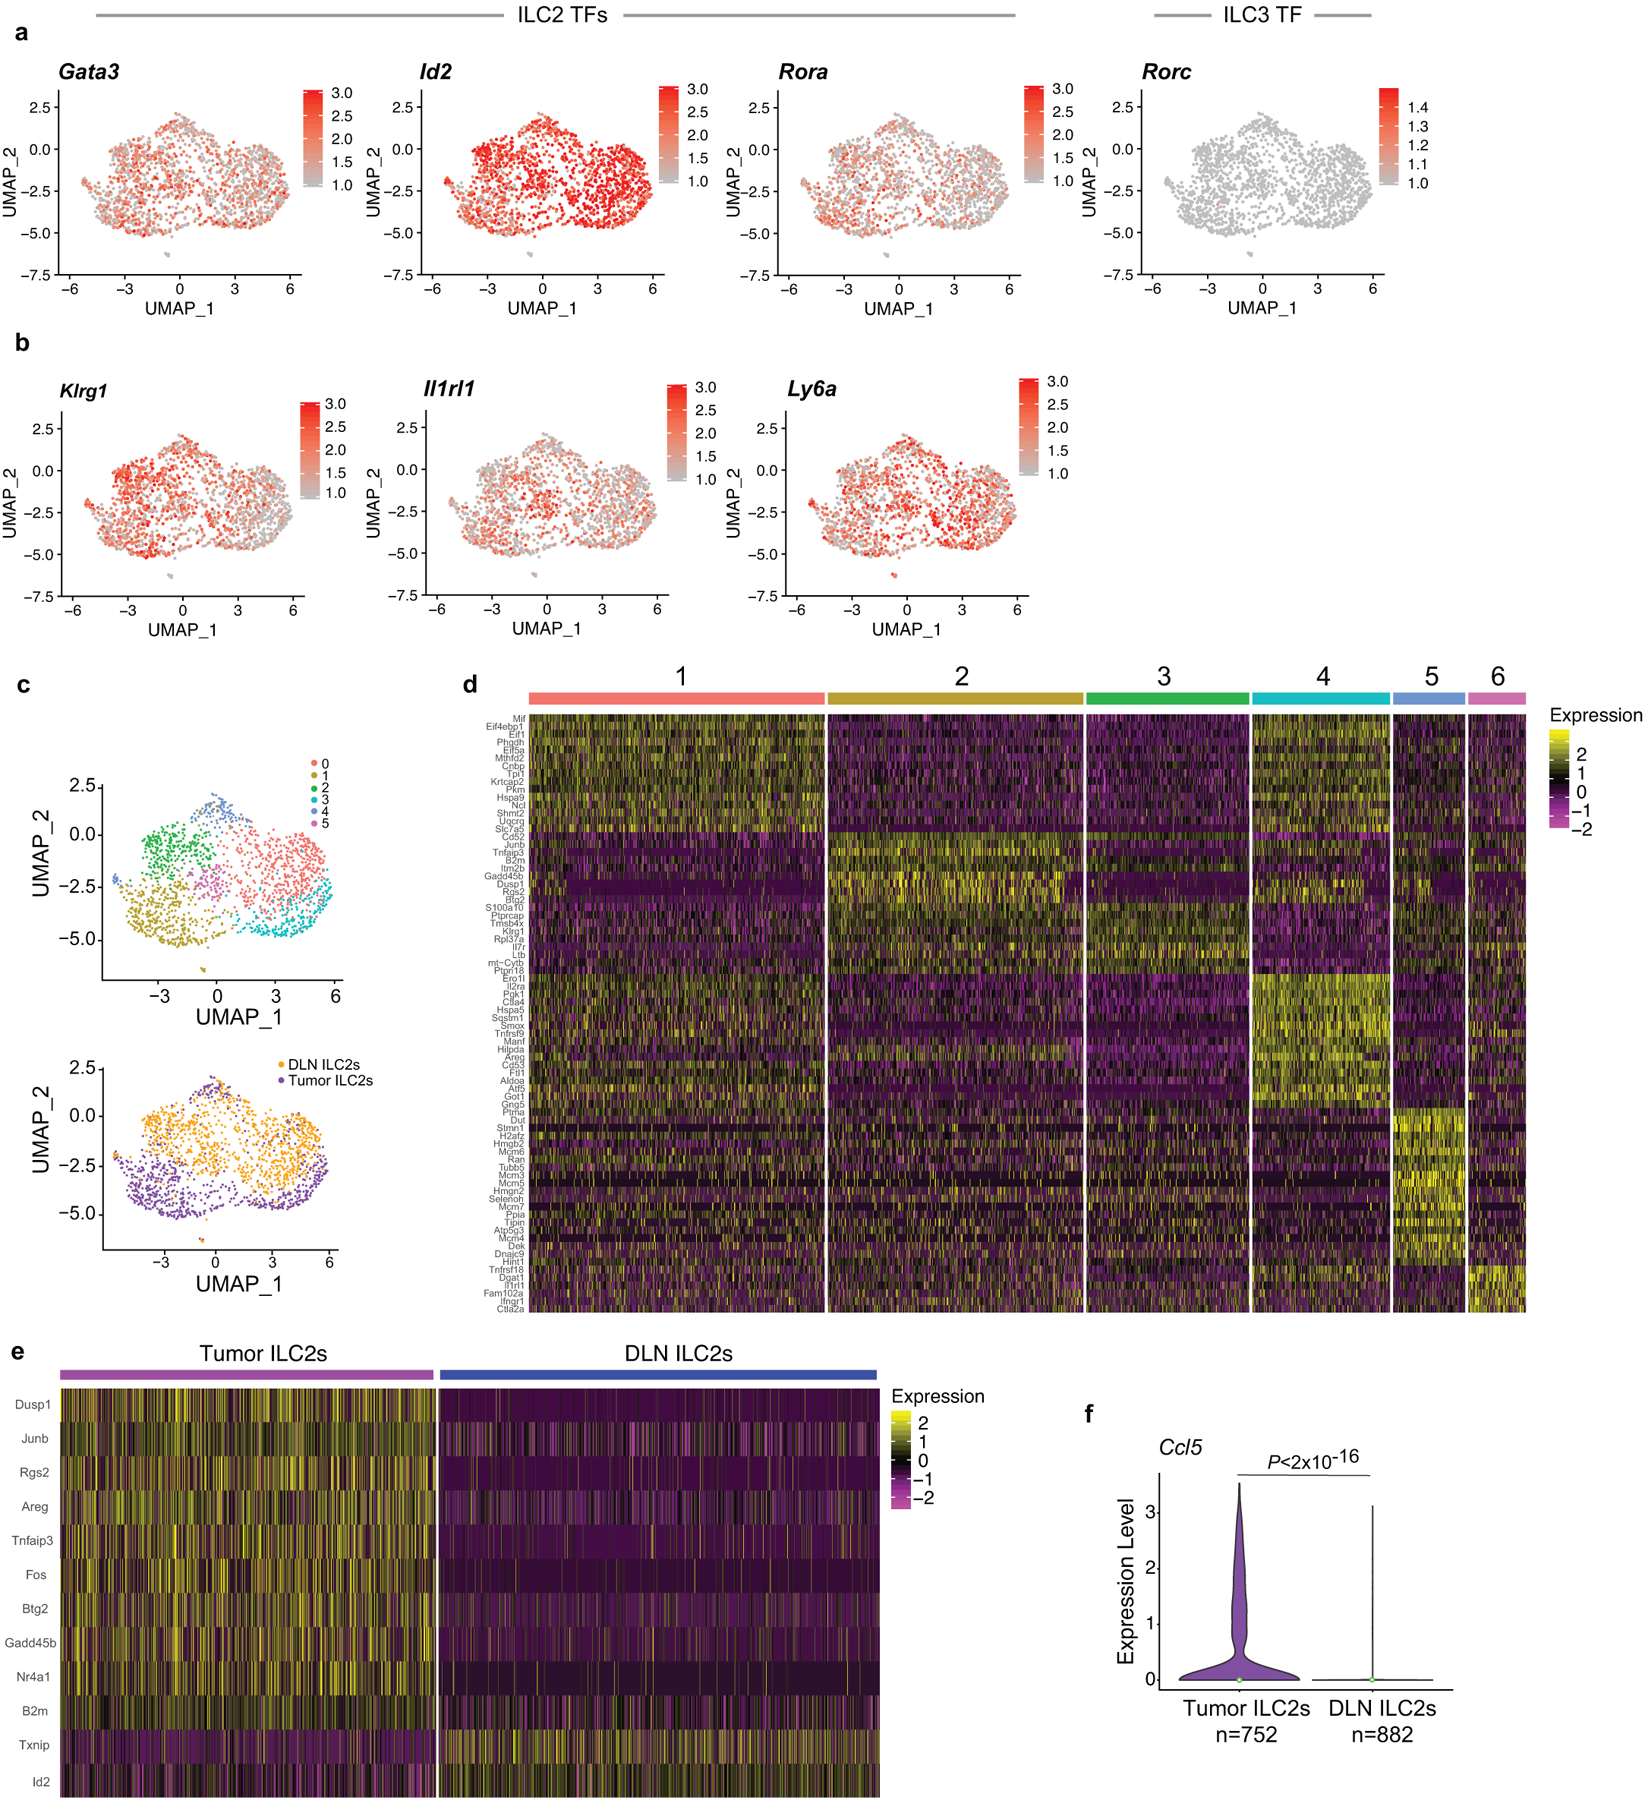
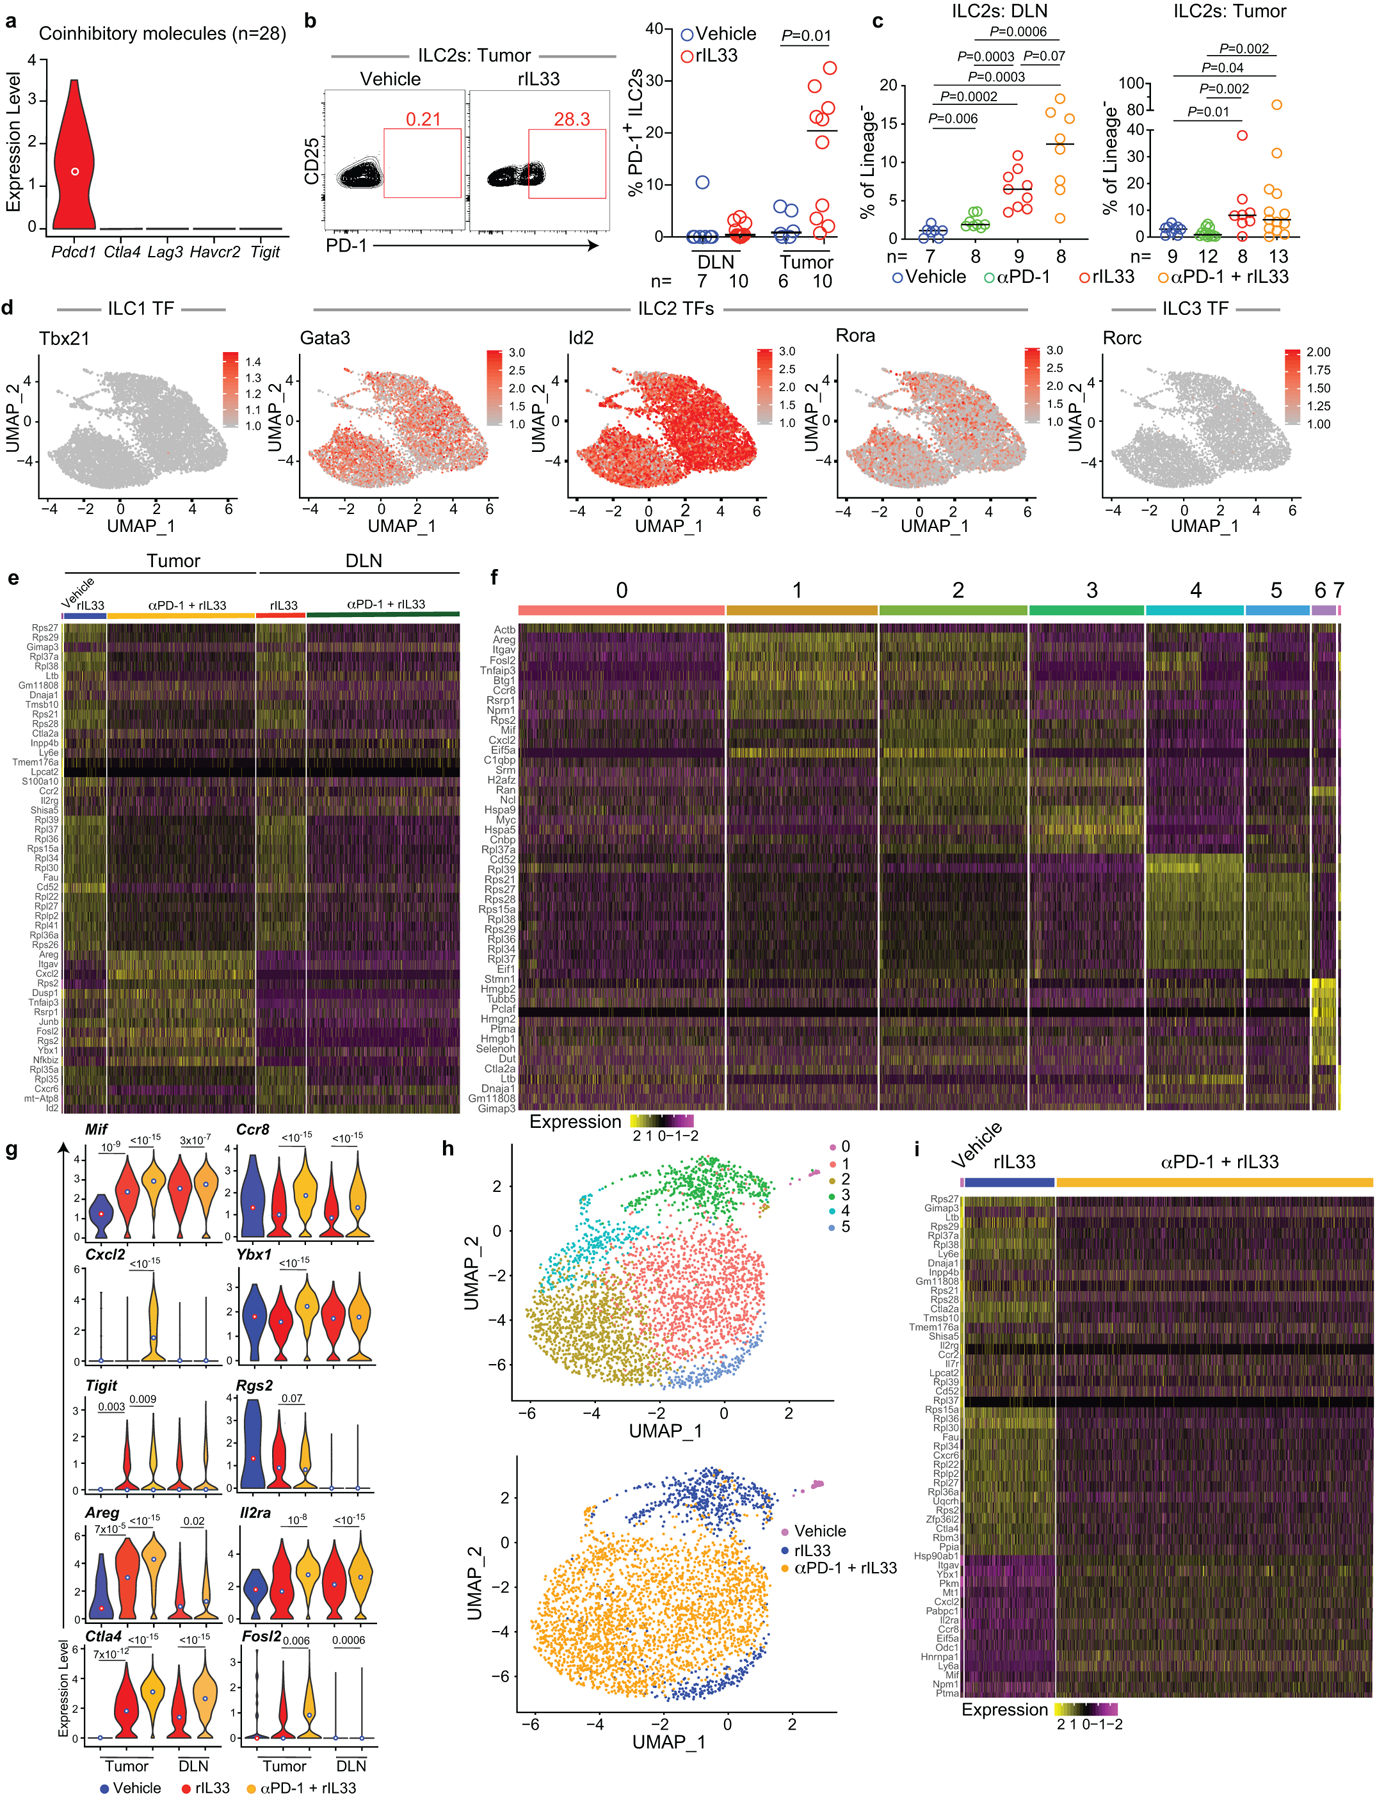
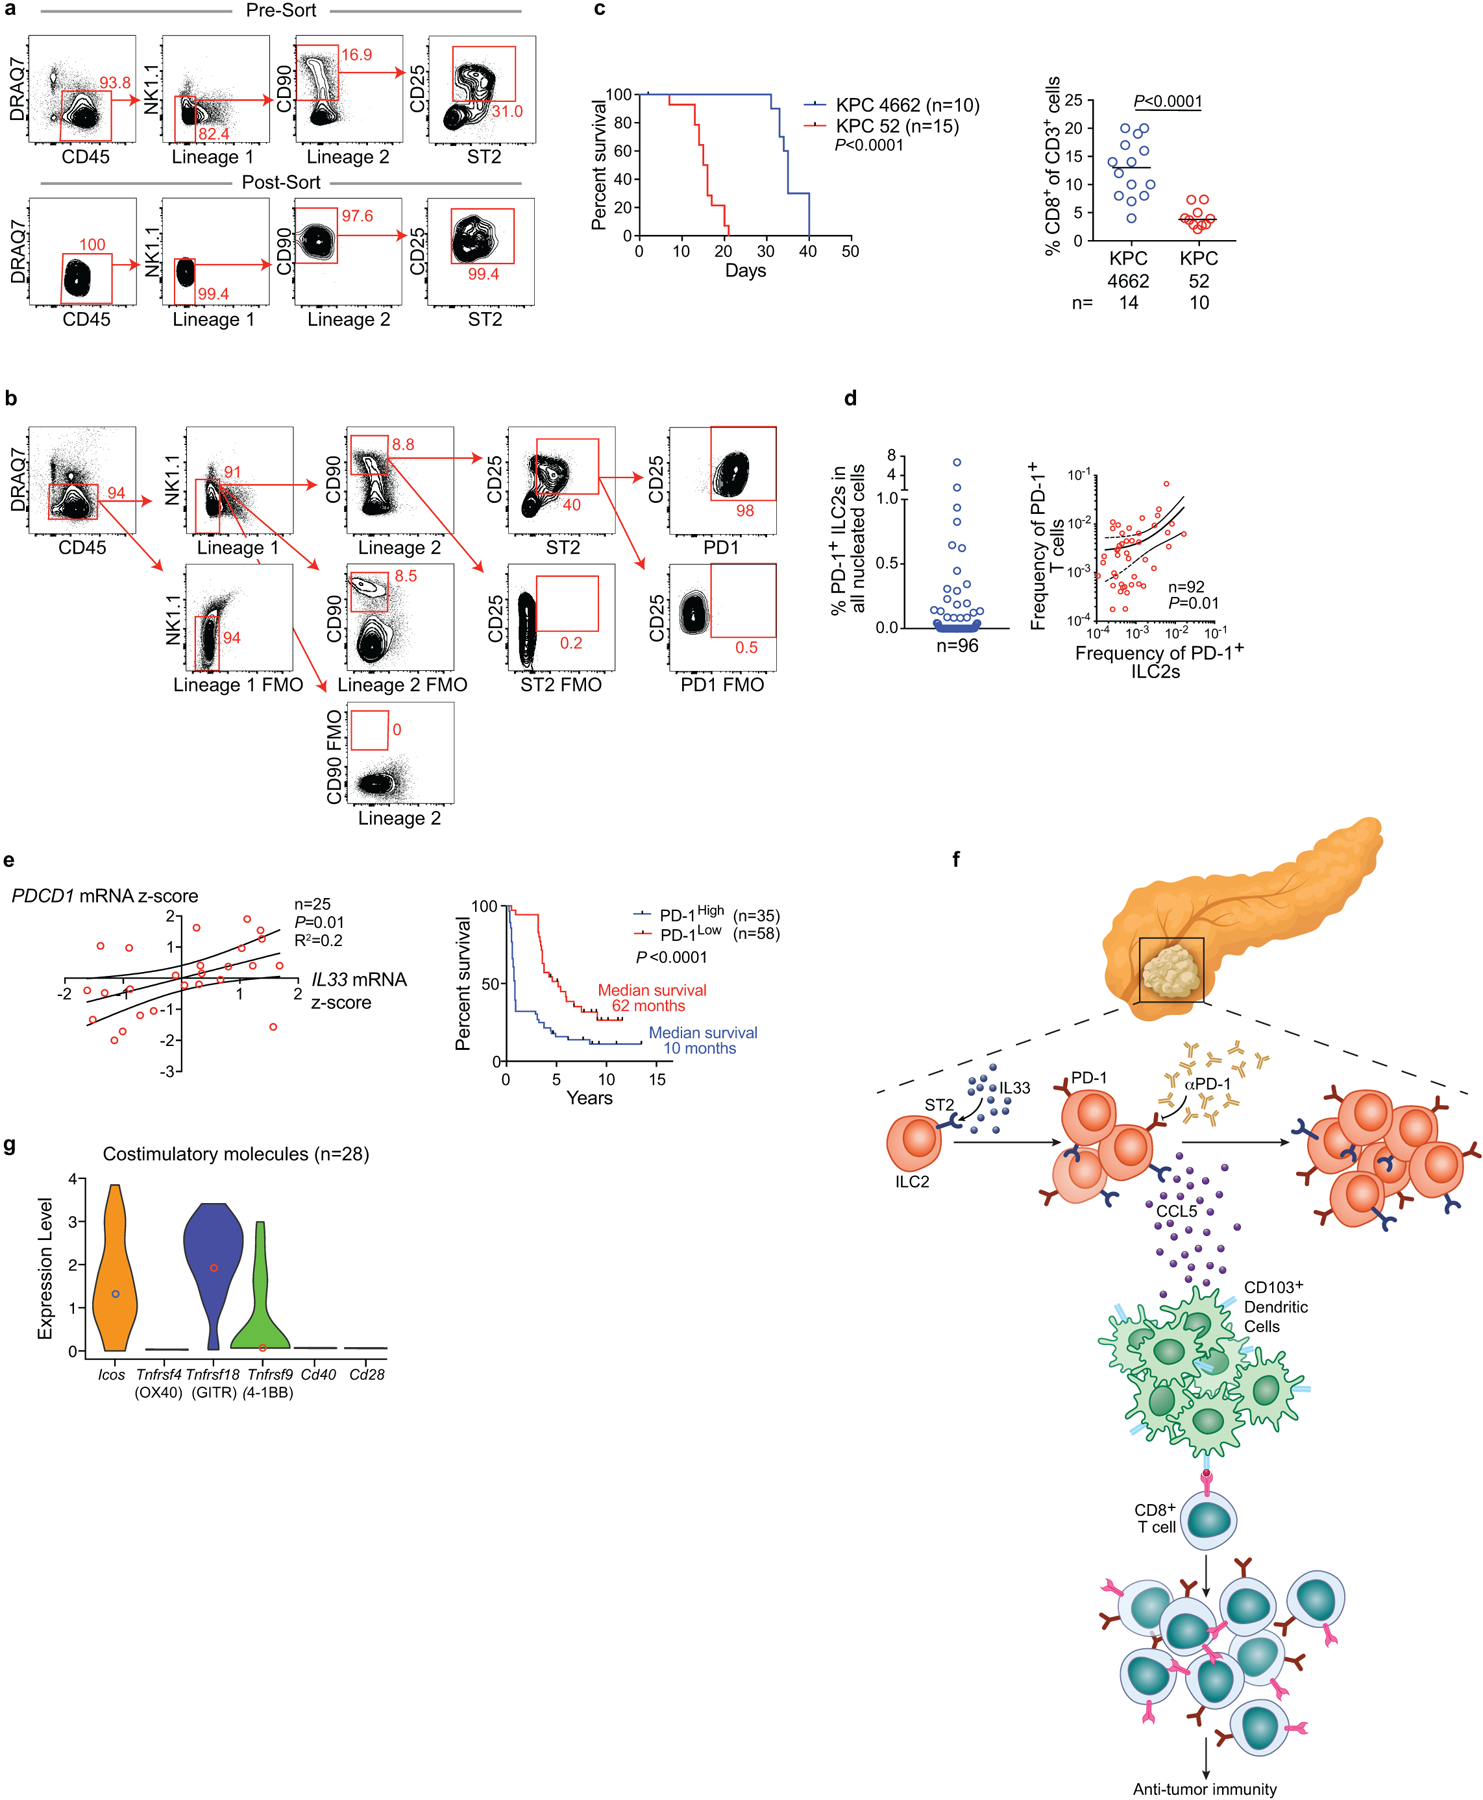
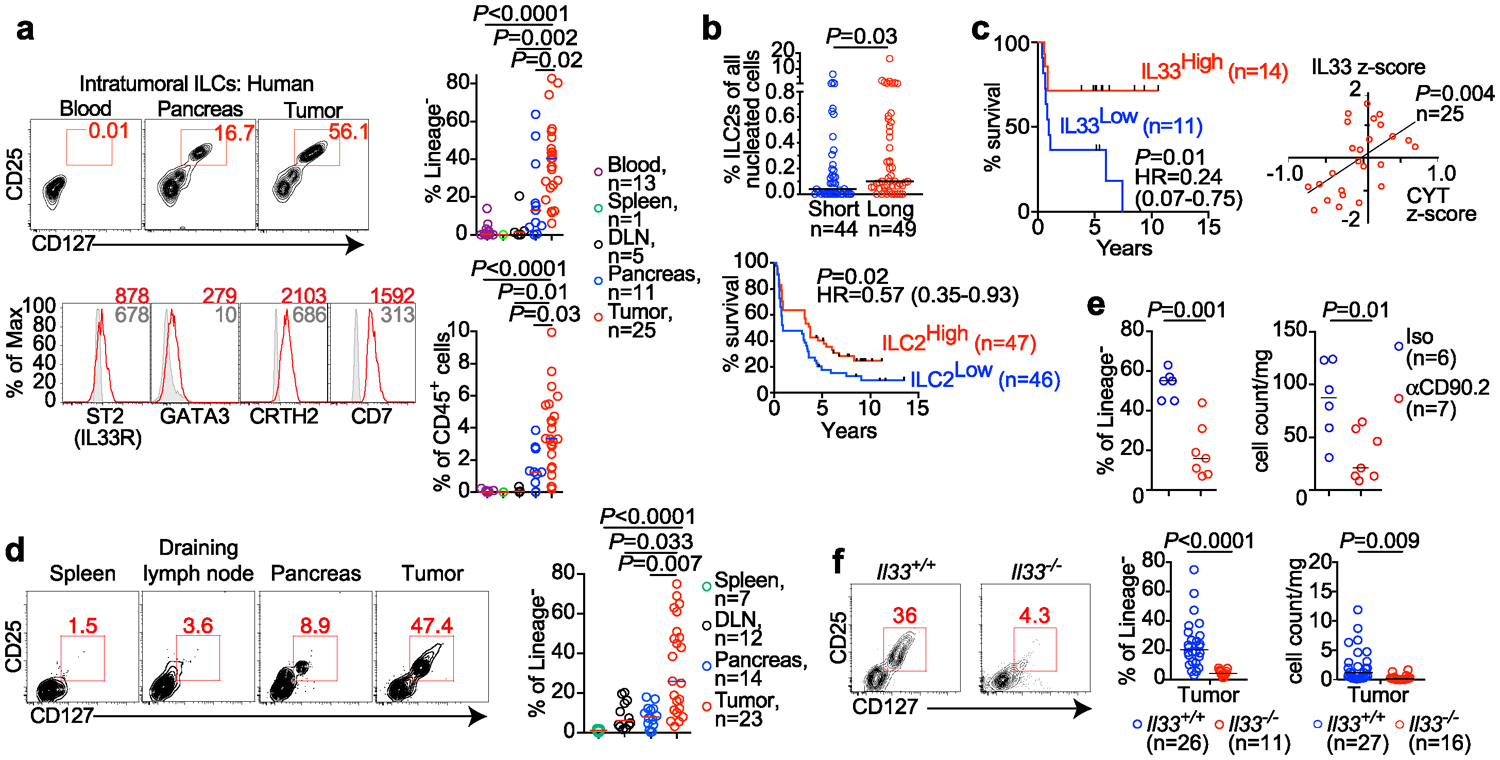
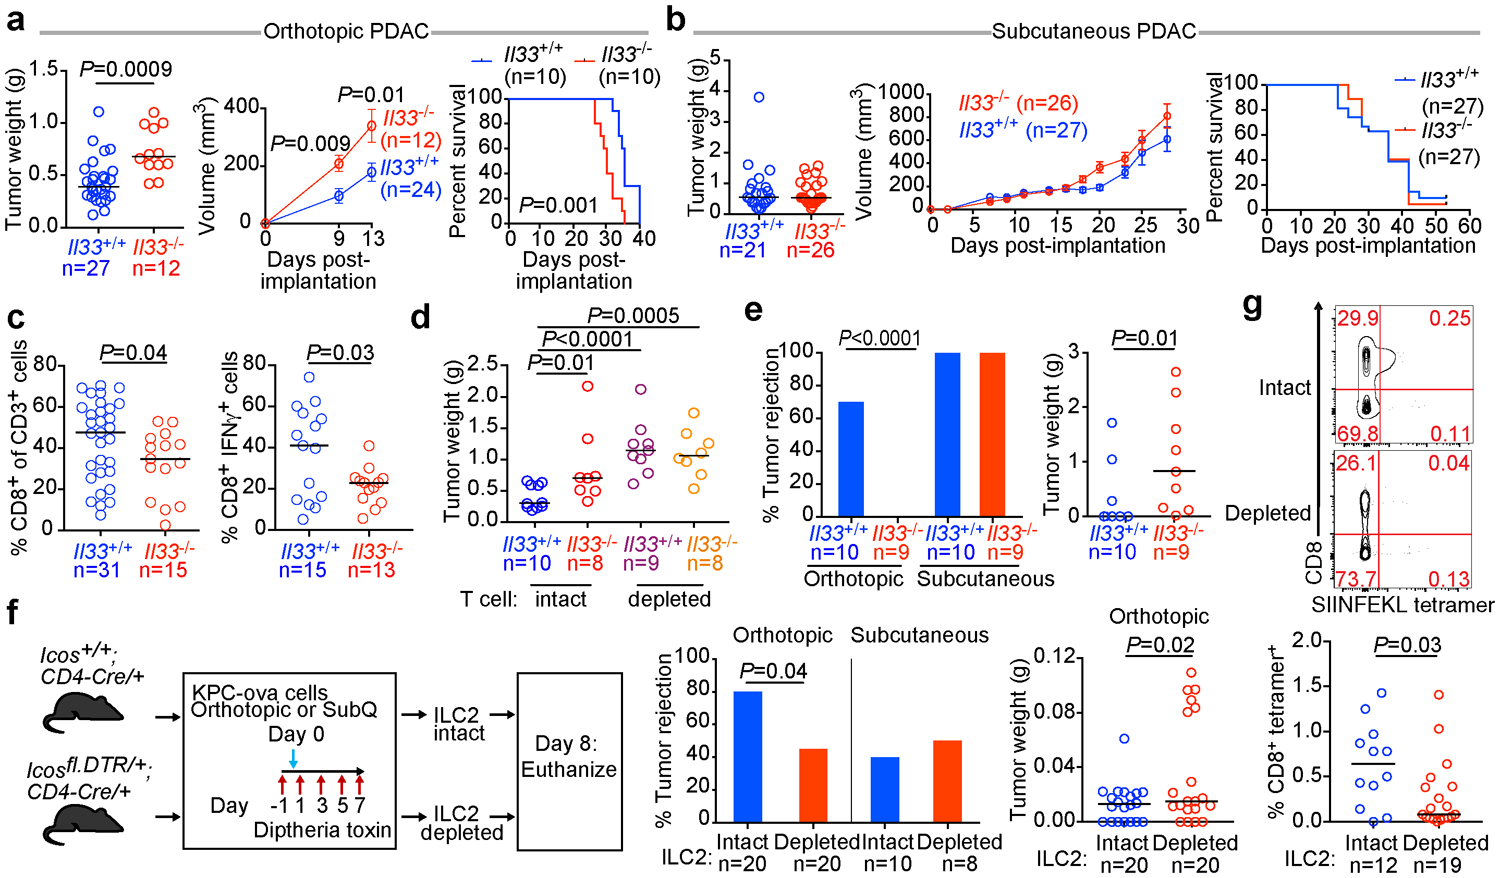
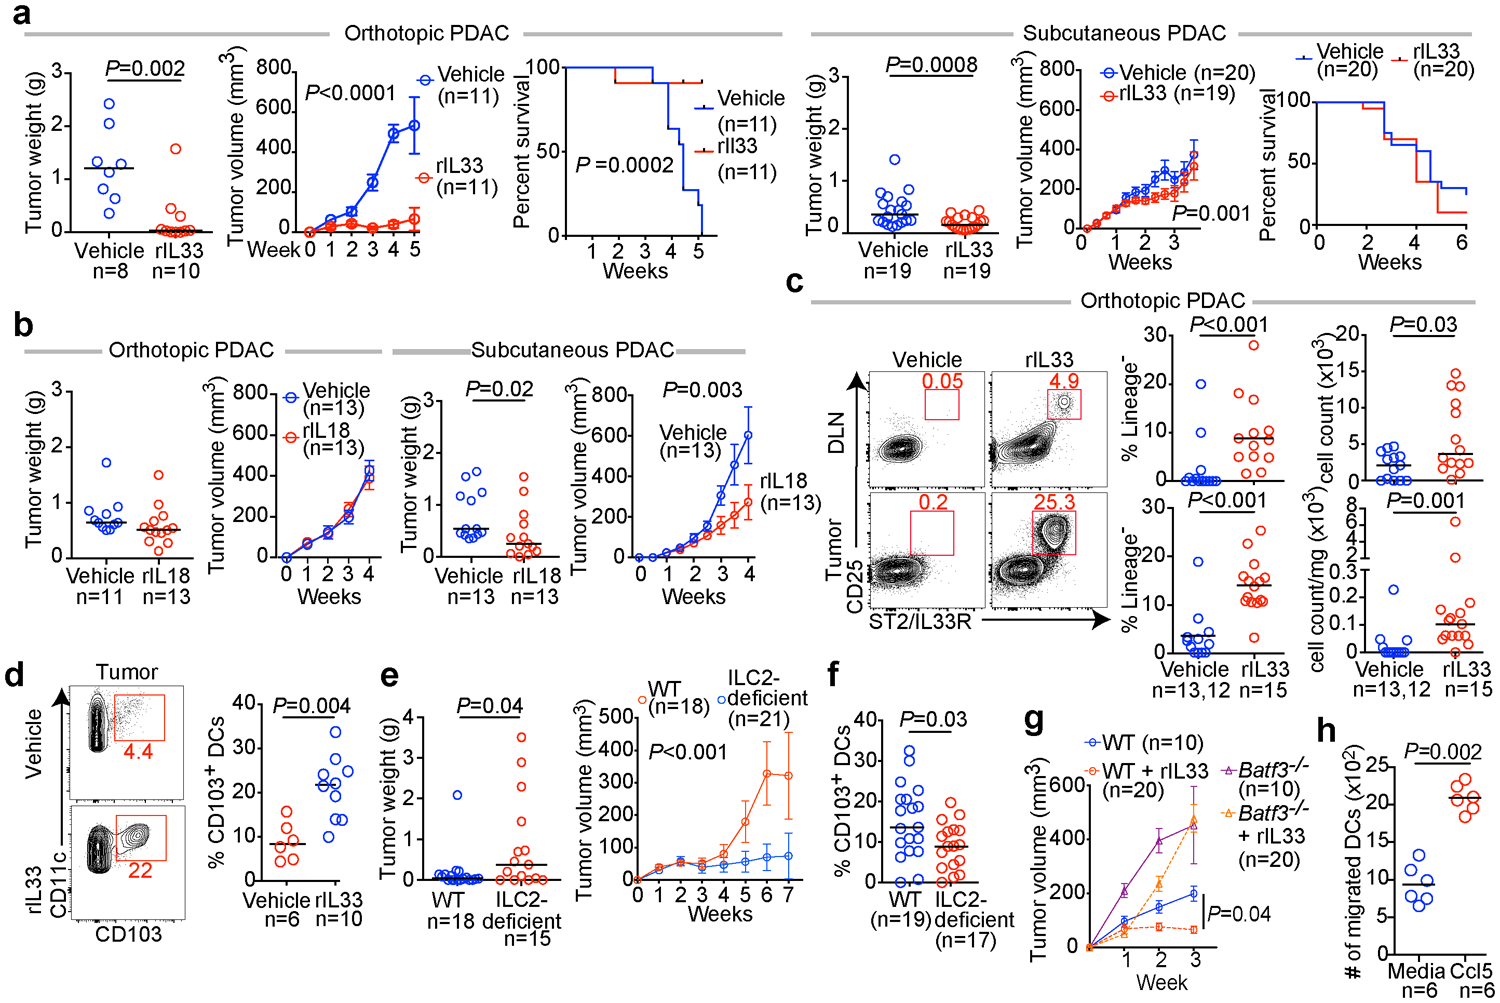
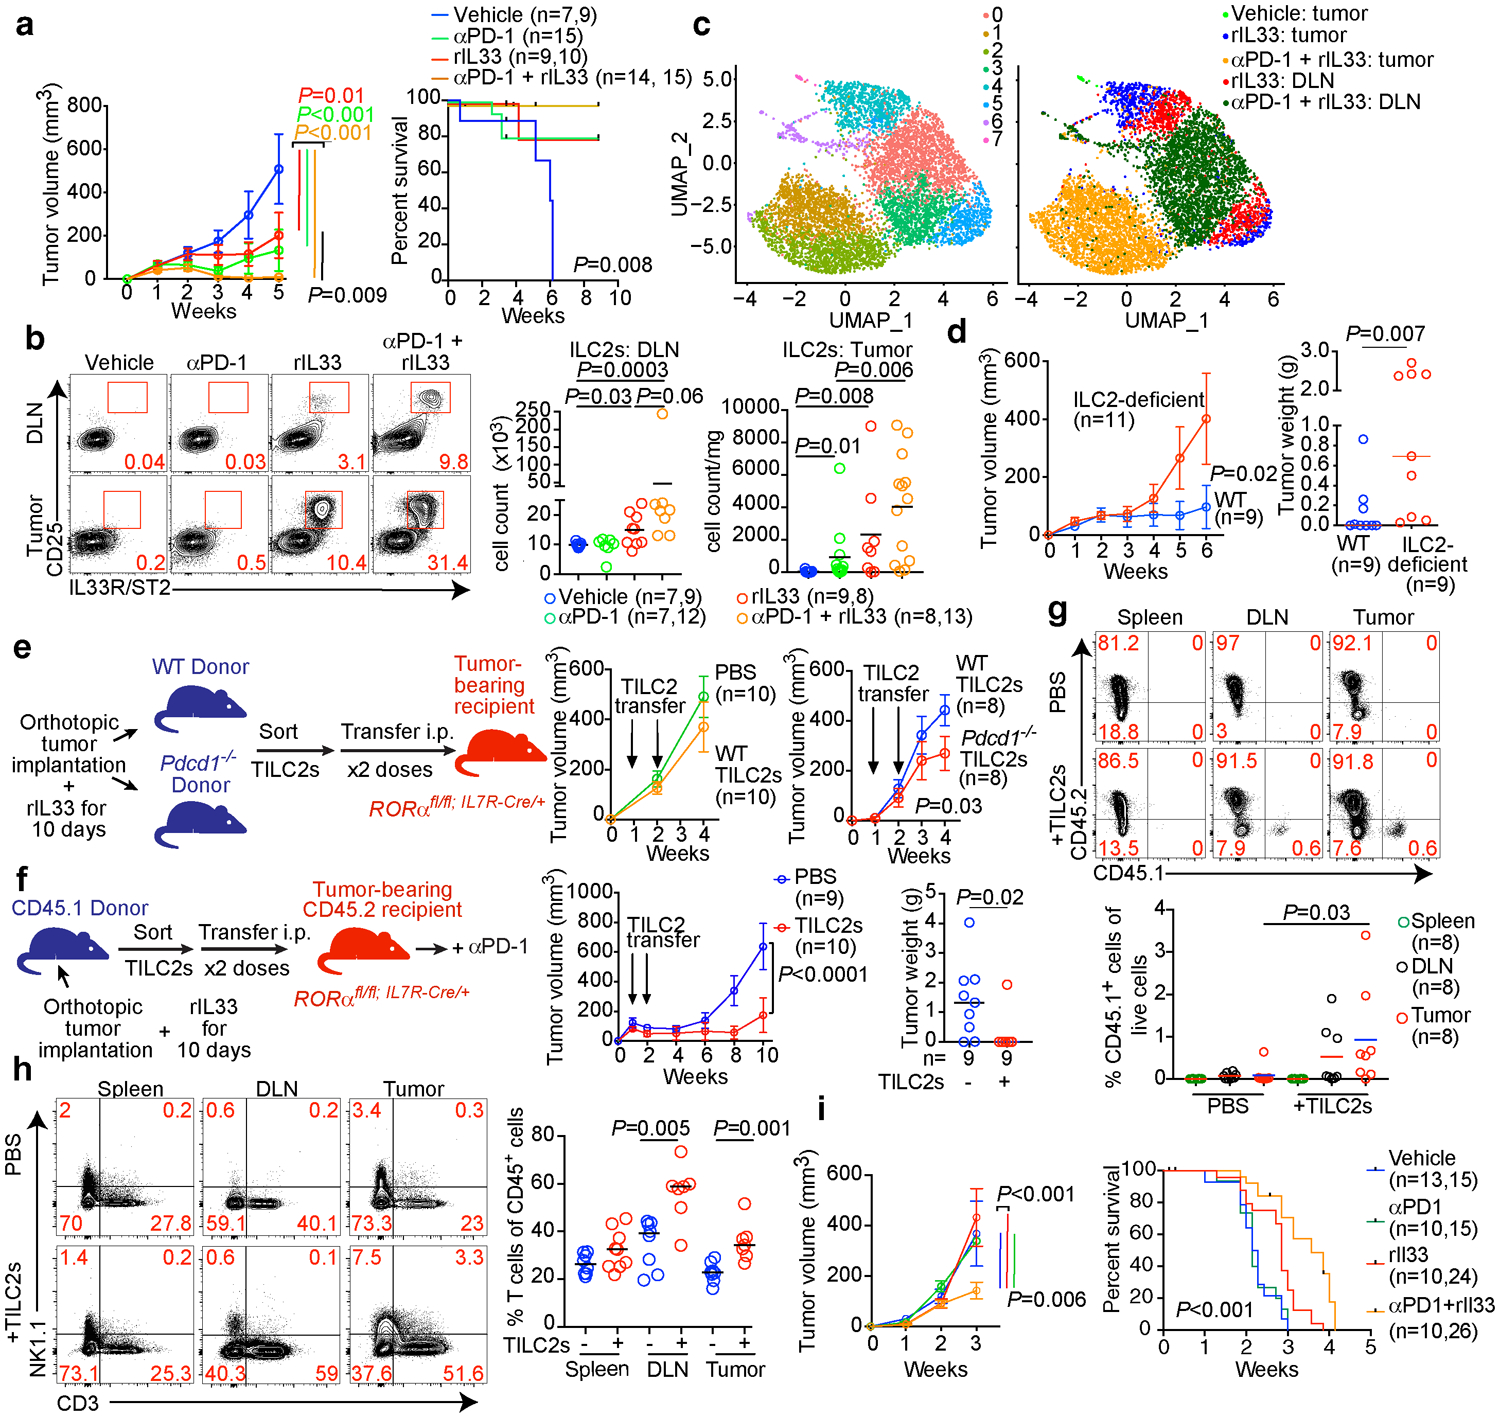
Group 2 innate lymphoid cells (ILC2s) regulate inflammation and immunity in mammalian tissues1,2. Although ILC2s are found in cancers of these tissues3, their roles in cancer immunity and immunotherapy are unclear. Here we show that ILC2s infiltrate pancreatic ductal adenocarcinomas (PDACs) to activate tissue-specific tumour immunity. Interleukin-33 (IL33) activates tumour ILC2s (TILC2s) and CD8+ T cells in orthotopic pancreatic tumours but not heterotopic skin tumours in mice to restrict pancreas-specific tumour growth. Resting and activated TILC2s express the inhibitory checkpoint receptor PD-1. Antibody-mediated PD-1 blockade relieves ILC2 cell-intrinsic PD-1 inhibition to expand TILC2s, augment anti-tumour immunity, and enhance tumour control, identifying activated TILC2s as targets of anti-PD-1 immunotherapy. Finally, both PD-1+ TILC2s and PD-1+ T cells are present in most human PDACs. Our results identify ILC2s as anti-cancer immune cells for PDAC immunotherapy. More broadly, ILC2s emerge as tissue-specific enhancers of cancer immunity that amplify the efficacy of anti-PD-1 immunotherapy. As ILC2s and T cells co-exist in human cancers and share stimulatory and inhibitory pathways, immunotherapeutic strategies to collectively target anti-cancer ILC2s and T cells may be broadly applicable.


Conflict of interest statement

Competing interests. V.P.B. is a recipient of an immuno-oncology translational research grant from Bristol Myers Squibb and is an inventor on a patent application related to work on neoantigen modeling. S.D.L. is a member of the scientific advisory board of Nybo Pharmaceuticals, and co-founder of Episteme Prognostics. J.D.W. is a consultant for Adaptive Biotech, Advaxis, Amgen, Apricity, Array BioPharma, Ascentage Pharma, Astellas, Bayer, Beigene, Bristol Myers Squibb, Celgene, Chugai, Elucida, Eli Lilly, F Star, Genentech, Imvaq, Janssen, Kleo Pharma, Linneaus, MedImmune, Merck, Neon Therapuetics, Ono, Polaris Pharma, Polynoma, Psioxus, Puretech, Recepta, Trieza, Sellas Life Sciences, Serametrix, Surface Oncology, and Syndax; is a recipient of research support from Bristol Myers Squibb, Medimmune, Merck Pharmaceuticals, and Genentech; and has equity in Potenza Therapeutics, Tizona Pharmaceuticals, Adaptive Biotechnologies, Elucida, Imvaq, Beigene, Trieza, and Linneaus; has received honorarium from Esanex. T.M. is a consultant for Immunos Therapeutics and Pfizer; is a co-founder with equity in IMVAQ therapeutics; receives research funding from Bristol-Myers Squibb, Surface Oncology, Kyn Therapeutics, Infinity Pharmaceuticals Inc., Peregrine Pharmaceuticals Inc., Adaptive Biotechnologies, Leap Therapeutics Inc., and Aprea; is an inventor on patent applications related to work on Oncolytic Viral therapy, Alpha Virus Based Vaccine, Neo Antigen Modeling, CD40, GITR, OX40, PD-1 and CTLA-4. M.G. is an employee of Bristol Myers Squibb and has financial interest in the company.

Figures

Extended Data Figure 1:
Extended Data Figure 1:. Identification of IL33-dependent ILCs in pancreatic cancer.
(a) Gating strategy to identify human ILCs. The first plot was pre-gated on live (DRAQ7) cells and singlets. Lineage (Lin) 1 cocktail: CD5, CD11b, CD11c, CD16, FcεR1. Lin 2 cocktail: CD3, CD19, TCRα/β. ILCs were identified as Lin CD56 CD25+ CD127+ cells. FMO, fluorescence minus one. (b) Representative image of immunofluorescence of ILC2s in tumor tissue microarrays of short-term and long-term PDAC survivors (n=96). Arrows, putative ILC2s. (c) Top, overall survival of patients with greater (high) or lesser (low) than the median intratumoral mRNA level of ILC-stimulating cytokines. Bottom, correlation between expression of ILC-activating cytokines and immune cytolytic index (CYT) in long- and short-term survivors of human PDAC. Curves were fit by linear regression. n=25. (d) Gating strategy to identify murine ILCs. The first plot was pre-gated on live (DRAQ7) cells and singlets. Lineage (Lin) 1 cocktail: CD5, CD11b, CD11c, FcεR1. Lin 2 cocktail: CD3, CD19. ILCs were identified as Lin NK1.1 CD25+ CD127+, ILC2s as Lin NK1.1 CD25+ St2+ cells. Gating on orthotopic PDAC mice are shown. (e) Intratumoral ILC frequency in orthotopic PDAC mice established with KPC cell lines 8–1, 18–3, and in autochthonous KPC mice with spontaneous PDAC (KPCSpont). Composite ILC frequencies from Fig. 1d and others are included for comparison (KPC 4662). (f) Phenotype of ILCs in PDAC mice. Gray curves, isotype controls; numbers, mean fluorescence intensity. (g) Expansion kinetics of ILCs in tissues of PDAC mice. (h) Changes in non-ILC cell frequency in Rag2−/− PDAC mice treated with αCD90.2 or isotype antibodies. Data were analyzed at 14 days (d-f), 10 days (h), or at the indicated time points post tumor implantation. n indicates individual mice analyzed separately in at least two independent experiments with n≥2/group. Horizontal bars mark medians, error bars mark s.e.m. P values were determined by two-sided log-rank (c, top), linear regression (c, bottom), or two-tailed Mann-Whitney test (g). P values in g indicate tumor comparisons to all other organs.
Extended Data Figure 2:
Extended Data Figure 2:. Host-derived IL33 activates pancreatic ILC2s.
(a) mRNA expression of ILC1- (IL12, IL15, IL18), ILC2- (IL25, IL33, TSLP), and ILC3-inducer cytokines (IL23) and the IL33 receptor (ST2) in orthotopic PDAC tumors (left) and autochthonous PDAC tumors in KPC mice from a previously published mRNA microarray (right). (b) Representative IL33 immunohistochemistry (IHC) of IL33Low and IL33High human (tissue microarray, n=96) and mouse PDAC (n=3/group). (c) Frequency of human PDAC patients demonstrating IL33 positivity by IHC in a human PDAC tumor microarray. (d) Multiplexed immunofluorescence for IL33, ductal marker CK19, and myeloid markers CD11b, and Iba in mouse PDAC (top). Arrows, IL33-expressing cells. IL33 mean fluorescence intensity (MFI) in non-immune (CD45), immune (CD45+), macrophage (TAM), and monocytic and granulocytic myeloid-derived suppressor cell (M-MDSC and G-MDSC) populations in tumors of IL33Cit reporter PDAC mice (bottom). (e) Representative IL33 protein expression by IHC in orthotopic PDAC tumors in Il33+/+ (WT) mice, and non-tumor-bearing pancreata in Il33–/– mice (n=3/group). (f) ILC frequency (top) and cell number (bottom) in organs and draining lymph nodes (DLN) of Il33+/+ and Il33−/− orthotopic PDAC mice. (g) Gating and frequency of IL4 and IL5 expression in intratumoral ILCs in Il33+/+ and Il33−/− orthotopic PDAC mice. (h) ILC2 and (i) immune cell frequencies in orthotopic Rag2–/– and Rag2–/–γc–/– PDAC mice with or without treatment with recombinant IL33 (rIL33). (j) Frequency of ST2+ tumor ILCs in mice with subcutaneous (SQ) and orthotopic PDAC. (k) Tumors in orthotopic and subcutaneous PDAC mice. (l) Tumor weight in Il33+/+ and Il33−/− littermate PDAC mice. (m) Experimental schema of bone-marrow chimeras to evaluate contribution of hematopoietic cell-derived IL33 to tumor control. (n) Hematopoietic cell reconstitution and (o) tumor weight in irradiated CD45.1 congenic mice reconstituted with either CD45.2 Il33+/+ or CD45.2 Il33−/− bone marrow. Data were collected at 14 (a, d, f, g, j, o), and 10 (h, i) days post tumor implantation. Horizontal bars mark medians. n indicates individual mice analyzed separately in at least two independent experiments with n≥2/group. P values were determined by one-way ANOVA (a) or two-tailed Mann-Whitney test (d, f-h, j, l, o).
Extended Data Figure 3:
Extended Data Figure 3:. Host-derived IL33 activates pancreatic T cell immunity.
(a) Gene set enrichment analysis of bulk RNA-seq from purified CD45+ immune cells from Il33+/+ and Il33−/− PDAC mice. Enrichment plots and enrichment scores are shown for three gene sets comparing expression in Il33−/− to Il33+/+ (n=3 mice/group). FDR, false discovery rate. (b) Gating of CD8+ T cells and (c) frequencies of various immune cell types (left) and CD4+ T cell lineages (right) in Il33+/+ and Il33−/− orthotopic PDAC mice. (d) Frequency of T central memory (Tcm) cells (CD45+CD3+CD8+CD44+CD62L+) in tumor draining lymph nodes and non-tumor draining distant lymphoid organs (inguinal lymph node and spleen) in Il33+/+ and Il33−/− orthotopic PDAC mice. (e) Frequency of CD8+ T cells in subcutaneous PDAC tumors. DC, dendritic cells; MDSC, myeloid-derived suppressor cells; NK, natural killer cells; NKT, natural killer T cells; Treg, regulatory T cells. Data were analyzed 14 days post tumor implantation or at the time points indicated. Horizontal bars mark medians, error bars mark s.e.m. n indicates individual mice analyzed separately in at least two independent experiments with n≥2/group. P values determined by one-way ANOVA (d).
Extended Data Figure 4:
Extended Data Figure 4:. IL33 and ILCs do not directly induce tumor cell death.
(a) Tumor weight in Rag2−/− and Rag2−/−γc−/− PDAC mice treated with vehicle or recombinant murine IL33 (rIL33). (b) Representative hematoxylin and eosin stained sections (left) with histologic tumor cell differentiation status in Il33+/+ and Il33−/− PDAC mice (right). (c) Trichrome staining in tumors of Il33+/+ and Il33−/− PDAC mice (n=3/group). (d) Immunohistochemistry for smooth muscle actin in tumors of Il33+/+ and Il33−/− PDAC mice (n=3/group). (e) Intratumoral ST2 expression on KPC cells in Il33+/+ and Il33−/− orthotopic PDAC mice. (f) ST2 expression on live KPC cells following rIL33 treatment in vitro (DRAQ7 stains dead cells) (n=3/group). (g) KPC cell number, viability, proliferation (Ki-67), and apoptosis (annexin) following rIL33 treatment in vitro (n=6/group). Horizontal bars mark medians. n in a-e indicates individual mice analyzed separately in at least two independent experiments with n≥3/group. n in f, g indicates technical replicates and is representative of at least two independent experiments. P value determined by two-tailed Mann-Whitney test (a).
Extended Data Figure 5:
Extended Data Figure 5:. ILC2s induce antigen-specific CD8+ T cell priming.
(a) Gating and frequency of intratumoral ILC2s in ILC2-intact mice (diphtheria toxin [DT]-treated Icos+/+; CD4Cre/+) and ILC2-depleted mice (DT-treated Icosfl.DTR/+; CD4Cre/+). (b) Gating and frequency of OVA-specific CD8+ T cells in spleens from ILC-intact and ILC-depleted mice. OVA-specific T cells were detected as SIINFEKL-tetramer+ cells. (c) Gating and frequency of central memory CD8+ T (TCM) cells (CD45+CD3+CD8+ CD44+CD62L+) in tumor draining lymph nodes and spleens in ILC-intact and ILC-depleted mice. (d) ST2 expression on CD45+CD3+CD8+ T cells after tumor implantation in PDAC mice. Data were collected at 14 days post tumor implantation or at the time points indicated. DLN, draining lymph node; MFI, mean fluorescence intensity. Horizontal bars mark medians; error bars mark s.e.m. n indicates individual mice analyzed separately in at least two independent experiments with n≥2/group. P values determined by two-tailed Mann-Whitney test (a-c) and two-way ANOVA with Tukey’s multiple comparison post-test (d, indicating comparison of tumor ILCs to all other groups).
Extended Data Figure 6:
Extended Data Figure 6:. Immunophenotyping in rIL33-treated PDAC mice.
(a) Percent tumor establishment of orthotopic and subcutaneous KPC-OVA PDAC tumors in vehicle (veh) and rIL33 treated mice. (b) Gating (left) and frequency (right) of IL18R1 expression on tumor ILCs in subcutaneous (SQ) and orthotopic PDAC mice. (c) Gating (left) and frequency (right) of splenic ILC2s following rIL33 treatment in orthotopic PDAC mice. (d) Gating (left) and frequency (right) of tumor ILC2s following rIL33 treatment in subcutaneous PDAC mice. (e) Gating (left) and frequency (right) of cytokine and PD-1 expression on tumor CD8+ T cells following rIL33 treatment in orthotopic PDAC mice. (f) Frequency of immune cells in vehicle- and rIL33-treated orthotopic PDAC mice. (g) Gating strategy for identification of CD103+ dendritic cells. (h) Gating (left; tumors) and frequency (right) of ILC2s in tumors and draining lymph nodes (DLN) of wild type (WT) or Rorafl/fl IL7rCre mice (ILC2-deficient) PDAC mice following rIL33 treatment. (i) Gating (left) and frequency (right) of PD-1+ CD8+ T cells in tumors of rIL33-treated WT and Batf3−/− mice. Data were collected at 6 (a), 5 (b), and 3 (i) weeks post tumor implantation. Horizontal bars mark medians. n indicates individual mice analyzed separately in at least two independent experiments with n≥2/group. P values determined by two-tailed Mann-Whitney test (a, f, i).
Extended Data Figure 7:
Extended Data Figure 7:. Single-cell RNA sequencing of tumor and draining lymph node ILC2s in PDAC mice.
(a) Experimental design for in vivo treatment, purification, and single-cell analysis of ILC2s. (b, c) Quality metrics. (b) Scatter plots showing, for each cell, the relationship between the number of unique molecular identifiers (# of UMIs) and the number of genes (# of genes). (c) Violin plots showing the distribution of the number of genes (left), number of UMIs (middle), and percentage of normalized reads from mitochondrial genes (right) in each treatment group (columns), and each tissue (rows). Each dot represents a single cell. For each treatment group and organ, data represent pooled purified single cells from biological replicates of n=10 (vehicle), n=5 (rIL33), and n=5 (αPD-1 + rIL33) PDAC mice.
Extended Data Figure 8:
Extended Data Figure 8:. Activated ILC2s from tumors and draining lymph nodes have distinct transcriptional features.
(a) Single-cell analysis of 1,634 rIL33-activated tumor and draining lymph node (DLN) ILC2s (experimental design as outlined in Extended Data Figure 7a). UMAP plots show single cells (dots) in a nonlinear representation of the top 15 principal components. Expression of (a) ILC2 (Gata3, Id2, Rora), and ILC3 (gene, Rorc; protein, Rorγt) transcription factors (TFs), (b) ILC2 surface markers, and (c) of clusters and organs. Expression of ILC-1 TF Tbx21 (T-bet) was undetectable. (d, e) Differentially expressed genes by (d) cluster and (e) organ (TILC2s and DLN ILC2s). (f) Distribution of Ccl5 expression from ILC2s in tumor and DLNs; violin plots show distribution with minima, maxima, and circle indicating median. Each dot in a and b represents a single cell. For each treatment group and organ, data represent pooled purified single cells from biological replicates of n=5 rIL33-treated PDAC mice. P values by two-sided pairwise Wilcoxon rank sum test.
Extended Data Figure 9:
Extended Data Figure 9:. Combined αPD-1 and rIL33 treatment induces a unique transcriptional profile in tumor ILC2s.
(a) Expression of coinhibitory immune checkpoints in tumor ILC2s in vehicle-treated PDAC mice by single-cell RNA sequencing (scRNA-seq). (b) Gating and frequency of PD-1+ ILC2s in vehicle- and rIL33-treated PDAC mice. DLN, draining lymph node. (c) ILC2 frequency in treated PDAC mice. Corresponding tumor volumes, weight, cell number, and scRNA-seq are shown in Figure 4a–c. (d) scRNA-seq of ILC2s from treated PDAC mice. Expression of ILC 1 (gene, Tbx21; protein, Tbet), ILC2 (Gata3, Id2, Rora), and ILC3 (gene, Rorc; protein, Rorγt) transcription factors (TFs) in purified tumor and draining lymph node (DLN) ILC2s. Corresponding UMAP plots by cluster and treatment are depicted in Figure 4c. Top differentially expressed genes by treatment and tissue (e), cluster (f), and distribution of expression for select differentially expressed genes by treatment and tissue (g) (tumor: vehicle n=28, rIL33 n=752, rIL33+PD-1 n=2,635; DLN rIL33 n=882, rIL33+PD-1 n=2,725). (h) UMAP plots of 3,387 single tumor ILC2s in a non-linear representation of the top 15 principal components. (i) Differentially expressed genes in tumor ILC2s by treatment. Each dot in d and h represents a single cell; for each treatment group and organ, data represent pooled purified single cells from biological replicates of n=10 (vehicle), n=5 (rIL33), and n=5 (αPD-1 + rIL33) PDAC mice. Violin plots show distribution with minima, maxima, and circle indicating median. Horizontal bars in b and c mark medians. P values by two-tailed Mann-Whitney test (b, c) and two-sided pairwise Wilcoxon rank sum test (g).
Extended Data Figure 10:
Extended Data Figure 10:. Activated tumor ILC2s express PD-1 and co-exist with PD-1+ T cells.
Orthotopic PDAC mice (C57Bl/6 WT, Pdcd1−/−, CD45.1) were treated with 500 ng of carrier-free recombinant murine IL33 daily for 10 days (experimental designs shown in Figure 4e, f). Live, CD45+, lineage, CD90+, CD25+, ST2+ tumor ILC2s (TILC2s) were sort-purified to 98% purity at day 10 post-implantation. 5 × 10⁵ TILC2s were immediately transferred to orthotopic PDAC tumor-bearing Il7rCre/+Rorafl/fl (ILC2-deficient) CD45.2 mice on days 7 and 14 post-tumor implantation via i.p. injection. Control mice received equivalent volumes of PBS via i.p. injections. (a) Representative plots for TILC2 sort-purification (top) and post-sort purity (bottom). (b) Representative plots showing PD-1 expression on sort-purified TILC2s from WT and CD45.1 mice in the experimental designs as outlined in Figure 4e, f. (c) Survival and intratumoral CD8+ T cell frequency of orthotopic KPC 4662-GFP and KPC 52 PDAC tumors; horizontal bars in c mark medians. (d) Frequency of PD-1+ ILC2s (left) and correlation with PD-1+ T cells (right) in human PDAC. (e) Linear regression analysis of IL33 and PD-1 mRNA in bulk tumor transcriptomes of short- and long-human PDAC survivors (left) and survival association of PD-1+ cells in tumor tissue microarrays of short-term and long-term PDAC survivors (right); high and low defined as higher or lower than the median for the cohort. (f) Model linking the IL33-TILC2 axis to T cell immunity in pancreatic cancer. (g) Distribution of expression of costimulatory molecules in untreated tumor ILC2s by single-cell RNA sequencing. Experimental design as shown in Extended Data Figure 7a; data represent pooled purified single cells from biological replicates of n=10 (vehicle). Data are representative of purity and PD-1 expression on sorted TILC2s in two independent experiments with n≥4/group (a, b). n and data points denote individual mice and patients analyzed separately. P values were determined by two-tailed Mann-Whitney (c), and two-sided log rank (c, e, survival curves) tests, and linear regression (d, e).
Figure 1:
Figure 1:. IL33-dependent ILC2s infiltrate human and murine pancreatic cancer.
(a) Gating, frequency, and phenotype of ILCs in unselected human PDAC patients. (b) Frequency (top) and survival association (bottom) of ILC2s in tumor tissue microarrays of short-term and long-term PDAC survivors. (c) Bulk tumor IL33 mRNA associations with survival and correlation with tumor cytolytic index (CYT) in short- and long-term PDAC survivors. (d) Gating and frequency of ILCs in PDAC mice. (e) Intratumoral ILC frequency and number in Rag2−/− PDAC mice treated with αCD90.2 or isotype (Iso) antibodies. (f) Gating, frequency, and number of ILCs in Il33+/+ and Il33−/− PDAC mice. High and low in b, c defined as higher or lower, respectively, than the median for the cohort. Data were collected at 14 (d-f) post tumor implantation. n, number of tumors from individual patients or mice. Horizontal bars mark medians. Data in d-f are pooled from ≥2 independent experiments with n≥3/group; each point indicates one mouse analyzed separately. P values determined by one-way ANOVA with Tukey’s (a) and Kruskal-Wallis multiple comparison post-tests (d), two-tailed Mann-Whitney test (b, e, f), two-sided log-rank (b, c survival curves), and linear regression (c).
Figure 2:
Figure 2:. The IL33-ILC2 axis activates tissue-specific cancer immunity.
Tumor weight, volumes, and survival of Il33+/+ and Il33−/− orthotopic (a) or subcutaneous (b) PDAC mice. (c) Frequency of all (left) and IFN-γ producing (right) CD8+ T cells in orthotopic Il33+/+and Il33−/−PDAC tumors. (d) Tumor weight in T cell–depleted Il33+/+and Il33−/− orthotopic PDAC mice. (e) Frequency of tumor rejection and tumor weight in Il33+/+and Il33−/− orthotopic and subcutaneous KPC-OVA PDAC mice. (f) Experimental design (left), frequency of tumor rejection (middle), and tumor weight (right) of KPC-OVA PDAC tumors in iCOS-T mice with intact or depleted ILC2s. (g) Frequency of OVA-specific CD8+ T cells in draining lymph nodes of orthotopic KPC-OVA PDAC iCOS-T mice with intact or depleted ILC2s. Data were collected at 14 days (a, c, d), 28 days (b), 42 days (e), and 8 (f, g) days post implantation. Horizontal bars mark medians, error bars mark s.e.m. Data were pooled from ≥2 independent experiments with n≥4/group; n and data points denote individual mice analyzed separately. P values were determined by two-tailed Mann-Whitney test (a-g), two-sided log-rank test (a, b, survival curves), two-way ANOVA with Sidak’s multiple comparison test (a, b, tumor volumes), and Chi-square test (e, f % rejection).
Figure 3:
Figure 3:. ILC2s stimulate tissue-specific cancer immunity by recruiting intratumoral dendritic cells.
(a) Tumor weight, volume, and survival in orthotopic and subcutaneous PDAC mice treated with vehicle or recombinant IL33 (rIL33). (b) Tumor weight and volume in orthotopic and subcutaneous PDAC mice treated with vehicle or recombinant IL18 (rIL18). (c) Gating, frequency, and number of ILC2s in rIL33-treated orthotopic PDAC mice (DLN vehicle, n=13; tumor vehicle, n=12). (d) Gating and frequency of CD103+ dendritic cells (DCs) in tumors of rIL33-treated orthotopic PDAC mice. (e) Tumor weight, volume, and (f) frequency of CD103+ DCs in tumors of rIL33-treated wild-type (WT) and ILC2 deficient orthotopic PDAC mice. (g) Tumor volume in rIL33-treated WT and CD103+ DC deficient Batf3−/− orthotopic PDAC mice. (h) Migration of purified DCs towards Ccl5. Data were collected at 5 (c, d) and 7 (e, f) weeks post tumor implantation. Horizontal bars mark medians; error bars mark s.e.m. Data were pooled from ≥2 independent experiments, with n≥3/group; n and data points denote individual mice analyzed separately or (h) individual replicates. P values were determined by two-sided log-rank test (a, survival curve), two-way ANOVA (a, b, e, g, tumor volume), and two-tailed Mann-Whitney test (a-f, h).
Figure 4:
Figure 4:. PD-1 blockade activates TILC2s.
(a) Tumor volume and survival, (b) gating, frequency and number and (c) scRNA-seq (n=7,022 ILC2 single cells) in treated PDAC mice in a nonlinear representation of the top 15 principal components. Cells are colored by cluster (left) or treatment and tissue (right). In (a, b), n=n in left, right graphs respectively. (d) Tumor volume in wild-type (WT) or ILC2 deficient PDAC mice treated with αPD-1 + rIL33. (e) TILC2s were sort-purified from rIL33-treated WT or Pdcd1−/− PDAC mice, transferred into ILC2-deficient PDAC recipients, and tumor volumes measured. (f-h) TILC2s were sort-purified from rIL33-treated PDAC CD45.1 donor mice, transferred into ILC2-deficient CD45.2 PDAC recipient mice, and treated with αPD-1 post cell transfer. Tumor volume and tumor weight (f), frequency of CD45.1 and CD45.2 cells (g), and frequency of T cells (h) (TILC2s- : all groups, n=8; TILC2+ : spleen, n=9; DLN, n=7; tumor, n=7) in recipient mice 10 weeks post cell transfer. Frequencies in g = percentage of live donor- or recipient-derived immune cells. (i) Tumor volume (vehicle, n=13; other groups, n=10) and survival (vehicle and αPD-1, n=15; rIL33, n=24; rIL33+αPD-1, n=26) of treated PDAC mice (KPC 52 cells). DLN, draining lymph node. Data were collected at 5 weeks (b), 10 days (c), and 6 weeks (d) post orthotopic tumor cell implantation. Horizontal bars mark medians, error bars mark s.e.m. Data are pooled from ≥2 independent experiments with n≥3/group; n and data points denote individual mice analyzed separately. Data for scRNA-seq represent pooled purified single cells from biological replicates (vehicle n=10, rIL33 n=5, αPD-1 + rIL33 n=5). P values were determined by two-way ANOVA with Tukey’s multiple comparison post (a, d-f, i, tumor volume), two-tailed Mann-Whitney (b, d, g, h), and two-sided log-rank (a, i, survival curves) tests.

Comment in

References

    1. Vivier E et al. Innate Lymphoid Cells: 10 Years On. Cell 174, 1054–1066 (2018). - PubMed
    1. Salimi M et al. Activated innate lymphoid cell populations accumulate in human tumour tissues. BMC Cancer 18, 341 (2018). - PMC - PubMed
    1. Balachandran VP et al. Identification of unique neoantigen qualities in long-term survivors of pancreatic cancer. Nature 551, 512–516 (2017). - PMC - PubMed
    1. Hingorani SR et al. Trp53R172H and KrasG12D cooperate to promote chromosomal instability and widely metastatic pancreatic ductal adenocarcinoma in mice. Cancer Cell 7, 469–483 (2005). - PubMed
    1. Pylayeva-Gupta Y, Lee KE, Hajdu CH, Miller G & Bar-Sagi D Oncogenic Kras-induced GM-CSF production promotes the development of pancreatic neoplasia. Cancer Cell 21, 836–847 (2012). - PMC - PubMed

Publication types

Substances