

Greenhouse gas emissions from lakes and impoundments: upscaling in the face of global change
- PMID: 32076654
- PMCID: PMC7029703
- DOI: 10.1002/lol2.10073
Greenhouse gas emissions from lakes and impoundments: upscaling in the face of global change
Abstract
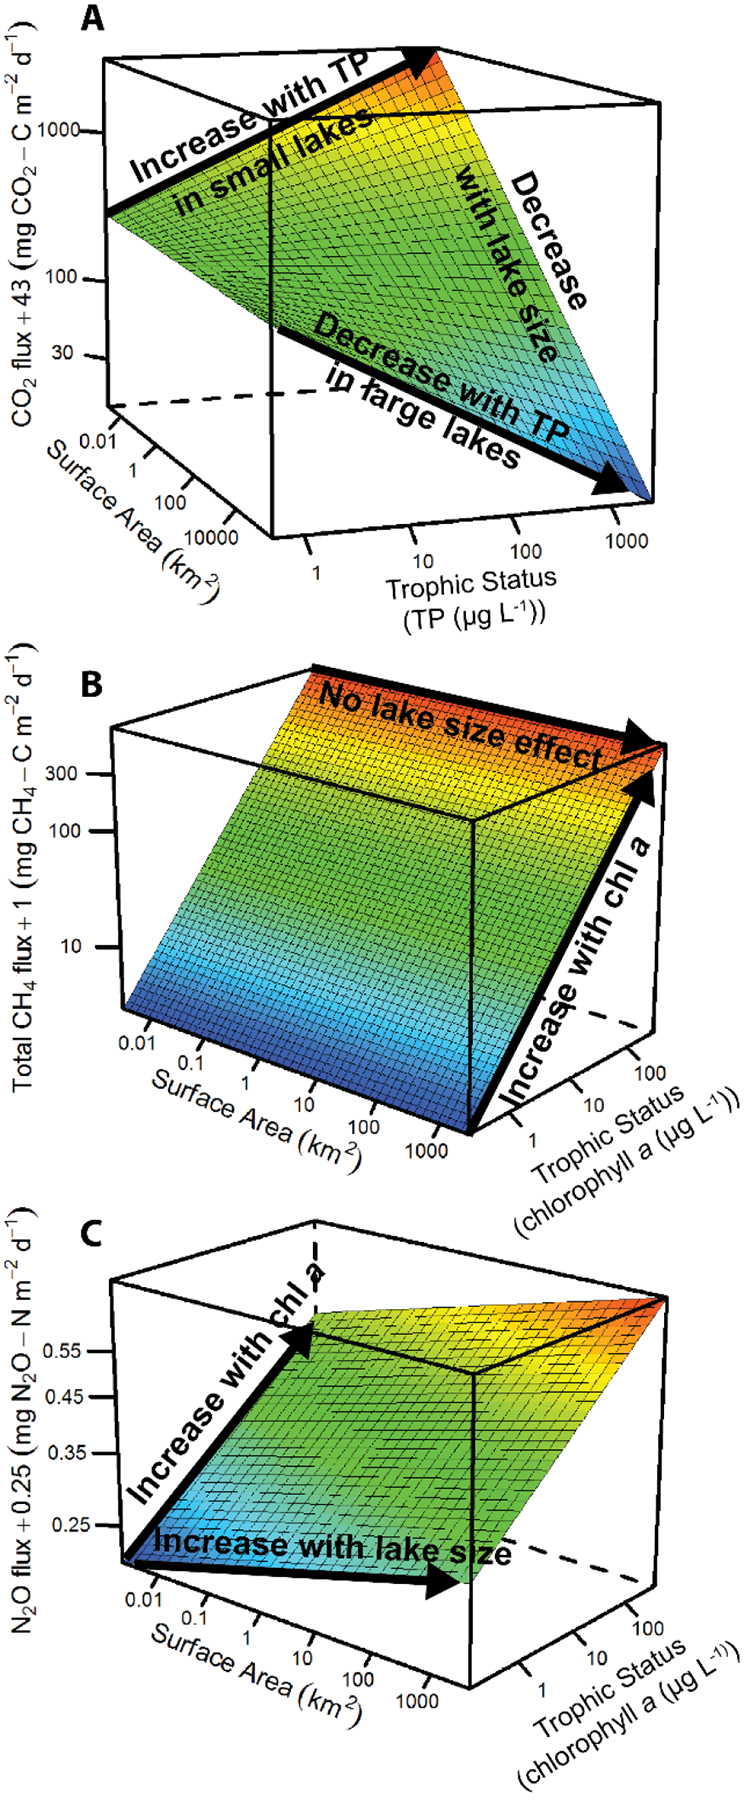
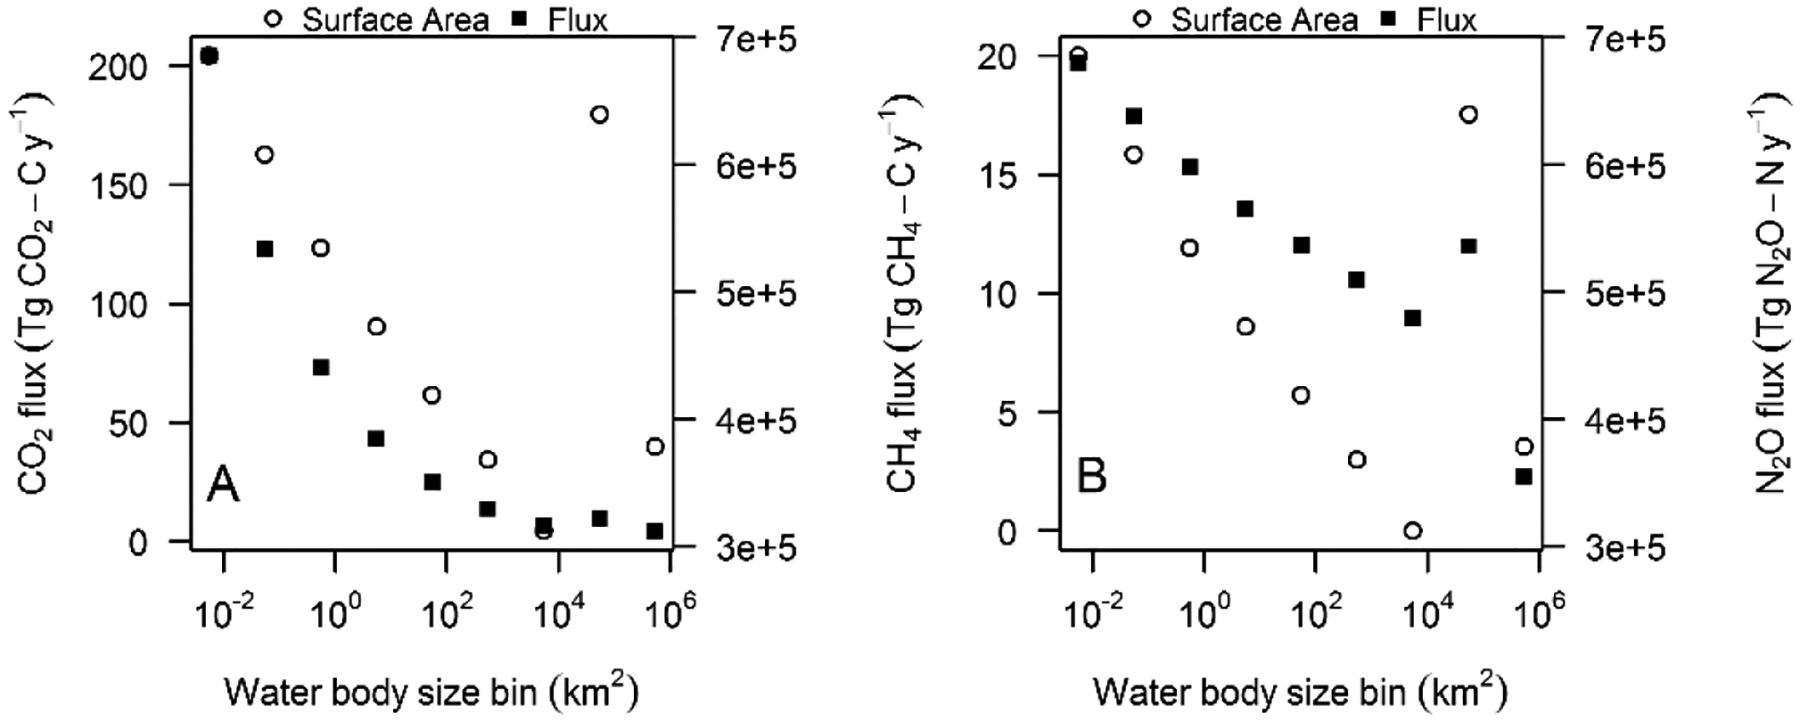
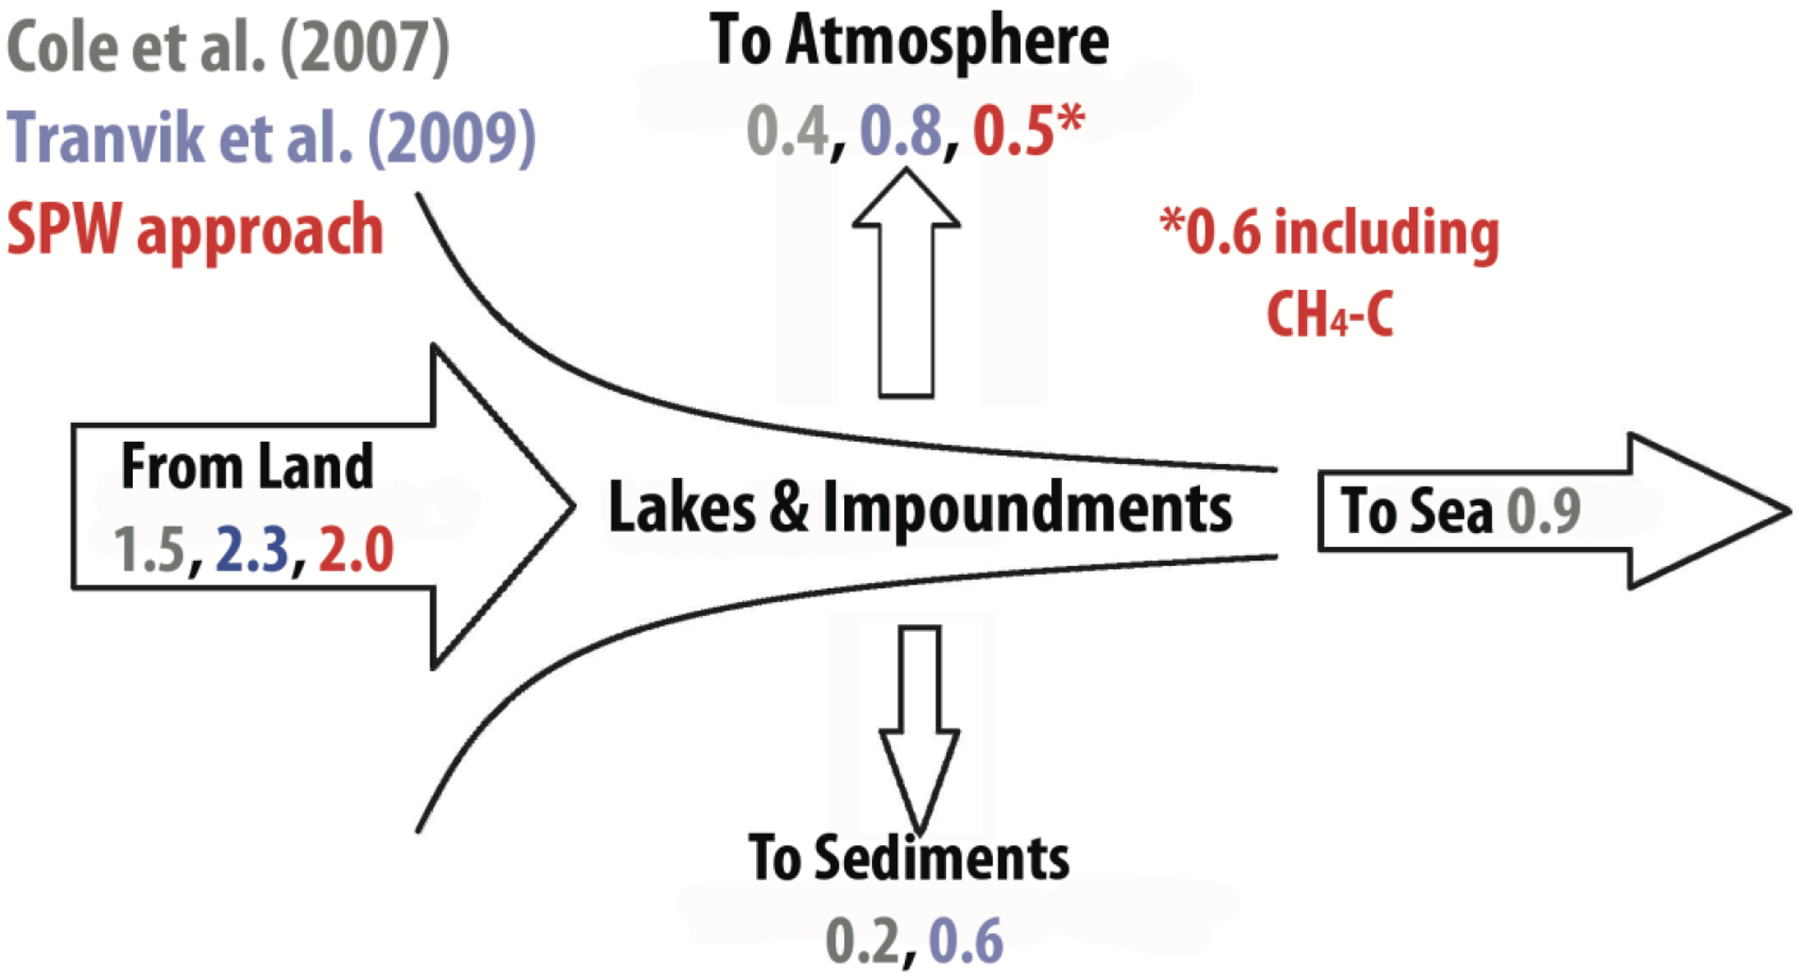
Lakes and impoundments are important sources of greenhouse gases (GHG: i.e., CO2, CH4, N2O), yet global emission estimates are based on regionally-biased averages and elementary upscaling. We assembled the largest global dataset to date on emission rates of all three GHGs and found they covary with lake size and trophic state. Fitted models were upscaled to estimate global emission using global lake size inventories and a remotely-sensed global lake productivity distribution. Traditional upscaling approaches overestimated CO2 and N2O emission but underestimated CH4 by half. Our upscaled size-productivity weighted estimates (1.25-2.30 Pg of CO2-equivalents annually) are nearly 20% of global CO2 fossil fuel emission with ~75% of the climate impact due to CH4. Moderate global increases in eutrophication could translate to 5-40% increases in the GHG effects in the atmosphere, adding the equivalent effect of another 13% of fossil fuel combustion or an effect equal to GHG emissions from current land use change.
Keywords: carbon dioxide; global; lakes; methane; nitrous oxide; reservoirs.
Figures
References
-
- Alin SR, and Johnson TC. 2007. Carbon cycling in large lakes of the world: A synthesis of production, burial, and lake-atmosphere exchange estimates. Global Biogeochemical Cycles 21: 1–12.
-
- Arbuckle KE, and Downing J. a.. 2001. The influence of watershed land use on lake N : P in a predominantly agricultural landscape. Limnology and Oceanography 46: 970–975.
-
- Bastviken D, Cole J, Pace M, and Tranvik L. 2004. Methane emissions from lakes: Dependence of lake characteristics, two regional assessments, and a global estimate. Global Biogeochemical Cycles 18: GB4009.
-
- Bastviken D, Tranvik LJ, Downing JA, Crill PM, and Enrich-prast A. 2011. Freshwater methane emissions offset the continental carbon sink - supporting information. Science 331: 50. - PubMed
-
- Beaulieu JJ, McManus MG, and Nietch CT. 2016. Estimates of reservoir methane emissions based on a spatially balanced probabilistic-survey. Limnology and Oceanography 61: S27–S40.
Grants and funding
LinkOut - more resources
Full Text Sources