. 2019 Jul 31;1(4):e180096.
doi: 10.1148/ryai.2019180096.

Improving Accuracy and Efficiency with Concurrent Use of Artificial Intelligence for Digital Breast Tomosynthesis

Affiliations

Improving Accuracy and Efficiency with Concurrent Use of Artificial Intelligence for Digital Breast Tomosynthesis

Emily F Conant et al. Radiol Artif Intell. .

Abstract

Purpose: To evaluate the use of artificial intelligence (AI) to shorten digital breast tomosynthesis (DBT) reading time while maintaining or improving accuracy.

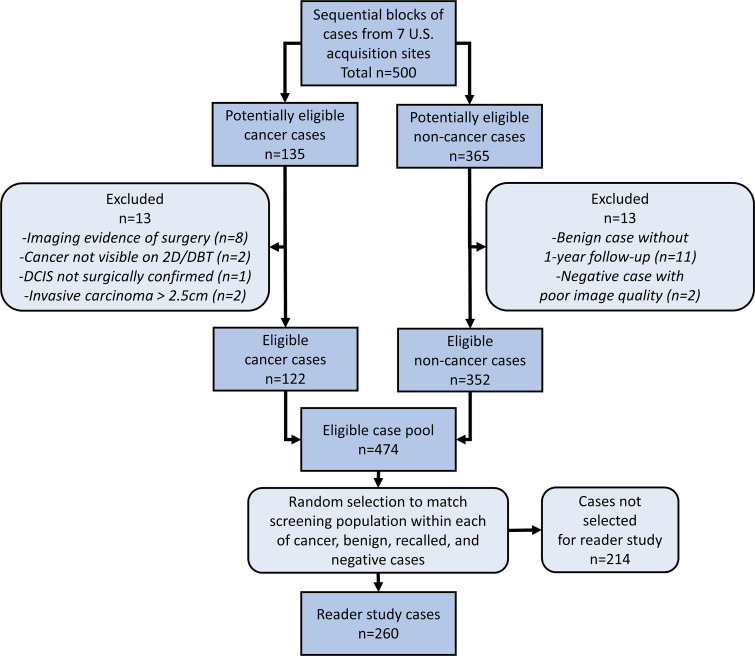
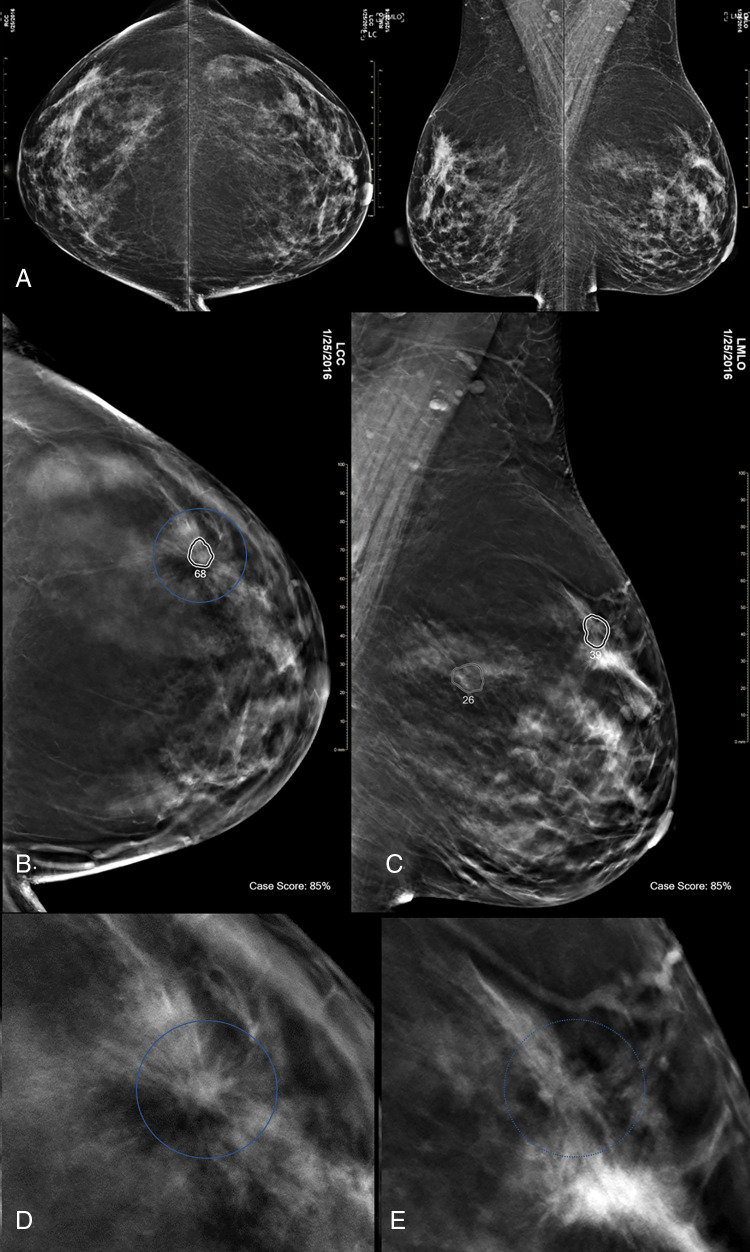
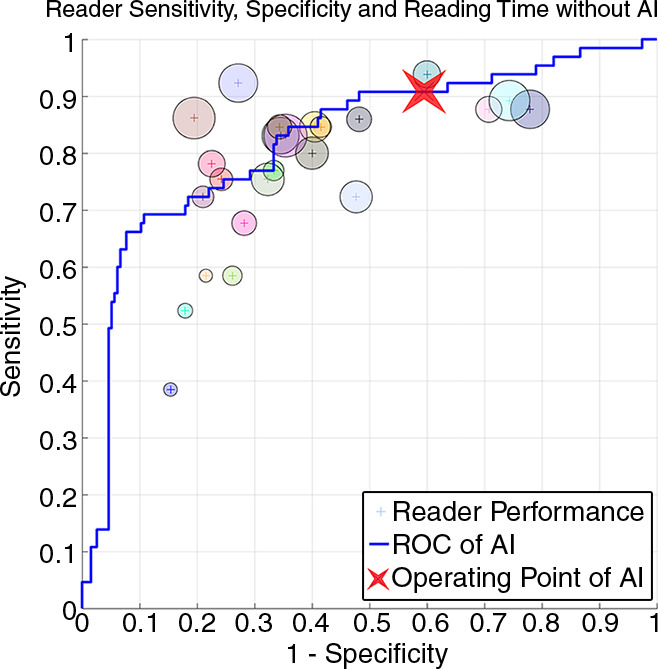
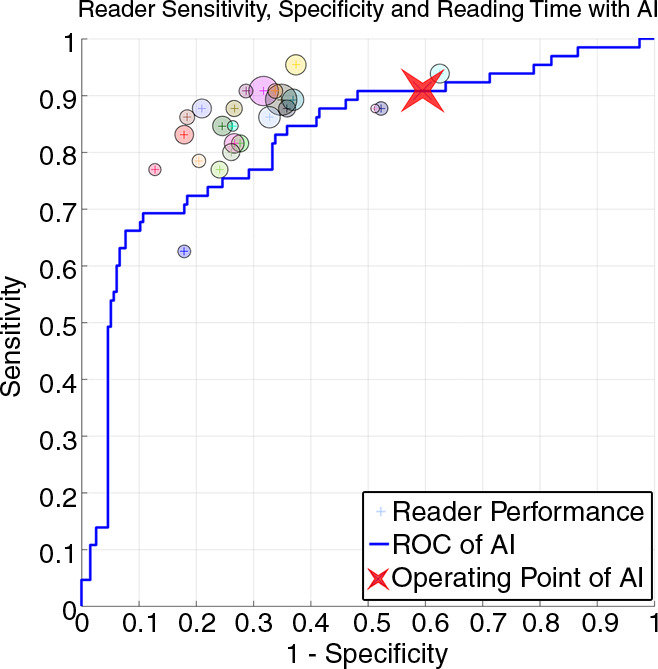
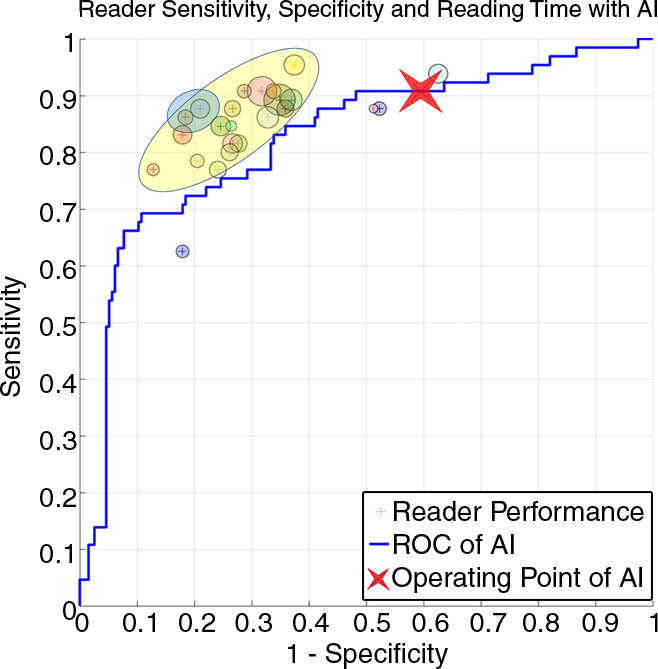
Materials and methods: A deep learning AI system was developed to identify suspicious soft-tissue and calcified lesions in DBT images. A reader study compared the performance of 24 radiologists (13 of whom were breast subspecialists) reading 260 DBT examinations (including 65 cancer cases) both with and without AI. Readings occurred in two sessions separated by at least 4 weeks. Area under the receiver operating characteristic curve (AUC), reading time, sensitivity, specificity, and recall rate were evaluated with statistical methods for multireader, multicase studies.

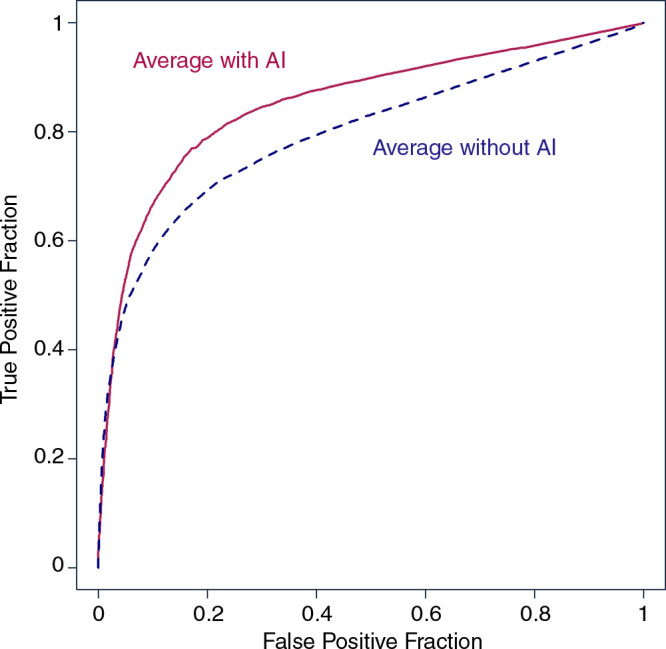
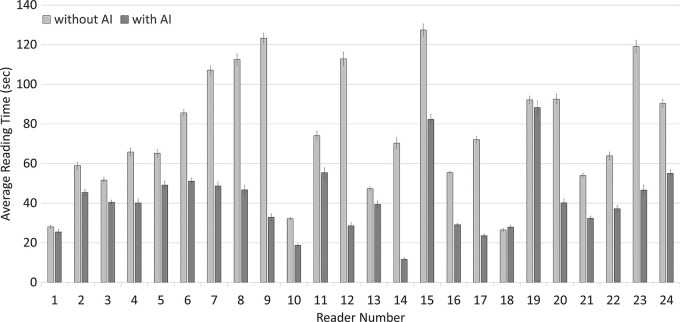
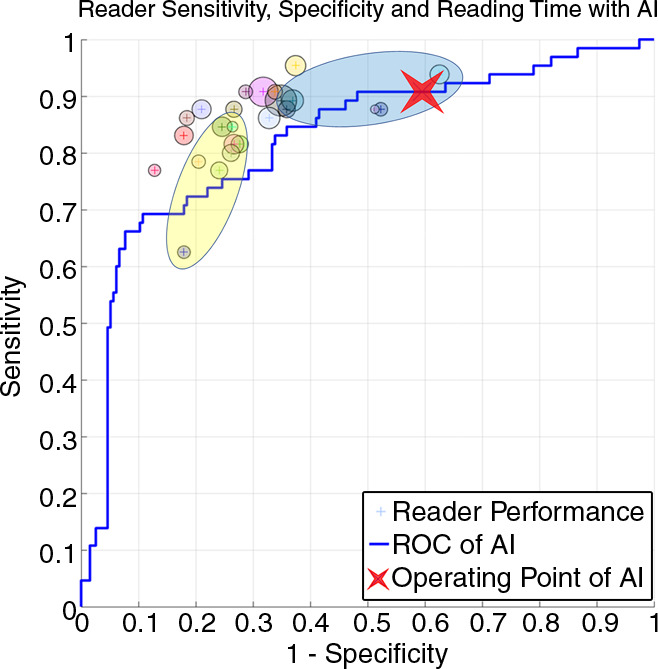
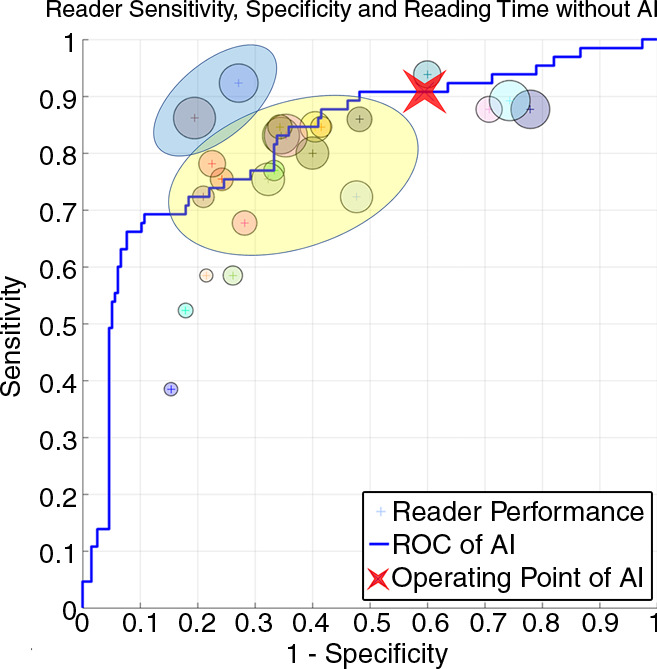
Results: Radiologist performance for the detection of malignant lesions, measured by mean AUC, increased 0.057 with the use of AI (95% confidence interval [CI]: 0.028, 0.087; P < .01), from 0.795 without AI to 0.852 with AI. Reading time decreased 52.7% (95% CI: 41.8%, 61.5%; P < .01), from 64.1 seconds without to 30.4 seconds with AI. Sensitivity increased from 77.0% without AI to 85.0% with AI (8.0%; 95% CI: 2.6%, 13.4%; P < .01), specificity increased from 62.7% without to 69.6% with AI (6.9%; 95% CI: 3.0%, 10.8%; noninferiority P < .01), and recall rate for noncancers decreased from 38.0% without to 30.9% with AI (7.2%; 95% CI: 3.1%, 11.2%; noninferiority P < .01).

Conclusion: The concurrent use of an accurate DBT AI system was found to improve cancer detection efficacy in a reader study that demonstrated increases in AUC, sensitivity, and specificity and a reduction in recall rate and reading time.© RSNA, 2019See also the commentary by Hsu and Hoyt in this issue.


Conflict of interest statement

Disclosures of Conflicts of Interest: E.F.C. Activities related to the present article: institution received grant from iCAD to support E.F.C.’s time for oversight of the reader study and the resulting data analysis. Activities not related to the present article: is a consultant for Hologic; institution has received a grant from Hologic for data review and analysis; institution has received a PO1 grant (multi-institutional) from the National Cancer Institute to allow retrospective review of data and analysis; has received payment from ICPME for lectures on digital breast tomosynthesis. Other relationships: disclosed no relevant relationships. A.Y.T. Activities related to the present article: is an employee of Biostatistics Consulting and served as the statistical team lead for the study from design through analysis, in the role of consultant to the device manufacturer; was paid for writing or reviewing the manuscript as part of the consulting services provided by institution to the device manufacturer; is a consultant for iCAD. Activities not related to the present article: Biostatistics Consulting provides similar statistical services for entities other than this device manufacturer. None of those projects are CAD/AI for breast imaging, the device studied in the current project. Other relationships: disclosed no relevant relationships. S.P. Activities related to the present article: is employed by iCAD as Vice President of Research. Activities not related to the present article: disclosed no relevant relationships. Other relationships: disclosed no relevant relationships. S.V.F. Activities related to the present article: is an employee of and owns stock or stock options in iCAD. Activities not related to the present article: disclosed no relevant relationships. Other relationships: disclosed no relevant relationships. J.G. Activities related to the present article: is employed by iCAD as Chief Technical Officer; owns stock or stock options in iCAD as a term of employment. Activities not related to the present article: disclosed no relevant relationships. Other relationships: disclosed no relevant relationships. J.E.B. Activities related to the present article: is employed by and is a shareholder in Intrinsic Imaging; Intrinsic Imaging performed the reader study, which was financially supported by iCAD. Activities not related to the present article: disclosed no relevant relationships. Other relationships: disclosed no relevant relationships. J.W.H. Activities related to the present article: is employed by iCAD as Vice President and Medical Director. Activities not related to the present article: disclosed no relevant relationships. Other relationships: disclosed no relevant relationships.

Figures

Figure 1:
Figure 1:
Case selection flowchart. Cases with imaging evidence of prior breast surgery (n = 8) were excluded because readers were not provided history or prior examinations. The following cancer cases were also excluded: Cases with primary breast cancers that were not visible mammographically (n = 1 detected with US; n = 1 detected because palpable), cases with biopsy results of ductal carcinoma in situ (DCIS) that were not surgically confirmed (n = 1), and invasive carcinomas larger than 2.5 cm (n = 2). Lesion size was based on surgical pathologic findings when available or longest linear dimension on study images. A breast subspecialist truthing radiologist (J.E.B) who was not a study reader annotated the location and extent of malignant lesions on two-dimensional (2D) images and digital breast tomosynthesis (DBT) images. The reference standard was biopsy proof for all cancer cases and excision of any benign histopathologic findings or concordant biopsy of fibroadenoma or fibrocystic changes for benign cases. Benign cases in which the patient had undergone aspiration and those with discordant biopsy or concordant biopsy of histopathologic findings other than fibroadenoma or fibrocystic changes also required normal imaging at least 1 year (320 days) after the study DBT examination (n = 11 excluded for lack of 1-year follow-up). Normal 1-year follow-up imaging findings was the reference standard for recalled (Breast Imaging Reporting and Data System [BI-RADS] category 0) and negative (BI-RADS category 1 or 2) cases. Two negative cases were excluded because of poor image quality. Cases with implants that had implant-displaced views were included (n = 4 in 474 case pool, n = 3 in 260 reader study cases).
Figure 2:
Figure 2:
Average of empirical receiver operating characteristic plots with and without artificial intelligence (AI). True-positive fraction = case-level sensitivity, false-positive fraction = 1 − specificity.
Figure 3:
Figure 3:
Bar graph shows average reading times for each reader without and with artificial intelligence (AI).
Figure 4:
Figure 4:
Images in a 74-year-old woman at screening with combination digital mammography (DM) and digital breast tomosynthesis (DBT). A, DM views show small, focal asymmetry that is seen only in the right craniocaudal (RCC) view. Right DBT views show small spiculated mass in upper outer quadrant, better seen on, B, RCC than, C, right mediolateral oblique (RMLO) view. The artificial intelligence (AI) case score of 38% was displayed at the bottom of the DBT views, and two AI outlines and lesion scores (27 for small spiculated mass; 23 for false-positive finding) were displayed on the RCC DBT view. Readers could click on the outlines on any DBT image and automatically advance to the DBT image where the lesion was detected by AI. D, E, Zoomed, D, RCC, and, E, RMLO DBT views show small spiculated mass that proved to be an 8-mm invasive ductal carcinoma (estrogen receptor positive, progesterone receptor positive, human epidermal growth factor receptor 2 negative, low Ki67 level). Twelve more readers detected the malignant mass with AI, while reducing average reading time across all 24 readers: Six (25%) of the 24 readers detected the mass without AI (reading time, 77.6 seconds), and 18 (75%) readers detected it with AI (reading time, 57.0 seconds).
Figure 5:
Figure 5:
Images in a 47-year-old woman at screening with combination digital mammography (DM) and digital breast tomosynthesis (DBT). A, DM views show no suspicious findings. Left DBT views show 7-mm spiculated mass in outer breast seen only in, B, left craniocaudal (LCC) view and not seen in, C, left mediolateral oblique (LMLO) view. The artificial intelligence (AI) case score of 85% was displayed at the bottom of DBT views, with one AI outline and lesion score (68 for spiculated mass) displayed on the LCC DBT view and two AI outlines and lesion scores (39 for potential correlate of spiculated mass; 26 for false-positive finding) displayed on the LMLO DBT view. Readers could click on the outlines on any DBT image and automatically advance to the DBT image where the lesion was detected by AI. D,E, Zoomed, D, LCC, and, E, LMLO DBT views show spiculated mass (dotted circle for potential correlate on LMLO), which proved to be a 5-mm invasive ductal carcinoma with associated ductal carcinoma in situ (estrogen receptor positive, progesterone receptor positive, human epidermal growth factor receptor 2 negative, low Ki67 level). Ten more readers detected the malignant mass with AI, while reducing average reading time across all 24 readers: Twelve (50%) of 24 readers detected the mass without AI (reading time, 110.3 seconds) and 22 (92%) readers detected it with AI (reading time, 62.3 seconds).
Figure 6a:
Figure 6a:
Graphs show (a, c, e) average case-level performance for each reader without artificial intelligence (AI) and (b, d, f) with AI. Locations of small circles = sensitivity and specificity. Diameters of small circles are proportional to reading time; a decrease in circle size from readings without AI to readings with AI reflects the relative decrease in reading time for the individual reader. (cf) Graphs highlight specific groups of readers and their changes in sensitivity, specificity, and reading time. The large yellow circle in c and d shows a group of four readers who without AI have high specificity, low sensitivity, and short reading times. With AI, these readers maintain their relatively short reading times and high specificity but improve their sensitivity. As demonstrated by the large blue circle in c and d, four readers who have low specificity but high sensitivity without AI improve their reading times and specificity and maintain their relatively high sensitivity. The large yellow circle in e and f shows a group of readers with generally high sensitivities and specificities without AI who with AI generally improve all three parameters (reading time, sensitivity, and specificity). The large blue circle in e and f indicates the only two readers in our study who had slight decreases in area under the receiver operating characteristic (ROC) curve (AUC) when reading with AI compared with reading without AI. Their reductions in AUC were quite small at −0.014 (right small circle) and −0.004 (left small circle); however, they both experienced significant reductions in reading time. The right reader had the fourth largest reduction of all readers of −65.7 seconds, and the left reader had the largest reduction of all, −90.4 seconds. (af) Graphs also show the AI stand-alone performance ROC curve (no human reader, blue line) and operating point (red “X”) with the 260 enriched reader study cases. The AI operating point case-level sensitivity was 91% (59 of 65; 95% confidence interval [CI]: 81%, 96%), and its specificity was 41% (79 of 195; 95% CI: 34%, 48%).
Figure 6b:
Figure 6b:
Graphs show (a, c, e) average case-level performance for each reader without artificial intelligence (AI) and (b, d, f) with AI. Locations of small circles = sensitivity and specificity. Diameters of small circles are proportional to reading time; a decrease in circle size from readings without AI to readings with AI reflects the relative decrease in reading time for the individual reader. (cf) Graphs highlight specific groups of readers and their changes in sensitivity, specificity, and reading time. The large yellow circle in c and d shows a group of four readers who without AI have high specificity, low sensitivity, and short reading times. With AI, these readers maintain their relatively short reading times and high specificity but improve their sensitivity. As demonstrated by the large blue circle in c and d, four readers who have low specificity but high sensitivity without AI improve their reading times and specificity and maintain their relatively high sensitivity. The large yellow circle in e and f shows a group of readers with generally high sensitivities and specificities without AI who with AI generally improve all three parameters (reading time, sensitivity, and specificity). The large blue circle in e and f indicates the only two readers in our study who had slight decreases in area under the receiver operating characteristic (ROC) curve (AUC) when reading with AI compared with reading without AI. Their reductions in AUC were quite small at −0.014 (right small circle) and −0.004 (left small circle); however, they both experienced significant reductions in reading time. The right reader had the fourth largest reduction of all readers of −65.7 seconds, and the left reader had the largest reduction of all, −90.4 seconds. (af) Graphs also show the AI stand-alone performance ROC curve (no human reader, blue line) and operating point (red “X”) with the 260 enriched reader study cases. The AI operating point case-level sensitivity was 91% (59 of 65; 95% confidence interval [CI]: 81%, 96%), and its specificity was 41% (79 of 195; 95% CI: 34%, 48%).
Figure 6c:
Figure 6c:
Graphs show (a, c, e) average case-level performance for each reader without artificial intelligence (AI) and (b, d, f) with AI. Locations of small circles = sensitivity and specificity. Diameters of small circles are proportional to reading time; a decrease in circle size from readings without AI to readings with AI reflects the relative decrease in reading time for the individual reader. (cf) Graphs highlight specific groups of readers and their changes in sensitivity, specificity, and reading time. The large yellow circle in c and d shows a group of four readers who without AI have high specificity, low sensitivity, and short reading times. With AI, these readers maintain their relatively short reading times and high specificity but improve their sensitivity. As demonstrated by the large blue circle in c and d, four readers who have low specificity but high sensitivity without AI improve their reading times and specificity and maintain their relatively high sensitivity. The large yellow circle in e and f shows a group of readers with generally high sensitivities and specificities without AI who with AI generally improve all three parameters (reading time, sensitivity, and specificity). The large blue circle in e and f indicates the only two readers in our study who had slight decreases in area under the receiver operating characteristic (ROC) curve (AUC) when reading with AI compared with reading without AI. Their reductions in AUC were quite small at −0.014 (right small circle) and −0.004 (left small circle); however, they both experienced significant reductions in reading time. The right reader had the fourth largest reduction of all readers of −65.7 seconds, and the left reader had the largest reduction of all, −90.4 seconds. (af) Graphs also show the AI stand-alone performance ROC curve (no human reader, blue line) and operating point (red “X”) with the 260 enriched reader study cases. The AI operating point case-level sensitivity was 91% (59 of 65; 95% confidence interval [CI]: 81%, 96%), and its specificity was 41% (79 of 195; 95% CI: 34%, 48%).
Figure 6d:
Figure 6d:
Graphs show (a, c, e) average case-level performance for each reader without artificial intelligence (AI) and (b, d, f) with AI. Locations of small circles = sensitivity and specificity. Diameters of small circles are proportional to reading time; a decrease in circle size from readings without AI to readings with AI reflects the relative decrease in reading time for the individual reader. (cf) Graphs highlight specific groups of readers and their changes in sensitivity, specificity, and reading time. The large yellow circle in c and d shows a group of four readers who without AI have high specificity, low sensitivity, and short reading times. With AI, these readers maintain their relatively short reading times and high specificity but improve their sensitivity. As demonstrated by the large blue circle in c and d, four readers who have low specificity but high sensitivity without AI improve their reading times and specificity and maintain their relatively high sensitivity. The large yellow circle in e and f shows a group of readers with generally high sensitivities and specificities without AI who with AI generally improve all three parameters (reading time, sensitivity, and specificity). The large blue circle in e and f indicates the only two readers in our study who had slight decreases in area under the receiver operating characteristic (ROC) curve (AUC) when reading with AI compared with reading without AI. Their reductions in AUC were quite small at −0.014 (right small circle) and −0.004 (left small circle); however, they both experienced significant reductions in reading time. The right reader had the fourth largest reduction of all readers of −65.7 seconds, and the left reader had the largest reduction of all, −90.4 seconds. (af) Graphs also show the AI stand-alone performance ROC curve (no human reader, blue line) and operating point (red “X”) with the 260 enriched reader study cases. The AI operating point case-level sensitivity was 91% (59 of 65; 95% confidence interval [CI]: 81%, 96%), and its specificity was 41% (79 of 195; 95% CI: 34%, 48%).
Figure 6e:
Figure 6e:
Graphs show (a, c, e) average case-level performance for each reader without artificial intelligence (AI) and (b, d, f) with AI. Locations of small circles = sensitivity and specificity. Diameters of small circles are proportional to reading time; a decrease in circle size from readings without AI to readings with AI reflects the relative decrease in reading time for the individual reader. (cf) Graphs highlight specific groups of readers and their changes in sensitivity, specificity, and reading time. The large yellow circle in c and d shows a group of four readers who without AI have high specificity, low sensitivity, and short reading times. With AI, these readers maintain their relatively short reading times and high specificity but improve their sensitivity. As demonstrated by the large blue circle in c and d, four readers who have low specificity but high sensitivity without AI improve their reading times and specificity and maintain their relatively high sensitivity. The large yellow circle in e and f shows a group of readers with generally high sensitivities and specificities without AI who with AI generally improve all three parameters (reading time, sensitivity, and specificity). The large blue circle in e and f indicates the only two readers in our study who had slight decreases in area under the receiver operating characteristic (ROC) curve (AUC) when reading with AI compared with reading without AI. Their reductions in AUC were quite small at −0.014 (right small circle) and −0.004 (left small circle); however, they both experienced significant reductions in reading time. The right reader had the fourth largest reduction of all readers of −65.7 seconds, and the left reader had the largest reduction of all, −90.4 seconds. (af) Graphs also show the AI stand-alone performance ROC curve (no human reader, blue line) and operating point (red “X”) with the 260 enriched reader study cases. The AI operating point case-level sensitivity was 91% (59 of 65; 95% confidence interval [CI]: 81%, 96%), and its specificity was 41% (79 of 195; 95% CI: 34%, 48%).
Figure 6f:
Figure 6f:
Graphs show (a, c, e) average case-level performance for each reader without artificial intelligence (AI) and (b, d, f) with AI. Locations of small circles = sensitivity and specificity. Diameters of small circles are proportional to reading time; a decrease in circle size from readings without AI to readings with AI reflects the relative decrease in reading time for the individual reader. (cf) Graphs highlight specific groups of readers and their changes in sensitivity, specificity, and reading time. The large yellow circle in c and d shows a group of four readers who without AI have high specificity, low sensitivity, and short reading times. With AI, these readers maintain their relatively short reading times and high specificity but improve their sensitivity. As demonstrated by the large blue circle in c and d, four readers who have low specificity but high sensitivity without AI improve their reading times and specificity and maintain their relatively high sensitivity. The large yellow circle in e and f shows a group of readers with generally high sensitivities and specificities without AI who with AI generally improve all three parameters (reading time, sensitivity, and specificity). The large blue circle in e and f indicates the only two readers in our study who had slight decreases in area under the receiver operating characteristic (ROC) curve (AUC) when reading with AI compared with reading without AI. Their reductions in AUC were quite small at −0.014 (right small circle) and −0.004 (left small circle); however, they both experienced significant reductions in reading time. The right reader had the fourth largest reduction of all readers of −65.7 seconds, and the left reader had the largest reduction of all, −90.4 seconds. (af) Graphs also show the AI stand-alone performance ROC curve (no human reader, blue line) and operating point (red “X”) with the 260 enriched reader study cases. The AI operating point case-level sensitivity was 91% (59 of 65; 95% confidence interval [CI]: 81%, 96%), and its specificity was 41% (79 of 195; 95% CI: 34%, 48%).

Comment in

References

    1. Skaane P, Bandos AI, Gullien R, et al. . Comparison of digital mammography alone and digital mammography plus tomosynthesis in a population-based screening program. Radiology 2013;267(1):47–56. - PubMed
    1. Friedewald SM, Rafferty EA, Rose SL, et al. . Breast cancer screening using tomosynthesis in combination with digital mammography. JAMA 2014;311(24):2499–2507. - PubMed
    1. Sharpe RE Jr, Venkataraman S, Phillips J, et al. . Increased cancer detection rate and variations in the recall rate resulting from implementation of 3D digital breast tomosynthesis into a population-based screening program. Radiology 2016;278(3):698–706. - PMC - PubMed
    1. Hooley RJ, Durand MA, Philpotts LE. Advances in digital breast tomosynthesis. AJR Am J Roentgenol 2017;208(2):256–266. - PubMed
    1. ACR Statement on Breast Tomosynthesis. American College of Radiology Web site. https://www.acr.org/Advocacy-and-Economics/ACR-Position-Statements/Breas.... Published November 24, 2014. Accessed October 24, 2018.

LinkOut - more resources